Paper Menu >>
Journal Menu >>
 American Journal of Plant Sciences, 2010, 1, 95-1 03 doi:10.4236/ajps.2010.12012 Published Online December 2010 (http://www.SciRP.org/journal/ajps) Copyright © 2010 SciRes. AJPS 95 Genetic Diversity within Wild Potato Species (Solanum spp.) Revealed by AFLP and SCAR Markers Angelina Nunziata1, Valentino Ruggieri1, Nicola Greco2, Luigi Frusciante1, Amalia Barone1* 1Department of Soil, Plant, Environmental and Animal Production Sciences, University of Naples ‘‘Federico II’’, Via Università 100, Portici, Italy; 2Institute for Plant Protection, Section of Bari, National Research Council, Via G. Amendola, Bari, Italy. Email: *ambarone@unina.it Received July 24th, 2010; revised September 27th, 2010; accepted November 8th, 2010. ABSTRACT Exploitation of variab ility displayed by wild Solanum species for b reeding the cu ltivated potato (S. tub erosum) requires phenotypic and genotypic characterization of germplasm resources. In the present work, a collection of 15 wild So- lanum species was investigated for resistance to pathotype Ro2 of the nematode Globodera rostochiensis. Most of the genotypes reduced reproduction of the nematode, compared to the control variety Spunta, a highly resistant genotype being an accession of S. tuberosum spp. andigena. The genetic variability of the Gro1 gene cluster, which confers re- sistance to some pathotypes of G. rostochiensis, was then studied in the Solanum species used in this study. For this purpose, SCAR markers for eight paralogues of Gro1 gene were developed. No species showed the same pattern of the resistant control genotype. Moreover, wide-genome variability was also assessed by using AFLP markers, which al- lowed species-specific ma rkers to be identified for each geno type analyzed Keywords: Potato, Nematode Resistance, Globodera Rostochiensis, Gro1 Gene Cluster-SCAR Markers, AFLP Markers 1. Introduction The genus Solanum contains more than 2000 species, distributed in very different habitats. Among these, more than 200 tuber-bearing species exist that could be par- ticularly important for improving the cultivated potato, Solanum tuberosum L. Indeed, wild species are known to be important sources of plant pathogen resistance genes, as well as of many other interesting traits [1]. This has been underlined in subsection Potatoe of the Solanum genus, which includes several tuber-bearing wild species already used to improve the cultivated potato [2], par- ticularly for resistance against the variety of pathogens that negativ ely affect potato productio n [3]. Moreo ver, in the last years, potato breeding deeply increased its effi- ciency by the aid of molecular markers [4,5]. Indeed, molecular fingerprinting of various potato wild species [6,7] and assisted-selection (MAS) [8] allow a better ge- netic resources managment and a more efficient gene transfer among Solanum species. Among pathogens that affect potato production, the cyst nematodes Globodera rostochiensis and G. pallida cause severe damage to the cultivated potato and are found worldwide [9]. Resistance to G. rostochiensis has already been introgressed into S. tuberosum from some Solanum wild species, such as S. andigena, S. vernei and S. spegazzinii [10,11], and has been associated with sin- gle genes and quantitative trait lo ci (QTLs). As an exam- ple, the locus H1 was introgressed from S. andigena and mapped on a distal position of chromosome V; it confers resistance to G. rostochiensis pathotypes Ro1 and Ro4 [12]. Another important source of broad spectrum resis- tance to potato cyst nematodes has been mapped on chromosome V (locus Grp1): it is a QTL and confers high resistance levels to G. rostochiensis pathotype Ro5 and to several populations of Globodera pallida [13]. This resistance was found in an interspecific hybrid re- sulting from a complex breeding scheme involving S. tuberosum, S. vernei, S. vernei ssp. ballsii, S. olocense and S. tuberosum ssp. andigena. Finally, a source of resistance to G. rostochiensis pathotypes Ro1 and Ro5 derives from S. spegazzinii: it is due to the gene Gro1 that was mapped on chromosome VII [14] and was then sequenced and characterized by means of positional cloning [15]. In particular, it was evidenced that the resistance gene, named Gro1-4, is part  Genetic diversity within Wild Potato Species (Solanum spp.) Revealed by AFLP and SCAR Markers Copyright © 2010 SciRes. AJPS 96 of a complex cluster of paralogue genes, some of which seem to be true genes, and others pseudogenes. Therefore some of these paralogues could also confer resistance to other pathotypes of G. rostochiensis or to different pathogens, as already reported for the resistance gene Mi-1 in tomato [16]. This could be particularly interest- ing for finding sources of resistance to pathotype Ro2 of G. rostochiensis, which causes severe damage to culti- vated potato in Italy. Therefore our aim was to investigate a collection of Solanum wild species for: a) their response to G. rosto- chiensis pathotype Ro2, b) their genetic variability at a genome-wide level by AFLP markers, and c) their vari- ability at the Gro1 gene cluster through the design of SCAR markers specific for different paralogues. 2. Materials and Methods 2.1. Plant Material One accession from 15 Solanum wild species (listed in Table 1) was screened. Plant material was provided as true seed by the IR-1 Potato Introduction Project, Stur- geon Bay, WI. In addition to this material, a cultivar of S. tuberosum (cv. ‘Spunta’ ) and a diplo id S. spegazzinii × S. tuberosum hybrid (P 40) were studied. The latter was kindly provided by Dr. Gebhardt (Max-Planck-Institut Koln, Germany) and is the resistant genotype used for RFLP mapping of locus Gro1 and for Gro1-4 cloning and sequencing [14,15]. Table 1. Accessions of Solanum wild species analyzed with their geographical origin: Plant Introduction number is indicated as well as the code used in the present work. Species Plant introduction number (P.I.) Code Geographical Origin S. acaule 210029 ACL 1 Bolivia S. boliviense 310974 BLV 1 Bolivia S. bulbocastanum 243510 BLB 3 Mexico S. canasense 265863 CAN 1 Peru S. cardiophyllum 347759 CPH 2 Mexico S. chacoense 133124 CHC 1 Uruguay S. demissum 205625 DMS 1 Mexico S. fendleri 458417 FEN 2 USA S. hougasii 161726 HOU 1 Mexico S. jamesii 275263 JAM 1 USA S. multidissectum 8MLT-MI MLT 1 Peru S. phureja IVP 35 IVP 35 Colombia S. stoloniferum 275248 STO 1 Mexico S. tarijense 265577 TAR 1 Bolivia S. tuberosum ssp. andigena 205624 TBR1 Bolivia Seeds for each accession were sterilized in 20% bleach for 10 min and were germinated in vitro on MS medium [17] in a growth chamber (24℃ and 16 h of light/day). All studied genotypes were maintained as micropropa- gated plants on MS medium with 1% sucrose and 0.8% agar, and incubated at 4000 lux, 16 h light, and 24℃. To produce plant material for this study, four week-old plants were transferred to styrofoam trays filled with sterile soil and acclimated in a growth chamber at 20℃. After two weeks, they were transferred to 5-cm-diameter plastic pots and grown in a temperature-controlled greenhouse (20–24℃). 2.2. Response to Globodera Rostochiensis The 15 Solanum genotypes were tested for their response to pathotype Ro2 of Globodera rostochiensis. The symp- toms revealed were compared with those of the suscepti- ble cv. ‘Spunta’, used as control. The nematode popula- tion was reared on potato cv. Spunta in pots containing 2.8 dm3 of sandy soil (89% sand) in a greenhouse at 20 ± 2℃. To estimate the nematode populatio n densities, three 200-g soil samples were processed with a Fenwick can. The cysts were separated from soil debris by means of flotation in alcohol [18], and then counted, crushed ac- cording to Bijloo’s modified method [19] and their egg content determined. Five plants per genotype were trans- planted into 5-cm diameter plastic pots containing organic potting soil and adapted to standard greenhouse condi- tions. Thirty days later, these plantlets were transplanted into 14-cm diameter clay pots containing 1000 cm3 of steam-sterilized sandy soil (89% sand) infested with the nematode. At planting, the nematode population density was 20 eggs/g soil of pathotype Ro2. Pots were main- tained in a greenhouse at 20 ± 2℃. Two months later, the plants were cut at ground level and the soil left to dry. Then the soil of each pot was mixed and a 200-g sub- sample processed as mentioned above to estimate the nematode population density. Reproduction rate was computed by measuring the eggs/g soil found at the end of the test against the eggs/g soil at the inoculum. All data were subjected to ANOVA in order to verify that response to the nematode was genotype dependent and after they were analyzed by Duncan’s multiple range test [20]. 2.3. AFLP Analysis AFLP analysis was performed on plant material using the method described by Vos et al. [21] and the commer- cially available AFLP ki t and protocol (Gi bco-BRL AFLP analysis System I, Life Technologies, Gaithersburg, MD), which employs EcoRI and MseI as restriction enzymes. For selective amplification, five co mbinations of primers were used (EcoRI-ACT + MseI-CTC; EcoRI-ACC +  Genetic diversity within Wild Potato Species (Solanum spp.) Revealed by AFLP and SCAR Markers Copyright © 2010 SciRes. AJPS 97 MseI-CAA; EcoRI-ACC + MseI-CAT; EcoRI-ACC + MseI-CTA; EcoRI-AAC + MseI-CAG) with the EcoRI primer in each pair being labelled with FAM fluoro- chrome. AFLP fragments were separated by capillary electrophoresis on ABI Prism 3100 Avant Sequence Analyser (Applied Biosystems). AFLPs electrophero- grams were read and compared using Gene Mapper V3.7 software (Applied Biosystems). A panel was created for each primer combination and polymorphisms were scored as 1 (presence of fragment) or 0 (absence of fragment). 2.4. SCAR Analysis For SCAR analysis, specific primers for each paralogue of the Gro1 cluster (Gro1-2, Gro1-3, Gro1-4, Gro1-5, Gro1-6, Gro1-8, Gro1-11, Gro1-14) from P40 resistance allele [15] were designed using sequences available in GenBank (accession numbers AY196151-AY196158). For this purpose, sequences specific to each paralogue were identified by means of multiple-sequence alignment tools (CLUSTAL-W) [22] and pairwise alignment (Local BLAST-N) [23]. On these paralogue-specific sequences, primer pairs were constructed using E-Primer3 Software (http://emboss.sourceforge.net/) or manually. Primer speci- ficity was verified by Local BLAST-N. Gro1-4 specific primers from Gebhardt et al. [5] were also used and are named 4RNA2. PCR was performed in a total volume of 25 µl con- taining 0.2 mM dNTPs, 2 mM MgCl2, 0.4 M of each primer and 1.25 U Taq DNA polymerase in the reaction buffer provided by the manufacturer (Invitrogen, Carls- bad, CA, USA). PCR conditions were as follows: 3 min at 94℃ followed by 35 cycles of 45 s at 92℃, 45 s at the primer pair specific annealing temperature, 1 min at 72℃ and finally 10 min at 72℃. Amplification patterns were compared and polymorphisms were scored as 1 (presence of fragment of expected size) or 0 (absence of expected fragment). 2.5. Cluster Analysis Similarity between clones was calculated both on AFLP analysis and SCAR analysis data using the Jaccard coef- ficient: J = a /(a + b + c), where a = number of bands present in x and y, b = number of bands present in x and absent in y, c = number of bands present in y and absent in x. The genetic similarities were graphically repre- sented by an un rooted dendrogram constructed using the UPGMA clustering algorithm (Unweighted Pair Group Method). Genetic similarity calculatio ns and dendrogram construction were performed using an NTSYS-pc pack- age [24]. Bootstrap analysis were then performed using WinBoot Software with a bootsrapping value of 1000 [25]. 3. Results 3.1. Response to Globodera Rostochiensis ANOVA carried on the results of the resistance test gave significant F values for all considered parameters in tests with 15 and 84 degrees of freedom (p < 0.01). In par- ticular F was 10.4 for eggs/g soil, 4.09 for eggs per cyst and 10.43 for the reproduction rate. As shown by Duncan test results, in general, the nematode pathotype Ro2 reproduced significantly less on the accessions of the wild Solanum species than on the susceptible control cv. Spunta (Table 2). The number of eggs/g soil of pathotype Ro2 on the wild clones varied from 1/6 (group A, abc) to about 1/2 (group B, d) of that on cv. Spunta (63.9; group C, e). The only exception was clone MLT1 for which this value (67.9; group C, e) was similar to that of the susceptible control. Differences were also observed in the number of eggs per cyst and in the reproduction rate of the nematode. There were sig- nificantly fewer eggs per cysts than in the control for clones BLB3, CAN1, JAM1 and TBR1. For clones ACL1, BLB3, JAM1, STO1 and TBR1, the reproduction rates of patho type Ro2 were < 1. Table 2. Accessions of Solanum wild species analyzed with their geographical origin: Plant Introduction number is indicated as well as the code used in the present work. Pathotype Ro2 Clone Eggs/g soil (no.) Eggs/cyst (no.) Reproduction rate ACL118.9 abc A B 129 bcde BC 0.9 abc A B BLV1 21.1 abcd AB 145 cdef BCD 1.1 abcd AB BLB3 1 8.5 abc AB 114 b AB 0.9 abc AB CAN122.2 abcd AB 120 bc ABC 1.1 abcd A B CPH2 25 .2 abcd AB 152 def BCD 1.3 abcd AB CHC132.3 cd B 131 bcde BC 1.6 cd B DMS121. 0 abc d AB 126 bcd BC 1.0 abcd AB FEN2 2 6.0 bcd AB 152 bcde BCD 1.3 bcd AB HOU133.0 d B 160 ef CD 1.6 d B JAM118.3 abc AB 120 bc ABC 0.9 ab AB MLT167.9 e C 174 f D 3.4 e C IVP3524.2 abcd AB 134 bcde BCD 1.2 abcd A B STO1 17.6 ab AB 131 bcde BC 0.9 abc A B TAR1 19.3 abcd AB 126 bcd BC 1.0 abcd AB TBR1 11.5 a AB 80 a A 0.6 a A Spunta63.9 e C 154 def BCD 3.1 e C  Genetic diversity within Wild Potato Species (Solanum spp.) Revealed by AFLP and SCAR Markers Copyright © 2010 SciRes. AJPS 98 3.2. AFLP Analysis Using five primer pairs an average of 317 fragments per genotype were scored for a total of 1084 bins. The num- ber of fragments scored for each genotype ranged from 148 for S. cardiophyllum to 470 for Spunta. The average number of selected bins per primer combination was 216, and ranged from 144 (EcoRI-ACC/MseI-CAT) to 350 (EcoRI-ACT/MseI-CTC) (data not shown). Most of the bins selected from each primer pair were polymorphic across the tested species (98.15%); only 20 were present in all the tested species. Among the polymorphic frag- ments, 88 were species-specific: the number of the spe- cies-specific fragments varied from 1 (for S. tuberosum subsp andigena and S. fendleerii) to 24 for S. tarijense. The most informative primer combinations identified from 26 to 33 species-specific fragments and allowed from 9 to 14 species to be discriminated (Table 3). Dendrogram analysis grouped the tested genotypes into one main group (bootstrap values of 58%), with the species S. tarijense, S. acaule S. bulbocastanum, S. jame- sii, S. canasense and S . cardiophyllum standing outside this cluster (Figure 1). The main group can be divided into two secondar y branch es, with a similarity coefficient between 28% and 39%. The similarity coefficient among species is never higher than 62% except for the two spe- cies S. fendleerii and S. tuberosum subs. andigena which group together with a similarity of about 79%. 3.3. SCAR Analysis Each region of the Gro1-4 gene was compared to other Gro1 paralogue sequences available in GenBank by means of Local Blast. This analysis allowed the length of specific regions for each paralogue to be identified, as reported in Table 4 . The regions which differed in length from the others were examined as paralogue-specific candidates, such as the region I intron for paralogue Gro1-5. Where no evident difference in length was detectable, polymorphic sites (SNP or INDEL) were identified by CLUSTAL-W, as was the case of region III intron of paralogue Gro1-3 where various SNPs were found. This analysis allowed at least one paralogue specific region to be identified for each of the eight genes deriving from the S. spegazzinii Gro1 resistant allele. Where possible, coding regions were chosen for subsequent analysis. On each of these paralogue-specific regions a primer pair was designed with no annealing on different regions of Gro1 seque nces. The primers used for SCAR analysis are listed in Ta- ble 5 and showed in Figure 2, including the primers for paralogue Gro1-4 from Gebhardt et al. [5]. Table 3. AFLP analysis: for each primer combination the number of species-specific fragments and of discriminated species are reported. Primer combination Species-specific fragment (no.) Discriminated species (no.) EcoRI-ACT/MseI-CTC26 9 EcoRI-ACC/MseI-CAA28 14 EcoRI-ACC/MseI-CAT0 - EcoRI-ACC/MseI-CTA1 1 EcoRI-AAC/MseI-CAG33 12 Figure 1. Unrooted dendogram built on the basis of UP- GMA clustering of AFLP markers. The similarity on the x-axis is based on Jaccard’s coefficient. Bootstrap values are reported at each cluster node. 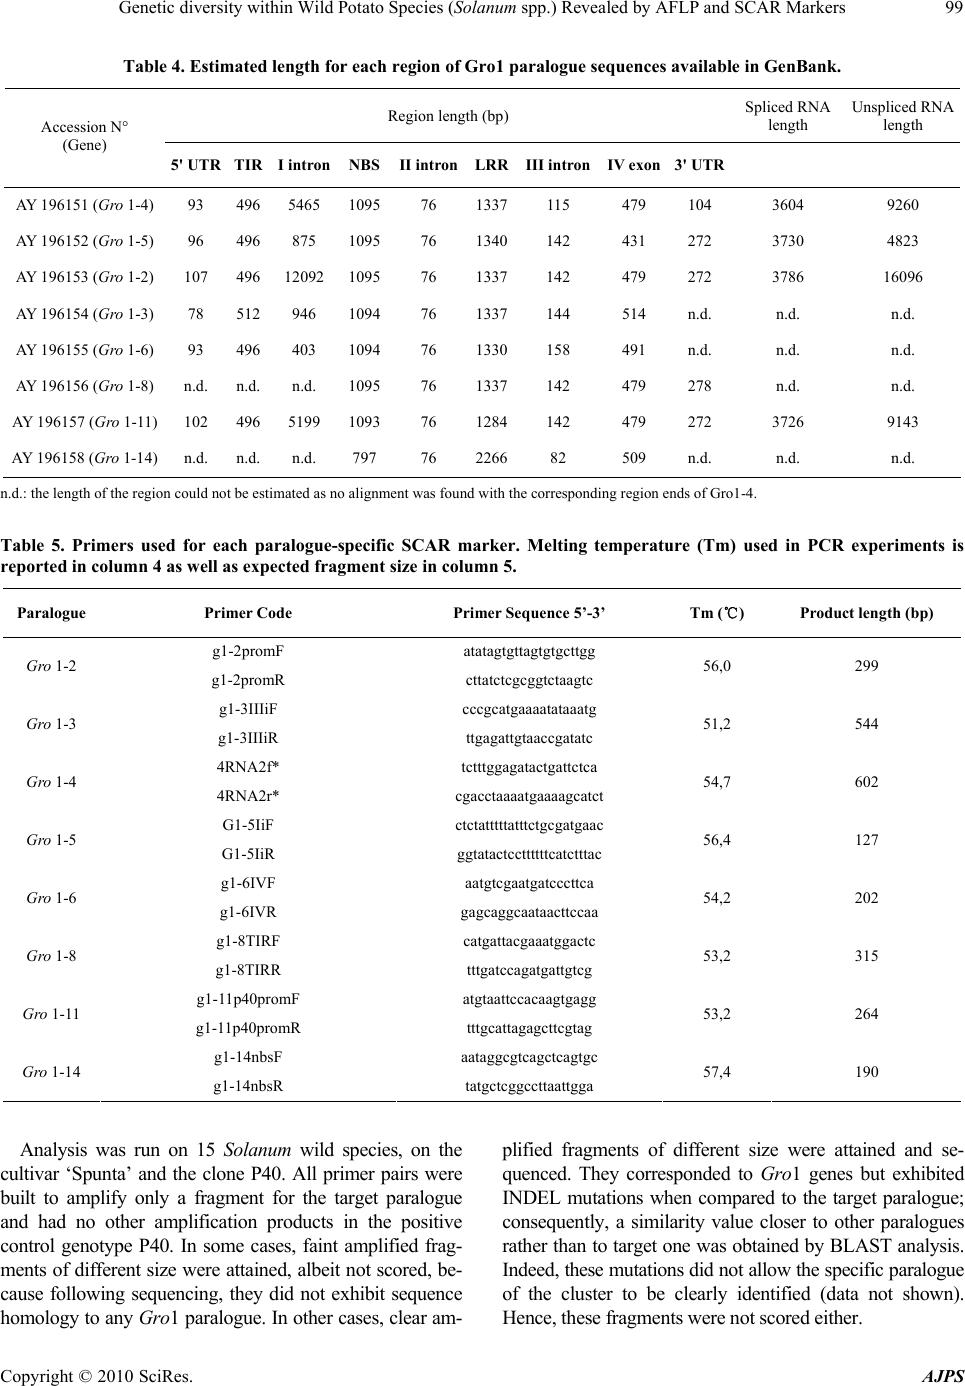 Genetic diversity within Wild Potato Species (Solanum spp.) Revealed by AFLP and SCAR Markers Copyright © 2010 SciRes. AJPS 99 Table 4. Estimated length for each region of Gro1 paralogue sequences available in GenBank. Region length (bp) Spliced RNA length Unspliced RNA length Accession N° (Gene) 5' UTR TIR I intron NBSII intronLRRIII intronIV exon3' UTR AY 196151 (Gro 1-4) 93 496 5465 109576 1337115 479 104 3604 9260 AY 196152 (Gro 1-5) 96 496 875 109576 1340142 431 272 3730 4823 AY 196153 (Gro 1-2) 107 496 12092 109576 1337142 479 272 3786 16096 AY 196154 (Gro 1-3) 78 512 946 109476 1337144 514 n.d. n.d. n.d. AY 196155 (Gro 1-6) 93 496 403 109476 1330158 491 n.d. n.d. n.d. AY 196156 (Gro 1-8) n.d. n.d. n.d. 109576 1337142 479 278 n.d. n.d. AY 196157 (Gro 1-11) 102 496 5199 109376 1284142 479 272 3726 9143 AY 196158 (Gro 1-14) n.d. n.d. n.d. 797 76 226682 509 n.d. n.d. n.d. n.d.: the length of the region could not be es timated as no alignment was found with the corresponding region ends of Gro1-4. Table 5. Primers used for each paralogue-specific SCAR marker. Melting temperature (Tm) used in PCR experiments is reported in column 4 as well as expected fragment size in column 5. Paralogue Primer Code Primer Sequence 5’-3’ Tm (℃) Product length (bp) g1-2promF atatagtgttagtgtgcttgg Gro 1-2 g1-2promR cttatctcgcggtctaagtc 56,0 299 g1-3IIIiF cccgcatgaaaatataaatg Gro 1-3 g1-3IIIiR ttgagattgtaaccgatatc 51,2 544 4RNA2f* tctttggagatactgattctca Gro 1-4 4RNA2r* cgacctaaaatgaaaagcatct 54,7 602 G1-5IiF ctctatttttatttctgcgatgaac Gro 1-5 G1-5IiR ggtatactccttttttcatctttac 56,4 127 g1-6IVF aatgtcgaatgatcccttca Gro 1-6 g1-6IVR gagcaggcaataacttccaa 54,2 202 g1-8TIRF catgattacgaaatggactc Gro 1-8 g1-8TIRR tttgatccagatgattgtcg 53,2 315 g1-11p40promF atgtaattccacaagtgagg Gro 1-11 g1-11p40promR tttgcattagagcttcgtag 53,2 264 g1-14nbsF aataggcgtcagctcagtgc Gro 1-14 g1-14nbsR tatgctcggccttaattgga 57,4 190 Analysis was run on 15 Solanum wild species, on the cultivar ‘Spunta’ and the clone P40. All primer pairs were built to amplify only a fragment for the target paralogue and had no other amplification products in the positive control genotype P40. In some cases, faint amplified frag- ments of different size were attained, albeit not scored, be- cause following sequencing, they did not exhibit sequence homolog y to any Gro1 paralogue. In other cases, clear am- plified fragments of different size were attained and se- quenced. They corresponded to Gro1 genes but exhibited INDEL mutations when compared to the target paralogue; consequently, a similarity value closer to other paralogues rather than to target one was obtained by BLAST analysis. Indeed, these mutations did not allow the specific paralogue of the cluster to be clearly identified (data not shown). Hence, these fragments were not scored either. 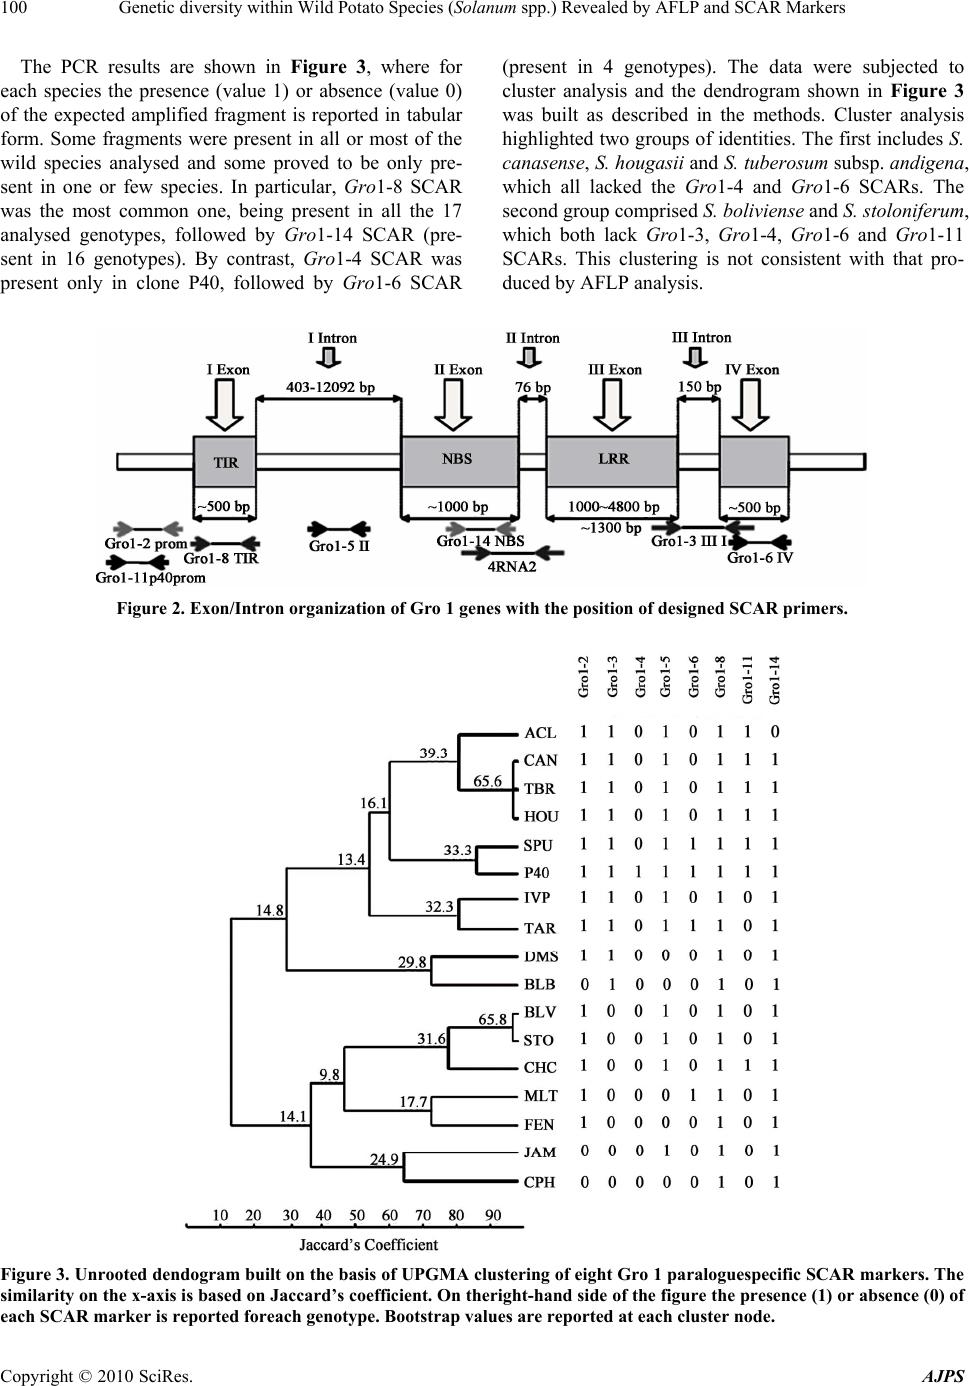 Genetic diversity within Wild Potato Species (Solanum spp.) Revealed by AFLP and SCAR Markers Copyright © 2010 SciRes. AJPS 100 The PCR results are shown in Figure 3, where for each species the presence (value 1) or absence (value 0) of the expected amplified fragment is reported in tabular form. Some fragments were present in all or most of the wild species analysed and some proved to be only pre- sent in one or few species. In particular, Gro1-8 SCAR was the most common one, being present in all the 17 analysed genotypes, followed by Gro1-14 SCAR (pre- sent in 16 genotypes). By contrast, Gro1-4 SCAR was present only in clone P40, followed by Gro1-6 SCAR (present in 4 genotypes). The data were subjected to cluster analysis and the dendrogram shown in Figure 3 was built as described in the methods. Cluster analysis highlighted two groups of identities. The first includes S. canasense, S. hougasii and S. tuberosum subsp. andigena, which all lacked the Gro1-4 and Gro1-6 SCARs. The second group comprised S. boliviense and S. st ol o nif e rum , which both lack Gro1-3, Gro1-4, Gro1-6 and Gro1-11 SCARs. This clustering is not consistent with that pro- duced by AFLP analysis. Figure 2. Exon/Intron organization of Gro 1 genes with the position of designed SCAR primers. Figure 3. Unrooted dendogram built on the basis of UPGMA clustering of eight Gro 1 paraloguespecific SCAR markers. The similarity on the x-axis is based on Jaccard’s coefficient. On theright-hand side of the figure the presence (1) or absence (0) of each SCAR marker is reported foreach genotype. Bootstrap values are reported at each cluster node.  Genetic diversity within Wild Potato Species (Solanum spp.) Revealed by AFLP and SCAR Markers Copyright © 2010 SciRes. AJPS 101 4. Discussion Characterization of variability among plant germplasm is a fundamental preliminary activity for plant breeding. While phenotypic variability has been characterized for centuries, the present-day challenge is to ascertain the relationship between genotypic and phenotypic variabil- ity in order to improve plant breeding programmes. With regard to phenotypic aspects, in the current study we observed resistance variability to Globodera rostochien- sis pathotype Ro2 among 15 wild Solanum species. In- terestingly, some Solanum species suppressed nematode reproduction, partially confirming the data of Hanneman and Bamberg [26]. In five of the 15 species tested, pathotype Ro2 had a reproduction rate < 1. The species S. tuberosum subsp. andigena is the most interesting be- cause it suppressed nematode reproduction rates of pathotype Ro2 (0.6) and there were only 80 eggs per cyst of pathotype Ro2 compared to 153 in the control cv. Spunta. This wild species also exhibited a very low re- productio rate (0.3) in comparison with Spunta (10.3), when tested against pathotype Ro1 (data not shown). Therefore, this clone is promising for breeding pro- grammes for resistance to pathotype Ro2 of G. rosto- chiensis. However, assessments of its response to other pathotypes of this cyst nematode and of G. pallida should also be made. Also, the species S. bulbocastanum, S. jamesii and S. stoloniferum should be further investi- gated, since they showed both a low reproduction rate and a reduced number of eggs per cyst with respect to the control cv. Spunta. Plant material in this work is also particularly suitable for an allelic characterization study and consequent phylogenetic elaborations since it con- sists of a pool of wild species of various geographical origins. All the material belongs to the Solanum genus, but different subgenera are represented and different polymorphism levels are detectable according to the various subgroup of material considered. AFLP cluster analysis confirmed that the species con- sidered are uniformly distributed on the genus tree as they showed almost uniform similarity coefficients, most of them lying between 30% and 50%. Eight of the 15 wild species had been previously characterized in more than one accession by AFLP analysis [27]. Although neither the clones analyzed in our work (different acces- sion numbers) nor the restriction enzymes used were the same, the main structure of the cladogram found by Spooner et al. [ 2 7 ] wa s o v e r a ll confirmed. Besides genome-wide characterization of these species, locus-specific analysis of one resistance gene was also undertaken. In fact, the first step to improve the genetic background of potato cultivars through interspecific hy- bridization is to identify and characterize sources of re- sistance. In most cases, resistance depends on pathogen recognition by plant resistance factors and the specificity of the recognition is given from the interaction between R genes and Avr genes. These are usually involved in hypersensitivity response (HR) [28]. Due to their func- tion, resistance genes typically undergo swift changes and continuously evolve, usually much faster than other gene classes. Their rapid evolution is mainly due to en- vironmental factors: pathogens rapidly overcome ac- quired plant resistance, such that the plant evolutionary process accelerates to combat pathogen infection strate- gies [29]. The way in which resistance genes evolve and change has long been studied: it is widely stated that re- sistance genes are grouped into gene clusters containing several paralogue genes [30], as is the case of I2 [31], Mi-1 [32], I3 [33], Gro1 [15]. One of the most frequent gene cluster configuratio ns is that of the gene Xa21 [34], where a functional gene is organized as a cluster with non-functional paralogues and truncated sequences. The Gro1 cluster could be similar, with the Gro1-4 functional gene linked to non-functional paralogues and gene frag- ments. This is consistent with the hypothesis that clusters could represent resistance gene storage and that frequent gene exchanges in the cluster lead to a new resistance strategy [35]. In order to characterize the 15 Solanum species at the Gro-1 locus, in the present study specific primers for each of the paralogues were constructed exploring the variability of different functional domains (TIR, NSB, LLR) and introns of the resistant allele Gro1-4, whose sequences are available in GenBank. Bioinformatic analysis of the P40 Gro1 gene cluster by means of CLUSTAL-W alignment showed a very conserved re- gion spanning NBS and LRR domains of the paralogues, but other regions of similarity could not be identified due to large insertions and repeated regions. In any case, the primers designed on the basis of these bioinformatic re- sults allowed the presence/absence of each paralogue to be verified in each species analysed. As for the resistance gene Gro1-4, no genotype produced fragments like P40 specifically designed to amplify Gro1-4, not even those that exhibited resistance. This resistance, in fact, is probably due to genes other than Gro 1-4, as already re- ported in the literature [12,10]. Sequencing of the whole cluster Gro1 has been started in our laboratory in order to highlight the role of this clu ster in n ematode resistance of Solanum tuberosum subs p. andigena species. The cluster analysis of SCAR results underlined the high similarity between S. canasense, S. hougasii and S. tuberosum subsp. andigena and between S. boliviense and S. stoloniferum. As for the first group, the species S. canasense showed a good level of resistance to pathotyp e Ro2, as well as S. tuberosum subsp. andigena. These two  Genetic diversity within Wild Potato Species (Solanum spp.) Revealed by AFLP and SCAR Markers Copyright © 2010 SciRes. AJPS 102 species also shared the SCAR pattern of Gro 1 paralogues. Therefore, a sequence analysis of Gro 1 locus also for S. canasense is also desirable, since it could lead to the definition of which paralogue could be the putative re- sistance gene to pathotype Ro2. Inconsistency between the two unrooted dendrograms was expected since evolu- tion of R genes is strongly driven by environment so that very different genomes can have very similar resistance traits and vice-versa [30]. In conclusion, molecular differences within 15 wild potato species were explored by generating AFLP fin- gerprints and SCAR profiles. Our study reveals a new set of markers that distinguish eight paralogues of the Gro 1 locus, potentially suitab le for mapping, MAS and clon ing purposes. These could represent a useful tool for genetic and breeding studies, if an association of these markers with the resistance trait can be confirmed [4]. For this purpose, the sequencing of the whole Gro 1 locus in the resistant species is necessary, as well as confirming of this resistance also in different environments. 5. Acknowledgements The authors wish to thank Mark Walters for editing the manuscript. This research was carried out in the frame- work of the project “Risorse Genetiche di Organismi Utili per il Miglioramento di Specie di Interesse Agrario e per un’Agricoltura Sostenibile” funded by the Italian Ministry of Agricultural and Forestry Policy. REFERENCES [1] J. G. Hawkes and J. P. Hierting, “The Potatoes of Bo- livia—Their Breeding Value and Evolutionary Relation- ships,” Clarendon Press, Oxford, 1989. [2] D. Carputo and A. Barone, “Ploidy Level Manipulations in Potato through Sexual Hybridization,” Annual of Ap- plied Biol ogy, Vol. 146, No. 1, February 2005, pp. 71-79. [3] R. Aversano, M. R. Ercolano, L. Frusciante, L. Monti, J. M. Bradeen, G. Cristinzio, A. Zoina, N. Greco, S. Vitale and D. Carputo, “Resistance Traits and AFLP Charac- terization of Diploid Primitive Tuber-Bearing Potatoes,” Genetic Resources and Crop Evolution, Vol. 54, No. 8, December 2007, pp. 1797-1806. [4] A. Barone, “Molecular Marker-Assisted Selection for Potato Breeding,” American Journal of Potato Research, Vol. 81, No. 2, March 2004, pp.111-117. [5] C. Gebhardt, D. Bellin, H. Henselewski, W. Lehmann, J. Schwarzfischer and J. P. T. Valkonen, “Marker-Assisted Combination of Major Genes for Pathogen Resistance in Potato,” Theoretical and Applied Genetics, Vol. 112, No. 8, February 2006, pp. 458-1464. [6] S. I. Lara-Cabrera, D.M. Spooner, “Taxonomy of North and Central American Diploid Wild Potato (Solanum Sect. Petota) Species: AFLP Data,” Plant Systematics and Evolution, Vol. 248, No. 1-4, September 2004, pp. 129- 142. [7] R. G. van den Berg and N. Groendijk-Wilders, “AFLP Data Support the Recognition of a New Tuber-Bearing Solanum Species but are Uninformative about Its Taxo- nomic Relationships,” Plant Systematics and Evolution, Vol. 269, No. 3-4, December 2007, pp. 133-143. [8] A. Carrasco, J.E. Chauvin, B. Trognitz, A. PAwlak, O. Rubio-Covarruvias and E. Zimnoch-Guzowska, “Marker- Assisted Breeding for Disease Resistance in Potato,” Po- tato Research, Vol. 52, No. 3, August 2009, pp. 245-248. [9] R. J. Marks and B. B Brodie, “Introduction: Potato Cyst Nematodes—An International Pest Complex,” In: R. J. Marks and B. B. Brodie, Eds., Potato Cyst Nematodes— Biology, Distribution and Control, CAB International, Wallingford, UK, 1998, pp. 1-4. [10] M. F. B. Dale and M. M. de Scurrah, “Breeding for Re- sistance to the Potato Cyst Nematodes Globodera Rosto- chiensis and Globodera Pallida,” In: R. J. Marks and B. B. Brodie, Eds., Potato Cyst Nematodes— Biology, Distri- bution and Control, CAB International, Wallingford, UK, 1998, pp. 167-195. [11] H. Ross, “Potato Breeding: Problems and Perspectives,” In: W. Horn and G. Robbelen, Eds., Journal Plant Breeding Supplement, Vol. 13, 1986, pp.82-86. [12] C. Gebhardt, D. Mugniery, E. Ritter, F. Salamini and E. Bonnel, “Identification of RFLP Markers Closely Linked to the H1 Gene Conferring Resistance to Globodera ros- tochiensis in Potato,” Theoretical and Applied Genetics, Vol. 85, No. 5, January 1993, pp. 541-544. [13] J. Rouppe van der Voort, W. Lindeman, R. Folkertsma, R. Hutten, H. Overmars, E. van der Vossen, E. Jacobsen and J. Bakker, “A QTL for Broad-Spectrum Resistance to Cyst Nematode Species (Globodera spp.) Maps to a Re- sistance Gene Cluster in Potato,” Theoretical and Applied Genetics, Vol. 96, No. 5, April 1998, pp. 654-661. [14] A. Barone, E. Ritter, U. Schachtschabel, T. Debener, F. Salamini, C. Gebhardt, “Localization by restriction frag- ment length polymorphism mapping in potato of a major dominant gene conferring resistance to the potato cyst nematode Globodera rostochiensis,” Molecular General Genetics, vol. 224, November 1990, pp.177-182. [15] J. Paal, H. Henselewski, J. Muth, K. Mekesem, C.M. Menendez, F. Salamini, A. Ballvora and C. Gebhardt, “Molecular Cloning of the Potato Gro1-4 Gene Confer- ring Resistance to Pathotype Ro1 of the Root Cyst Nematode Globodera rostochiensis, Based on a Candi- date Gene Approach,” Plant Journal, Vol. 38, No. 2, April 2004, pp. 285-297. [16] P. Vos, G. Simons, T. Jesse, J. Wijbrandi, L. Heinen, R. Hogers, A. Frijters, J. Groenendijkk, P. Diergaarde, M. Reijans, J. Fierens-Onstenk, M. De Both, J. Peleman, T. Liharska, J. Hontelez and M. Zabeau, “The Tomato Mi-1 Gene Confers Resistance to both Root-Knot Nematodes and Potato Aphids,” Nature Biotechnology, Vol. 16, No. 13, December 1998, pp. 1365-1369. [17] T. Murashige and F. Skoog, “A Revised Medium for Rapid Growth and Bioassays with Tobacco Tissue Cul-  Genetic diversity within Wild Potato Species (Solanum spp.) Revealed by AFLP and SCAR Markers Copyright © 2010 SciRes. AJPS 103 tures,” Physiologia Plantarum, Vol. 15, No. 3, April 1962, pp. 251-258. [18] J. W. Seinhorst, “Separation of Heterodera Cysts from Organic Debris Using Ethanol,” Nematologica, Vol. 20, April 1974, 367-369. [19] J. W. Seinhorst and H. den Ouden, “An Improvement of Bijloo’s Method for Determining the Egg Content of Het- erodera Cysts,” Nematologica, Vol. 12, January 1966, pp. 170-171. [20] D. B. Duncan, “Multiple Range and Multiple F Tests,” Biometrics, Vol. 11, No. 1, 1955, pp. 1-42. [21] P. Vos, R. Hogers, M. Bleeker, M. Reijans, T. van der Lee, M. Hornes, A. Frijters, J. Pot, J. Peleman, M. Kuiper and M. Zabeau, “AFLP: A New Technique for DNA Fin- gerprinting,” Nucleic Acids Research, Vol. 23, No. 21, November 1995, pp. 4407-4414. [22] J. D. Thompson, D. G. Higgins and T. J. Gibson, “CLUSTAL W: Improving the Sensitivity of Progressive Multiple Sequence Alignment through Sequence Weight- ing, Position Specific Gap Penalties and Weight Matrix Choice,” Nucleic Acids Research, Vol. 22, No. 22, No- vember 1994, pp. 4673-4680. [23] S. F. Altschul, T. L. Madden, A. A. Schaffer, J. Zhang, Z. Zhang, W. Miller and D. J. Lipman, “Gapped BLAST and PSI-BLAST: A New Generation of Protein Database Search Programs,” Nucleic Acids Research, Vol. 25, No. 17, September 1997, pp. 3389-3402. [24] F. J. Rolf, “NTSY Spc. Numerical Taxonomy and Multi- variate Analysis System” Vol 2.0, Exeter Software, Se- tauket, New York, USA, 1989. [25] I. V. Yap and R. J. Nelson, “WINBOOT, a Program for Performing Bootstrap Analysis of Binary Data to Deter- mine the Confidence Limits of UPGMA Based Dendro- grams,” IRRI Discussion Paper Ser. No. 14, International Rice Research Institute, Los Baños, 1996. [26] R. E. Jr. Hanneman and J. B. Bamberg, “Inventory of Tuber-Bearing Solanum Species,” Bulletin 533 of Re- search Division of the College of Agriculture and Life Sciences, University of Wisconsin, Madison USA, 1986. [27] D. M. Spooner, K. McLean, G. Ramsay, R. Waugh and G. J. Bryan, “A Single Domestication for Potato Based on Multilocus Amplified Fragment Length Polymorphism Genotyping,” Proceeding of the National Academy of Sciences of United States of America, Vol. 102, No. 41, October 2005, pp. 14694-14699. [28] A. F. Bent and D. Mackey, “Elicitors, Effectors, and R Genes: The New Paradigm and a Lifetime Supply of Questions,” Annual Review of Phytopathololy, Vol. 45, September 2007, pp. 399-436. [29] G. B. Martin, A.J. Bogdanove and G. Sessa, “Under- standing the Functions of Plant Disease Resistance Pro- teins,” Annual Review of Plant Biology, Vol. 54, June 2003, pp. 23-61. [30] R. Fluhr, “Sentinels of Disease—Plant Resistance Genes,” Plant Physiology, Vol. 127, No. 4, December 2001, pp. 1367-1374. [31] G. Simons, “Dissection of the Fusarium I2 Gene Cluster in Tomato Reveals Six Homologs and One Active Gene Copy,” Plant Cell, Vol. 10, No. 6, June 1998, pp. 1055- 1068. [32] S. Seah, J. Yaghoobi, M. Rossi, C. A. Gleason and V. M. Williamson, “The Nematode-Resistance Gene, Mi-1, is Associated with an Inverted Chromosomal Segment in Susceptible Compared to Resistant Tomato,” Theoretical and Applied Genetics, Vol. 108, No. 8, May 2004, pp. 1635- 1642. [33] M. N. Hemming, S. Basuki, D. J. McGrath, B. J. Carroll and D.A. Jones, “Fine Mapping of the Tomato I-3 gene for Fusarium wilt Resistance and Elimination of a Co-segregating Resistance Gene Analogue as a Candidate for I-3,” Theoretical and Applied Genetics, Vol. 109, No. 2, July 2004, pp. 409-418. [34] W. A. Song, L. A. Pi, G. L. Wang, J. Gardner, T. Hoisten and P. C. Ronald, “Evolution of the Rice Xa21 Disease Resistance Gene Family,” Plant Cell, Vol. 9, No. 8, Au- gust 1997, pp. 1279-1287. [35] R. W. Michelmore and B.C. Meyers, “Clusters of REsis- tance Genes in Plants Evolve by Divergent Selection and Birth-and-Death Process,” Genome Research, Vol. 8, No. 11, November 1998, pp. 1113-1130. |