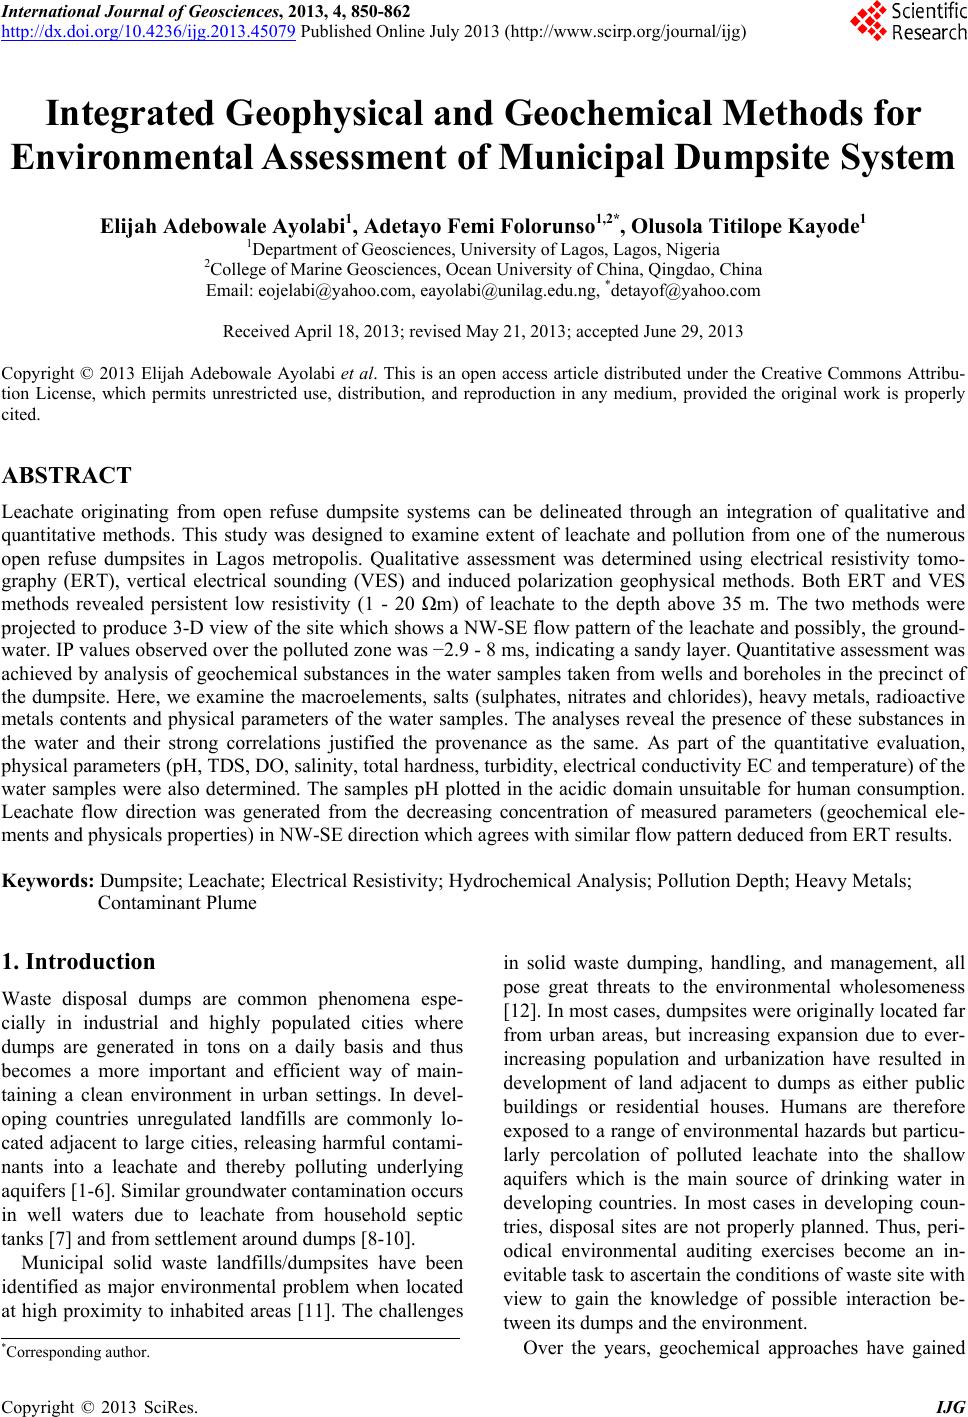
 International Journal of Geosciences, 2013, 4, 850-862 http://dx.doi.org/10.4236/ijg.2013.45079 Published Online July 2013 (http://www.scirp.org/journal/ijg) Integrated Geophysical and Geochemica l M ethods for Environmental Assessment of Municipal Dumpsite System Elijah Adebowale Ayolabi1, Adetayo Femi Folorunso1,2*, Olusola Titilope Kayode1 1Department of Geosciences, University of Lagos, Lagos, Nigeria 2College of Marine Geosciences, Ocean University of China, Qingdao, China Email: eojelabi@yahoo.com, eayolabi@unilag.edu.ng, *detayof@yahoo.com Received April 18, 2013; revised May 21, 2013; accepted June 29, 2013 Copyright © 2013 Elijah Adebowale Ayolabi et al. This is an open access article distributed under the Creative Commons Attribu- tion License, which permits unrestricted use, distribution, and reproduction in any medium, provided the original work is properly cited. ABSTRACT Leachate originating from open refuse dumpsite systems can be delineated through an integration of qualitative and quantitative methods. This study was designed to examine extent of leachate and pollution from one of the numerous open refuse dumpsites in Lagos metropolis. Qualitative assessment was determined using electrical resistivity tomo- graphy (ERT), vertical electrical sounding (VES) and induced polarization geophysical methods. Both ERT and VES methods revealed persistent low resistivity (1 - 20 Ωm) of leachate to the depth above 35 m. The two methods were projected to produce 3-D view of the site which shows a NW-SE flow pattern of the leachate and possibly, the ground- water. IP values observed over the polluted zone was −2.9 - 8 ms, indicating a sandy layer. Quantitative assessment was achieved by analysis of geochemical substances in the water samples taken from wells and boreholes in the precinct of the dumpsite. Here, we examine the macroelements, salts (sulphates, nitrates and chlorides), heavy metals, radioactive metals contents and physical parameters of the water samples. The analyses reveal the presence of these substances in the water and their strong correlations justified the provenance as the same. As part of the quantitative evaluation, physical parameters (pH, TDS, DO, salinity, total hardness, turbidity, electrical conductivity EC and temperature) of the water samples were also determined. The samples pH plotted in the acidic domain unsuitable for human consumption. Leachate flow direction was generated from the decreasing concentration of measured parameters (geochemical ele- ments and physicals properties) in NW-SE direction which agrees with similar flow pattern deduced from ERT results. Keywords: Dumpsite; Leachate; Electrical Resistivity; Hydrochemical Analysis; Pollution Depth; Heavy Metals; Contaminant Plume 1. Introduction Waste disposal dumps are common phenomena espe- cially in industrial and highly populated cities where dumps are generated in tons on a daily basis and thus becomes a more important and efficient way of main- taining a clean environment in urban settings. In devel- oping countries unregulated landfills are commonly lo- cated adjacent to large cities, releasing harmful contami- nants into a leachate and thereby polluting underlying aquifers [1-6]. Similar groundwater contamination occurs in well waters due to leachate from household septic tanks [7] and from settlement around dumps [8-10]. Municipal solid waste landfills/dumpsites have been identified as major environmental problem when located at high proximity to inhabited areas [11]. The challenges in solid waste dumping, handling, and management, all pose great threats to the environmental wholesomeness [12]. In most cases, dumpsites were originally located far from urban areas, but increasing expansion due to ever- increasing population and urbanization have resulted in development of land adjacent to dumps as either public buildings or residential houses. Humans are therefore exposed to a range of environmental hazards but particu- larly percolation of polluted leachate into the shallow aquifers which is the main source of drinking water in developing countries. In most cases in developing coun- tries, disposal sites are not properly planned. Thus, peri- odical environmental auditing exercises become an in- evitable task to ascertain the conditions of waste site with view to gain the knowledge of possible interaction be- tween its dumps and the environment. Over the years, geochemical approaches have gained *Corresponding author. C opyright © 2013 SciRes. IJG 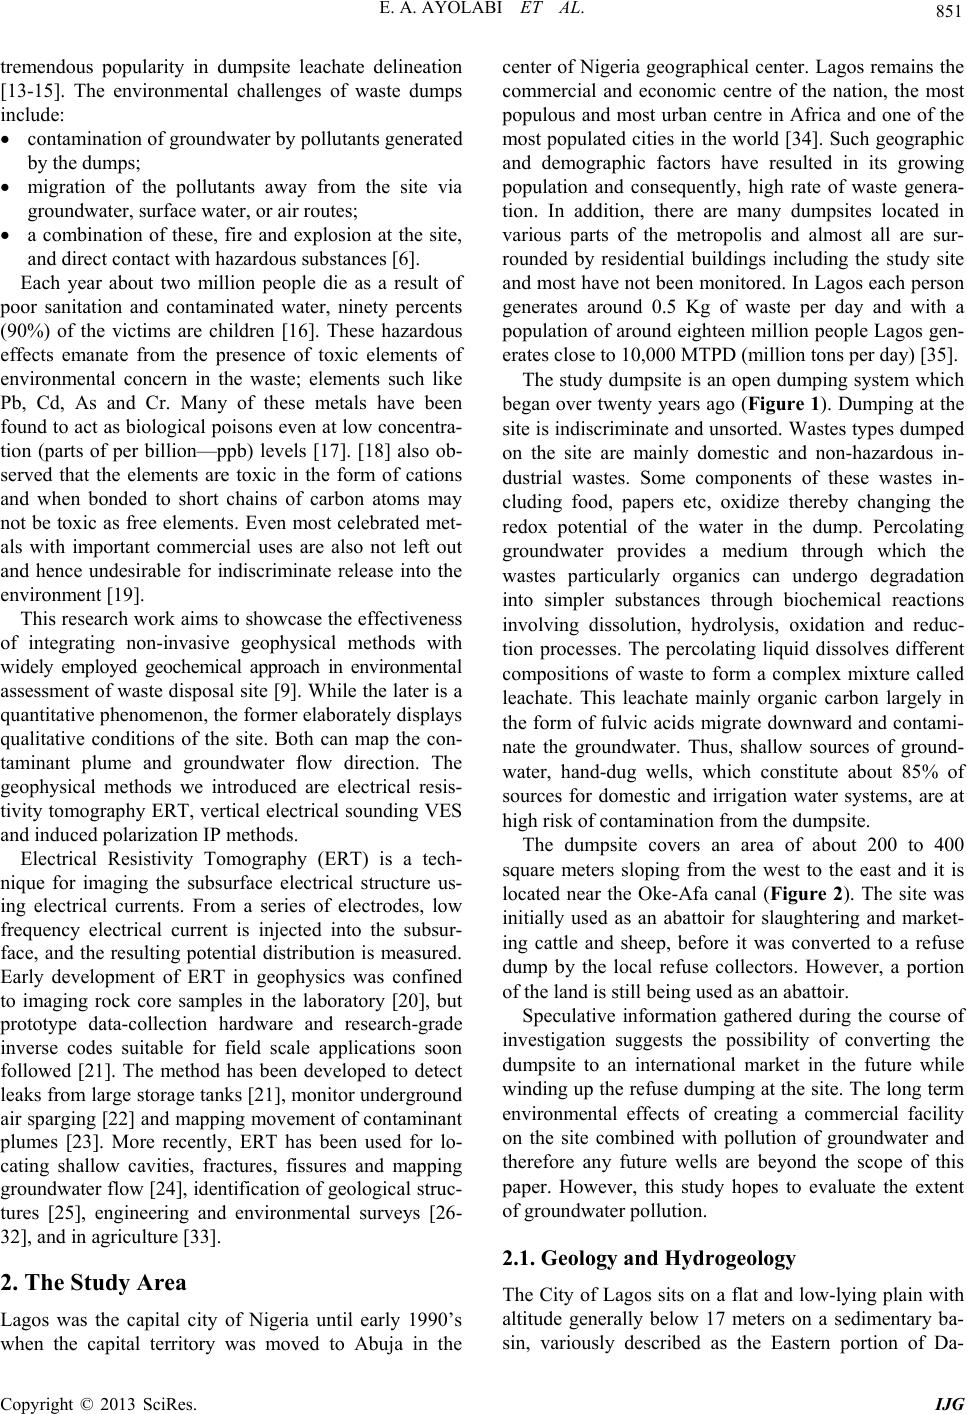 E. A. AYOLABI ET AL. 851 tremendous popularity in dumpsite leachate delineation [13-15]. The environmental challenges of waste dumps include: contamination of groundwater by pollutants generated by the dumps; migration of the pollutants away from the site via groundwater, surface water, or air routes; a combination of these, fire and explosion at the site, and direct contact with hazardous substances [6]. Each year about two million people die as a result of poor sanitation and contaminated water, ninety percents (90%) of the victims are children [16]. These hazardous effects emanate from the presence of toxic elements of environmental concern in the waste; elements such like Pb, Cd, As and Cr. Many of these metals have been found to act as biological poisons even at low concentra- tion (parts of per billion—ppb) levels [17]. [18] also ob- served that the elements are toxic in the form of cations and when bonded to short chains of carbon atoms may not be toxic as free elements. Even most celebrated met- als with important commercial uses are also not left out and hence undesirable for indiscriminate release into the environment [19]. This research work aims to showcase the effectiveness of integrating non-invasive geophysical methods with widely employed geochemical approach in environmental assessment of waste disposal site [9]. While the later is a quantitative phenomenon, the former elaborately displays qualitative conditions of the site. Both can map the con- taminant plume and groundwater flow direction. The geophysical methods we introduced are electrical resis- tivity tomography ERT, vertical electrical sounding VES and induced polarization IP methods. Electrical Resistivity Tomography (ERT) is a tech- nique for imaging the subsurface electrical structure us- ing electrical currents. From a series of electrodes, low frequency electrical current is injected into the subsur- face, and the resulting potential distribution is measured. Early development of ERT in geophysics was confined to imaging rock core samples in the laboratory [20], but prototype data-collection hardware and research-grade inverse codes suitable for field scale applications soon followed [21]. The method has been developed to detect leaks from large storage tanks [21], monitor underground air sparging [22] and mapping movement of contaminant plumes [23]. More recently, ERT has been used for lo- cating shallow cavities, fractures, fissures and mapping groundwater flow [24], identification of geological struc- tures [25], engineering and environmental surveys [26- 32], and in agriculture [33]. 2. The Study Area Lagos was the capital city of Nigeria until early 1990’s when the capital territory was moved to Abuja in the center of Nigeria geographical center. Lagos remains the commercial and economic centre of the nation, the most populous and most urban centre in Africa and one of the most populated cities in the world [34]. Such geographic and demographic factors have resulted in its growing population and consequently, high rate of waste genera- tion. In addition, there are many dumpsites located in various parts of the metropolis and almost all are sur- rounded by residential buildings including the study site and most have not been monitored. In Lagos each person generates around 0.5 Kg of waste per day and with a population of around eighteen million people Lagos gen- erates close to 10,000 MTPD (million tons per day) [35]. The study dumpsite is an open dumping system which began over twenty years ago (Figure 1). Dumping at the site is indiscriminate and unsorted. Wastes types dumped on the site are mainly domestic and non-hazardous in- dustrial wastes. Some components of these wastes in- cluding food, papers etc, oxidize thereby changing the redox potential of the water in the dump. Percolating groundwater provides a medium through which the wastes particularly organics can undergo degradation into simpler substances through biochemical reactions involving dissolution, hydrolysis, oxidation and reduc- tion processes. The percolating liquid dissolves different compositions of waste to form a complex mixture called leachate. This leachate mainly organic carbon largely in the form of fulvic acids migrate downward and contami- nate the groundwater. Thus, shallow sources of ground- water, hand-dug wells, which constitute about 85% of sources for domestic and irrigation water systems, are at high risk of contamination from the dumpsite. The dumpsite covers an area of about 200 to 400 square meters sloping from the west to the east and it is located near the Oke-Afa canal (Figure 2). The site was initially used as an abattoir for slaughtering and market- ing cattle and sheep, before it was converted to a refuse dump by the local refuse collectors. However, a portion of the land is still being used as an abattoir. Speculative information gathered during the course of investigation suggests the possibility of converting the dumpsite to an international market in the future while winding up the refuse dumping at the site. The long term environmental effects of creating a commercial facility on the site combined with pollution of groundwater and therefore any future wells are beyond the scope of this paper. However, this study hopes to evaluate the extent of groundwater pollution. 2.1. Geology and Hydrogeology The City of Lagos sits on a flat and low-lying plain with altitude generally below 17 meters on a sedimentary ba- in, variously described as the Eastern portion of Da- s Copyright © 2013 SciRes. IJG 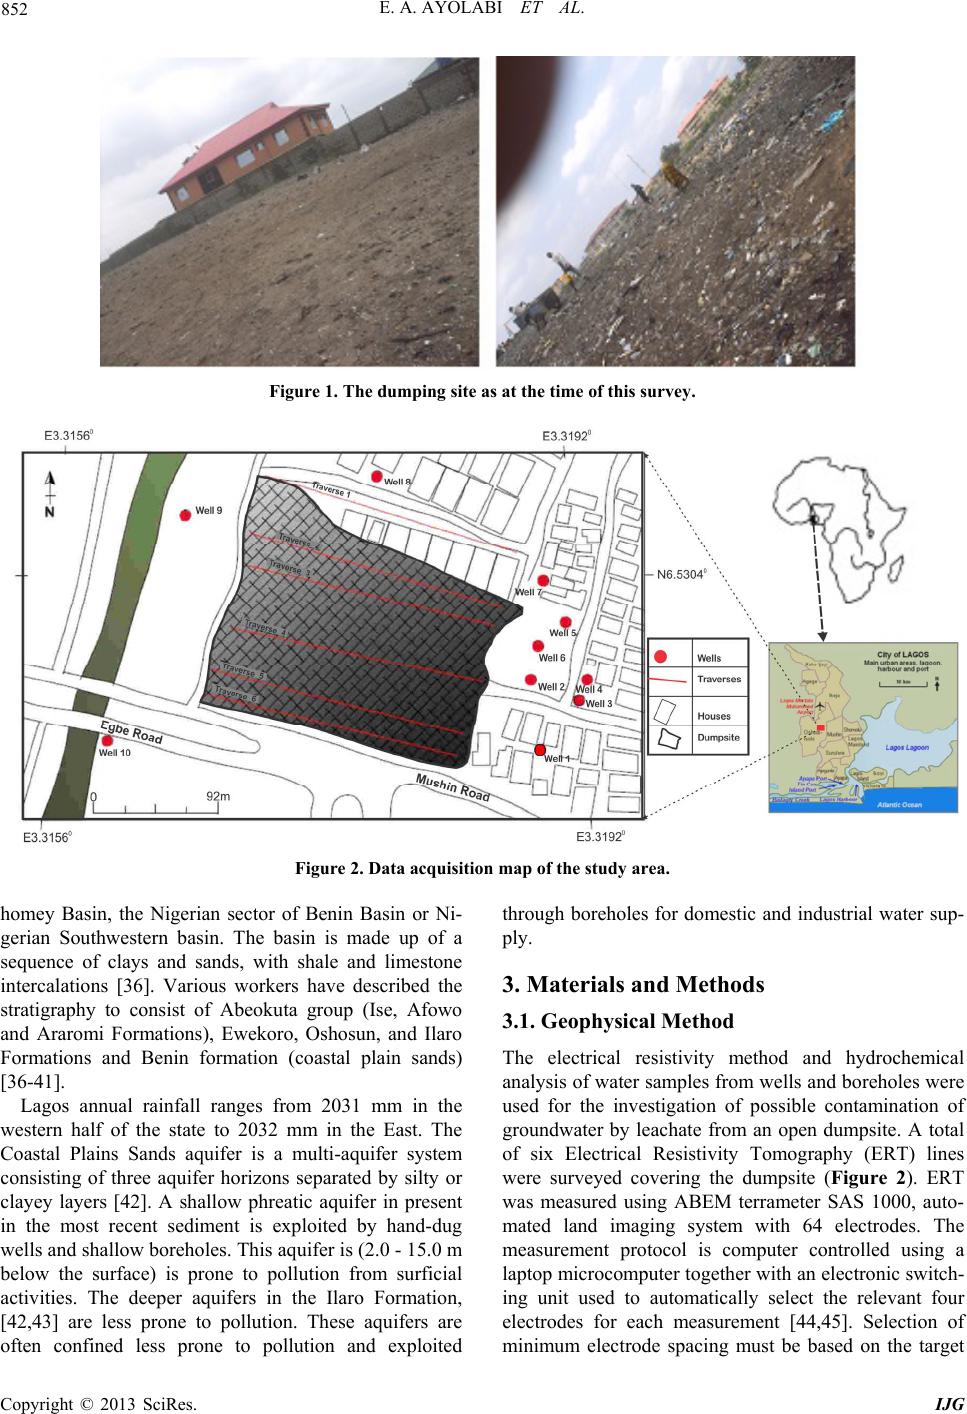 E. A. AYOLABI ET AL. Copyright © 2013 SciRes. IJG 852 Figure 1. The dumping site as at the time of this survey. Figure 2. Data acquisition map of the study area. homey Basin, the Nigerian sector of Benin Basin or Ni- gerian Southwestern basin. The basin is made up of a sequence of clays and sands, with shale and limestone intercalations [36]. Various workers have described the stratigraphy to consist of Abeokuta group (Ise, Afowo and Araromi Formations), Ewekoro, Oshosun, and Ilaro Formations and Benin formation (coastal plain sands) [36-41]. Lagos annual rainfall ranges from 2031 mm in the western half of the state to 2032 mm in the East. The Coastal Plains Sands aquifer is a multi-aquifer system consisting of three aquifer horizons separated by silty or clayey layers [42]. A shallow phreatic aquifer in present in the most recent sediment is exploited by hand-dug wells and shallow boreholes. This aquifer is (2.0 - 15.0 m below the surface) is prone to pollution from surficial activities. The deeper aquifers in the Ilaro Formation, [42,43] are less prone to pollution. These aquifers are often confined less prone to pollution and exploited through boreholes for domestic and industrial water sup- ply. 3. Materials and Methods 3.1. Geophysical Method The electrical resistivity method and hydrochemical analysis of water samples from wells and boreholes were used for the investigation of possible contamination of groundwater by leachate from an open dumpsite. A total of six Electrical Resistivity Tomography (ERT) lines were surveyed covering the dumpsite (Figure 2). ERT was measured using ABEM terrameter SAS 1000, auto- mated land imaging system with 64 electrodes. The measurement protocol is computer controlled using a laptop microcomputer together with an electronic switch- ing unit used to automatically select the relevant four electrodes for each measurement [44,45]. Selection of minimum electrode spacing must be based on the target 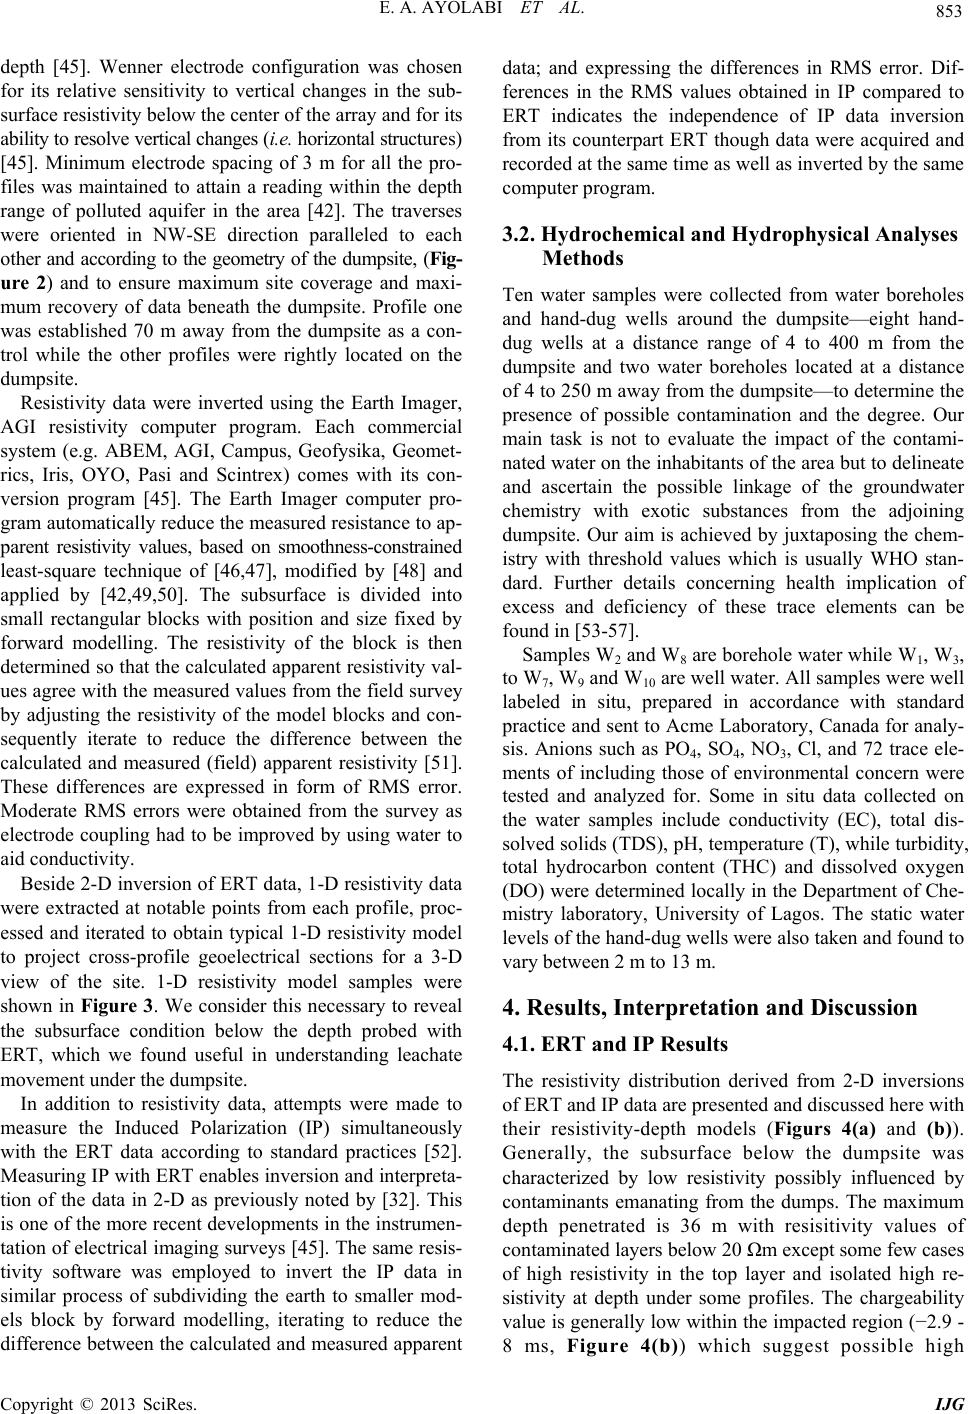 E. A. AYOLABI ET AL. 853 depth [45]. Wenner electrode configuration was chosen for its relative sensitivity to vertical changes in the sub- surface resistivity below the center of the array and for its ability to resolve vertical changes (i.e. horizontal structures) [45]. Minimum electrode spacing of 3 m for all the pro- files was maintained to attain a reading within the depth range of polluted aquifer in the area [42]. The traverses were oriented in NW-SE direction paralleled to each other and according to the geometry of the dumpsite, (Fig- ure 2) and to ensure maximum site coverage and maxi- mum recovery of data beneath the dumpsite. Profile one was established 70 m away from the dumpsite as a con- trol while the other profiles were rightly located on the dumpsite. Resistivity data were inverted using the Earth Imager, AGI resistivity computer program. Each commercial system (e.g. ABEM, AGI, Campus, Geofysika, Geomet- rics, Iris, OYO, Pasi and Scintrex) comes with its con- version program [45]. The Earth Imager computer pro- gram automatically reduce the measured resistance to ap- parent resistivity values, based on smoothness-constrained least-square technique of [46,47], modified by [48] and applied by [42,49,50]. The subsurface is divided into small rectangular blocks with position and size fixed by forward modelling. The resistivity of the block is then determined so that the calculated apparent resistivity val- ues agree with the measured values from the field survey by adjusting the resistivity of the model blocks and con- sequently iterate to reduce the difference between the calculated and measured (field) apparent resistivity [51]. These differences are expressed in form of RMS error. Moderate RMS errors were obtained from the survey as electrode coupling had to be improved by using water to aid conductivity. Beside 2-D inversion of ERT data, 1-D resistivity data were extracted at notable points from each profile, proc- essed and iterated to obtain typical 1-D resistivity model to project cross-profile geoelectrical sections for a 3-D view of the site. 1-D resistivity model samples were shown in Figure 3. We consider this necessary to reveal the subsurface condition below the depth probed with ERT, which we found useful in understanding leachate movement under the dumpsite. In addition to resistivity data, attempts were made to measure the Induced Polarization (IP) simultaneously with the ERT data according to standard practices [52]. Measuring IP with ERT enables inversion and interpreta- tion of the data in 2-D as previously noted by [32]. This is one of the more recent developments in the instrumen- tation of electrical imaging surveys [45]. The same resis- tivity software was employed to invert the IP data in similar process of subdividing the earth to smaller mod- els block by forward modelling, iterating to reduce the difference between the calculated and measured apparent data; and expressing the differences in RMS error. Dif- ferences in the RMS values obtained in IP compared to ERT indicates the independence of IP data inversion from its counterpart ERT though data were acquired and recorded at the same time as well as inverted by the same computer program. 3.2. Hydrochemical and Hydrophysical Analyses Methods Ten water samples were collected from water boreholes and hand-dug wells around the dumpsite—eight hand- dug wells at a distance range of 4 to 400 m from the dumpsite and two water boreholes located at a distance of 4 to 250 m away from the dumpsite—to determine the presence of possible contamination and the degree. Our main task is not to evaluate the impact of the contami- nated water on the inhabitants of the area but to delineate and ascertain the possible linkage of the groundwater chemistry with exotic substances from the adjoining dumpsite. Our aim is achieved by juxtaposing the chem- istry with threshold values which is usually WHO stan- dard. Further details concerning health implication of excess and deficiency of these trace elements can be found in [53-57]. Samples W2 and W8 are borehole water while W1, W3, to W7, W9 and W10 are well water. All samples were well labeled in situ, prepared in accordance with standard practice and sent to Acme Laboratory, Canada for analy- sis. Anions such as PO4, SO4, NO3, Cl, and 72 trace ele- ments of including those of environmental concern were tested and analyzed for. Some in situ data collected on the water samples include conductivity (EC), total dis- solved solids (TDS), pH, temperature (T), while turbidity, total hydrocarbon content (THC) and dissolved oxygen (DO) were determined locally in the Department of Che- mistry laboratory, University of Lagos. The static water levels of the hand-dug wells were also taken and found to vary between 2 m to 13 m. 4. Results, Interpretation and Discussion 4.1. ERT and IP Results The resistivity distribution derived from 2-D inversions of ERT and IP data are presented and discussed here with their resistivity-depth models (Figurs 4(a) and (b)). Generally, the subsurface below the dumpsite was characterized by low resistivity possibly influenced by contaminants emanating from the dumps. The maximum depth penetrated is 36 m with resisitivity values of contaminated layers below 20 Ωm except some few cases of high resistivity in the top layer and isolated high re- sistivity at depth under some profiles. The chargeability value is generally low within the impacted region (−2.9 - 8 ms, Figure 4(b)) which suggest possible high Copyright © 2013 SciRes. IJG 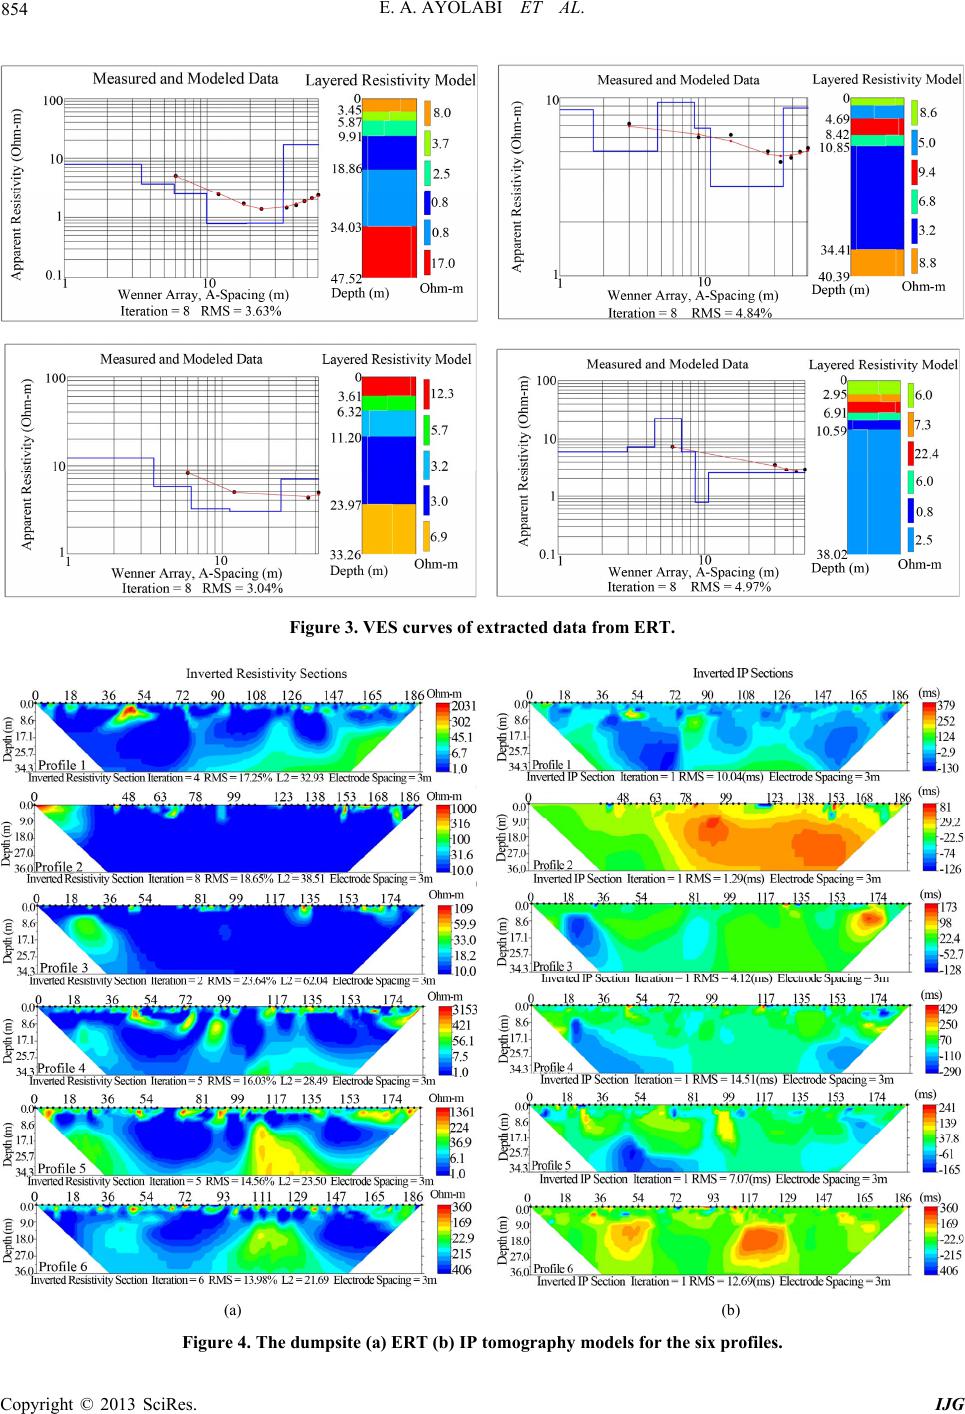 E. A. AYOLABI ET AL. Copyright © 2013 SciRes. IJG 854 Figure 3. VES curves of extracted data from ERT. (a) (b) Figure 4. The dumpsite (a) ERT (b) IP tomography models for the six profiles. 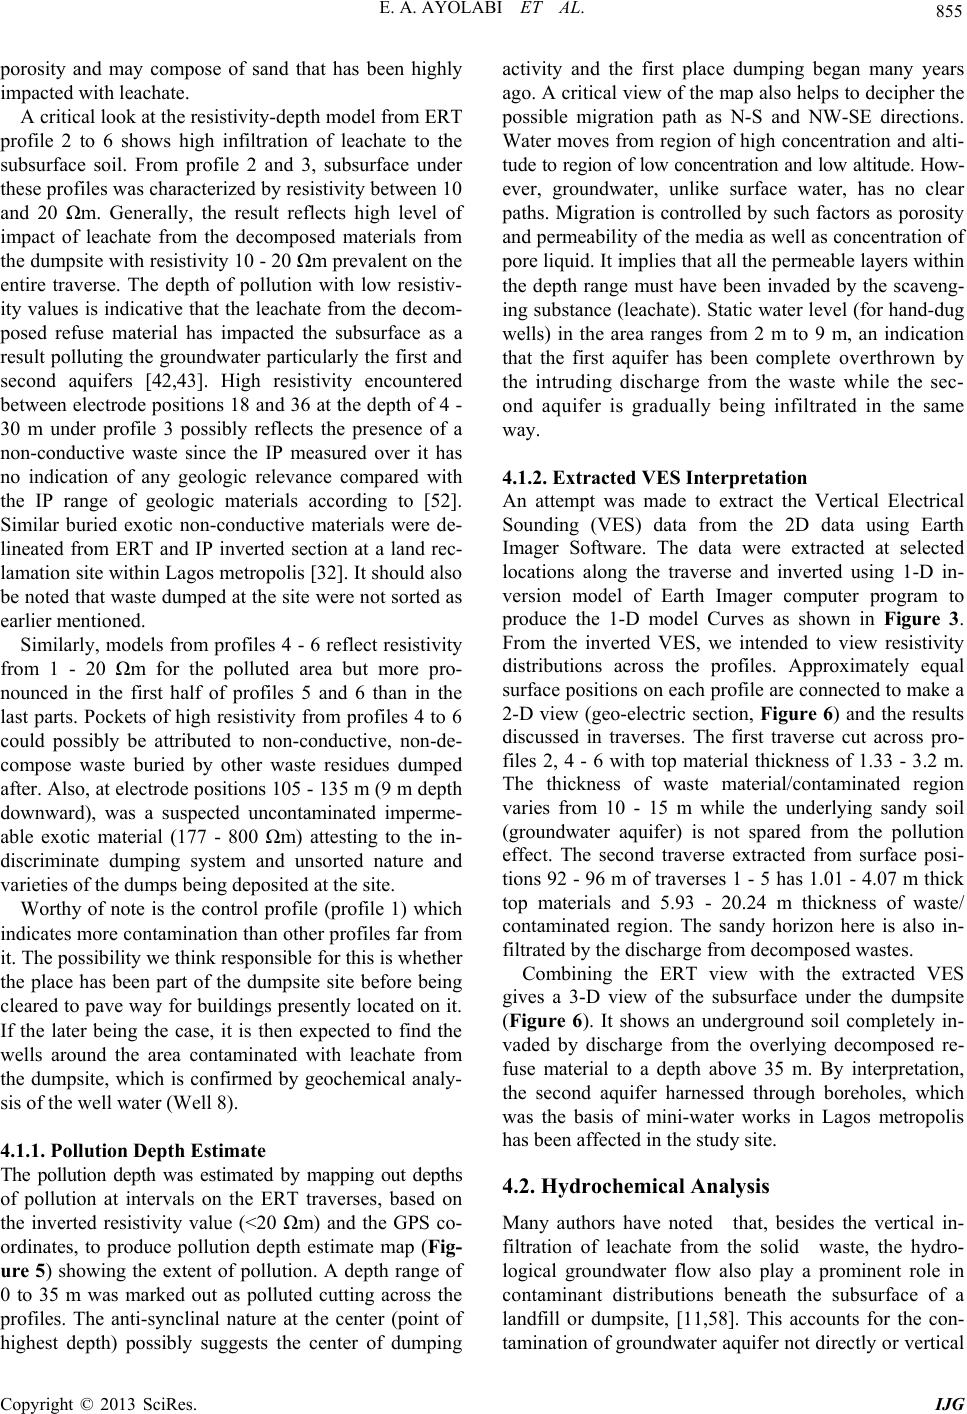 E. A. AYOLABI ET AL. 855 porosity and may compose of sand that has been highly impacted with leachate. A critical look at the resistivity-depth model from ERT profile 2 to 6 shows high infiltration of leachate to the subsurface soil. From profile 2 and 3, subsurface under these profiles was characterized by resistivity between 10 and 20 Ωm. Generally, the result reflects high level of impact of leachate from the decomposed materials from the dumpsite with resistivity 10 - 20 Ωm prevalent on the entire traverse. The depth of pollution with low resistiv- ity values is indicative that the leachate from the decom- posed refuse material has impacted the subsurface as a result polluting the groundwater particularly the first and second aquifers [42,43]. High resistivity encountered between electrode positions 18 and 36 at the depth of 4 - 30 m under profile 3 possibly reflects the presence of a non-conductive waste since the IP measured over it has no indication of any geologic relevance compared with the IP range of geologic materials according to [52]. Similar buried exotic non-conductive materials were de- lineated from ERT and IP inverted section at a land rec- lamation site within Lagos metropolis [32]. It should also be noted that waste dumped at the site were not sorted as earlier mentioned. Similarly, models from profiles 4 - 6 reflect resistivity from 1 - 20 Ωm for the polluted area but more pro- nounced in the first half of profiles 5 and 6 than in the last parts. Pockets of high resistivity from profiles 4 to 6 could possibly be attributed to non-conductive, non-de- compose waste buried by other waste residues dumped after. Also, at electrode positions 105 - 135 m (9 m depth downward), was a suspected uncontaminated imperme- able exotic material (177 - 800 Ωm) attesting to the in- discriminate dumping system and unsorted nature and varieties of the dumps being deposited at the site. Worthy of note is the control profile (profile 1) which indicates more contamination than other profiles far from it. The possibility we think responsible for this is whether the place has been part of the dumpsite site before being cleared to pave way for buildings presently located on it. If the later being the case, it is then expected to find the wells around the area contaminated with leachate from the dumpsite, which is confirmed by geochemical analy- sis of the well water (Well 8). 4.1.1. Pollution Depth Estimate The pollution depth was estimated by mapping out depths of pollution at intervals on the ERT traverses, based on the inverted resistivity value (<20 Ωm) and the GPS co- ordinates, to produce pollution depth estimate map (Fig- ure 5) showing the extent of pollution. A depth range of 0 to 35 m was marked out as polluted cutting across the profiles. The anti-synclinal nature at the center (point of highest depth) possibly suggests the center of dumping activity and the first place dumping began many years ago. A critical view of the map also helps to decipher the possible migration path as N-S and NW-SE directions. Water moves from region of high concentration and alti- tude to region of low concentration and low altitude. How- ever, groundwater, unlike surface water, has no clear paths. Migration is controlled by such factors as porosity and permeability of the media as well as concentration of pore liquid. It implies that all the permeable layers within the depth range must have been invaded by the scaveng- ing substance (leachate). Static water level (for hand-dug wells) in the area ranges from 2 m to 9 m, an indication that the first aquifer has been complete overthrown by the intruding discharge from the waste while the sec- ond aquifer is gradually being infiltrated in the same way. 4.1.2. Extracted VES Interpretation An attempt was made to extract the Vertical Electrical Sounding (VES) data from the 2D data using Earth Imager Software. The data were extracted at selected locations along the traverse and inverted using 1-D in- version model of Earth Imager computer program to produce the 1-D model Curves as shown in Figure 3. From the inverted VES, we intended to view resistivity distributions across the profiles. Approximately equal surface positions on each profile are connected to make a 2-D view (geo-electric section, Figure 6) and the results discussed in traverses. The first traverse cut across pro- files 2, 4 - 6 with top material thickness of 1.33 - 3.2 m. The thickness of waste material/contaminated region varies from 10 - 15 m while the underlying sandy soil (groundwater aquifer) is not spared from the pollution effect. The second traverse extracted from surface posi- tions 92 - 96 m of traverses 1 - 5 has 1.01 - 4.07 m thick top materials and 5.93 - 20.24 m thickness of waste/ contaminated region. The sandy horizon here is also in- filtrated by the discharge from decomposed wastes. Combining the ERT view with the extracted VES gives a 3-D view of the subsurface under the dumpsite (Figure 6). It shows an underground soil completely in- vaded by discharge from the overlying decomposed re- fuse material to a depth above 35 m. By interpretation, the second aquifer harnessed through boreholes, which was the basis of mini-water works in Lagos metropolis has been affected in the study site. 4.2. Hydrochemical Analysis Many authors have noted that, besides the vertical in- filtration of leachate from the solid waste, the hydro- logical groundwater flow also play a prominent role in contaminant distributions beneath the subsurface of a landfill or dumpsite, [11,58]. This accounts for the con- tamination of groundwater aquifer not directly or vertical Copyright © 2013 SciRes. IJG  E. A. AYOLABI ET AL. 856 Figure 5. Pollution depth estimate map from ERT traverses from the study area. Note the anti-synclinal center (point of highest depth) possibly pointing to the center of dumping activity and the first place dumping began many years ago. located on dumpsite or landfills across the globe. Table 1 provides the pH and major elemental compositions of water from wells and boreholes in the immediate sur- roundings of the site. Because of the persistent and in- discriminate burning coupled with heterogeneous nature of the waste, pH value in the acidic domain is expected since the residue after burning dissolves and percolates the subsurface making the water more acidic (pH of 5.15 - 6.35 are predominant). Only Na and K show high val- ues but not necessarily at toxic level. The elements are essential in humans, though may cause some health ef- fects in susceptible individuals while elevated concentra- tion may give rise to unacceptable taste [57]. The S con- tent is high. Table 2 represents the heavy metal contents (mg/l) of the ten water samples, showing relatively ele- vated values for Br. The anion contents, electrical conductivity, and other physical parameters measured on the water samples col- lected from wells and boreholes in the precinct on the dumpsite are provided in Table 3. 60% of the EC meas- ured are above the threshold value [59]. Most elevated EC values obtained attest to the presence of electrically charged ions as reflected in the resistivity surveying ear- lier explained (resistivity of 20 Ωm is predominant). Around 50% of the water samples collected showed TH (total hardness) values greater than 200 mg/l and about 30% showed DO (dissolved oxygen) above 5. In contrast, nitrates, sulphate and phosphate are extremely lower than the threshold values. [59] requirements for TDS in drinking water differs from WHO owing to variety in environmental, social, cultural, economic, dietary and other conditions affecting potential exposure as recog- nized by the world body [57]. 40% of the water showed elevated TDS values (by [59] standard), an indication of the presence of inorganic salts (principally calcium, mag- nesium, potassium, sodium, bicarbonates, chlorides and sulfates) [57]. In addition, we observed high correlations between EC and Cu, Ni, pH, Mg, PO4, SO4, TDS and TH and be- tween chloride and As, Mg, Co, Ni, K, Na, and salinity (Figure 7). These physical and geochemical parameters ere strongly correlated which also gives credence to w Copyright © 2013 SciRes. IJG 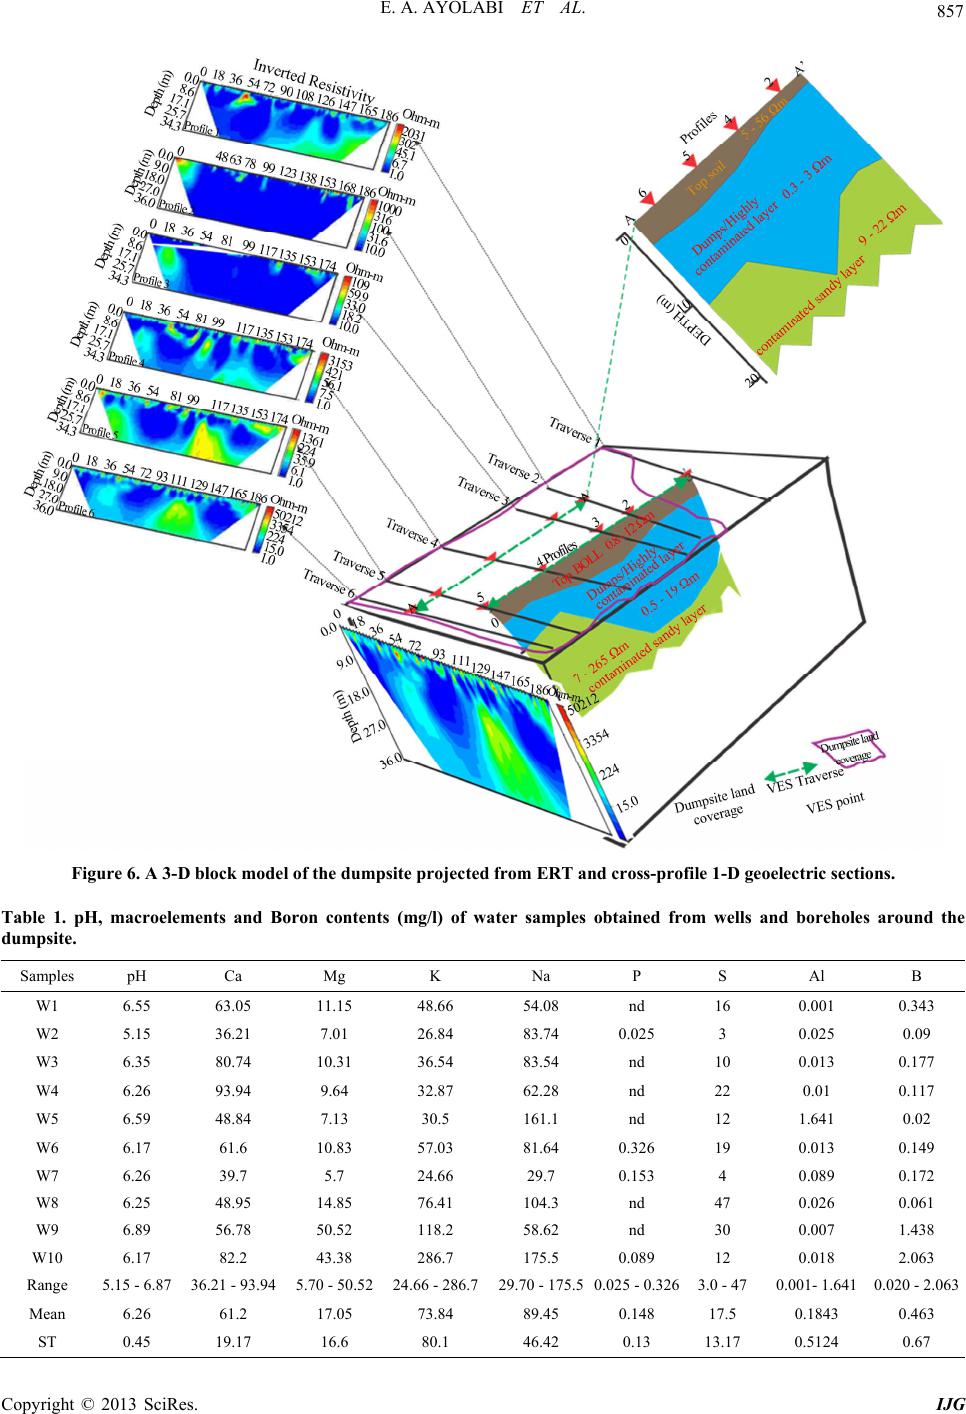 E. A. AYOLABI ET AL. 857 Figure 6. A 3-D block model of the dumpsite projected from ERT and cross-profile 1-D geoelectric sections. able 1.und the pH Ca Mg K Na P S Al B T pH, macroelements and Boron contents (mg/l) of water samples obtained from wells and boreholes aro dumpsite. Samples W1 6.55 6 4 5 0. 0. 3.0511.158.664.08nd 16 001343 W2 5.15 36.21 7.01 26.84 83.74 0. 0. 1 0. 5.136.2.94 5.724..729..50.0263.7 0.01 0.063 ST 0.45 19.17 16.6 80.1 46.42 0.13 13.17 0.5124 0.67 0253 0.025 0.09 W3 6.35 80.74 10.31 36.54 83.54 nd 10 0.013 0.177 W4 6.26 93.94 9.64 32.87 62.28 nd 22 0.01 0.117 W5 6.59 48.84 7.13 30.5 161.1 nd 12 1.641 0.02 W6 6.17 61.6 10.83 57.03 81.64 32619 0.013 0.149 W7 6.26 39.7 5.7 24.66 29.7 0.153 4 0.089 0.172 W8 6.25 48.95 4.85 76.41 104.3 nd 47 0.026 0.061 W9 6.89 56.78 50.52 118.2 58.62 nd 30 0.007 1.438 W10 6.17 82.2 43.38 286.7 175.5 08912 0.018 2.063 Range 5 - 6.87 1 - 930 - 50.52 66 - 28670 - 17525 - 0.30 - 401- 1.6420 - 2.0 Mean 6.26 61.2 17.05 73.84 89.45 0.148 17.5 0.1843 0.463 Copyright © 2013 SciRes. IJG  E. A. AYOLABI ET AL. 858 Table metntents (µg/l) of wateles obtarom wd bors arou Sam 2. Heavyals cor sampined fells aneholend the dump. ples ACdZn Ba Cu Co CrNi s Mn PbBr W1 nd 0.06 5.4 29.05 nd 10.3 0.12 7.4 4.8 nd 370 W2 0.7 0.42.482 3 Range 0.2 0.0.24 2.0.9 20.22.60.10.40.2 0.0 137 0. 28 7.1 46 0.7 5.1 0.18 6.7 1.8 nd W3 0.9 0.06 2 33.15 0.9 2.8 0.16 8.6 0.3 nd 700 W4 0.5 0.1 9 38.28 0.5 4.3 0.12 9.1 nd nd 278 W5 1.4 0.23 5.4203.4 1.4 4.2 2.18 0.7 3.8 2.3 371 W6 1 nd 9.6 32.92 1 6 0.21 7.6 1.7 nd 266 W7 0.8 nd 25.1 33.08 0.8 8.5 0.12 4.4 1.6 0.1 138 W8 1.1 0.14 45.9 127.5 1.1 9.2 0.57 3.8 2.2 7 890 W9 1.4 nd 4.3 76.14 1.4 19.6 0.43 13.4 7.3 0.2 269 W10 4.2 nd 3.2 116.8 4.2 8.5 1.49 21.4 9.2 nd 3547 5 - 4.6 - 0 - 459 - 203.45 - 4.8 - 19.2 - 2.187 - 21.3 - 9.1 - 7.8 - 354 Mean 1.33 14514.7 73.28 1.33 7.85 0.56 8.31 3.63 2.4 731 ST 1.12 0.092 15.32 58.46 1.12 4.82 0.708 5.73 2.96 3.23 1014 ble 3. Anions co andal pters ter ced frols andholendmps Cl Tantents phy sicarameof waollectm wel bores ar ou the duite. NO3 PO4 SO4 EC TDS Salinity DO TH Turb Temp SWL Samples µg/l µg/l µg/l µg/l µS/cm µg/l µg/l µg/l µg/l NTU (˚C) m W1 70 8. Range 4 1.5 0.0.2 0.04532120.04.0.4122 1.5 27..92.0.0 1. 6. 1.2 0.09 0.07 952 480 0.18 4.4 200 4.5 28.2 8 BW2 93 2.3 0.06 0.09 454 211 0.22 4.2 140 2.7 27.9 W3 107 2.5 1.2 1.21 954 388 0.23 4.3 236 2.9 28.3 6 W4 62 2.6 0.1 1.27 1014 249 0.09 4.1 240 1.5 28.4 6 W5 187 1.9 0.7 1.01 1151 573 0.4 4.2 228 3.2 28.4 13 W6 85 2.2 0.05 0.06 994 496 0.17 4 188 6.9 28.3 5 W7 40 1.76 2.1 0.08 1007 504 0.08 4.3 120 2.2 28.2 6 BW8 163 1.24 1.7 0.05 1120 561 0.34 4.1 164 2.9 29.9 W9 102 3.5 3.2 2.09 1643 822 0.18 4 652 22.3 29.9 2 W10 387 2.9 3 2.12 1123 399 0.69 4.2 428 22.5 27.2 4 0 - 3872 - 3.5 - 35 - 2.12 4 - 1641 - 828 - 0.69 - 40 - 655 - 22.2 - 29 - 3 Mean 130 2.21 220.81 1041 468.3 0.26 4.18 259.6 7.16 28.47 58 ST 101 0.71 1.23 0.85 289 174 0.18 0.13 161.9 8.17 0.83 samourrigiichrobabe dumte ef- uents. Figu a)); anil, NO4 a4, Figure 8(b)); total heavy metals (As, Cd, Zn, Ba, Mn, Cu, Co, e sce on wh is ply thpsi fl Of significant importance is the decreasing level of all measured parameters (total physical parameters, total anions, total heavy metals and total radioactive metals) from NW-SE direction (wells 8 - 10 to wells 1 - 7). Fig- ure 8 was derived from the combine contributions of physical parameters (EC, TDS, Salinity, DO and TH, Cr, Ni and Br, Figure 8(c)); and total radioactive metals (U, Sr, Rb, Nd, Sb, Sm and V, Figure 8(d)) measured from water samples around the dumpsite. For each group of parameters, we found the combine contributions of the measured parameters at each location using the equation. re 8(total ons (CO3, Pnd SO Copyright © 2013 SciRes. IJG 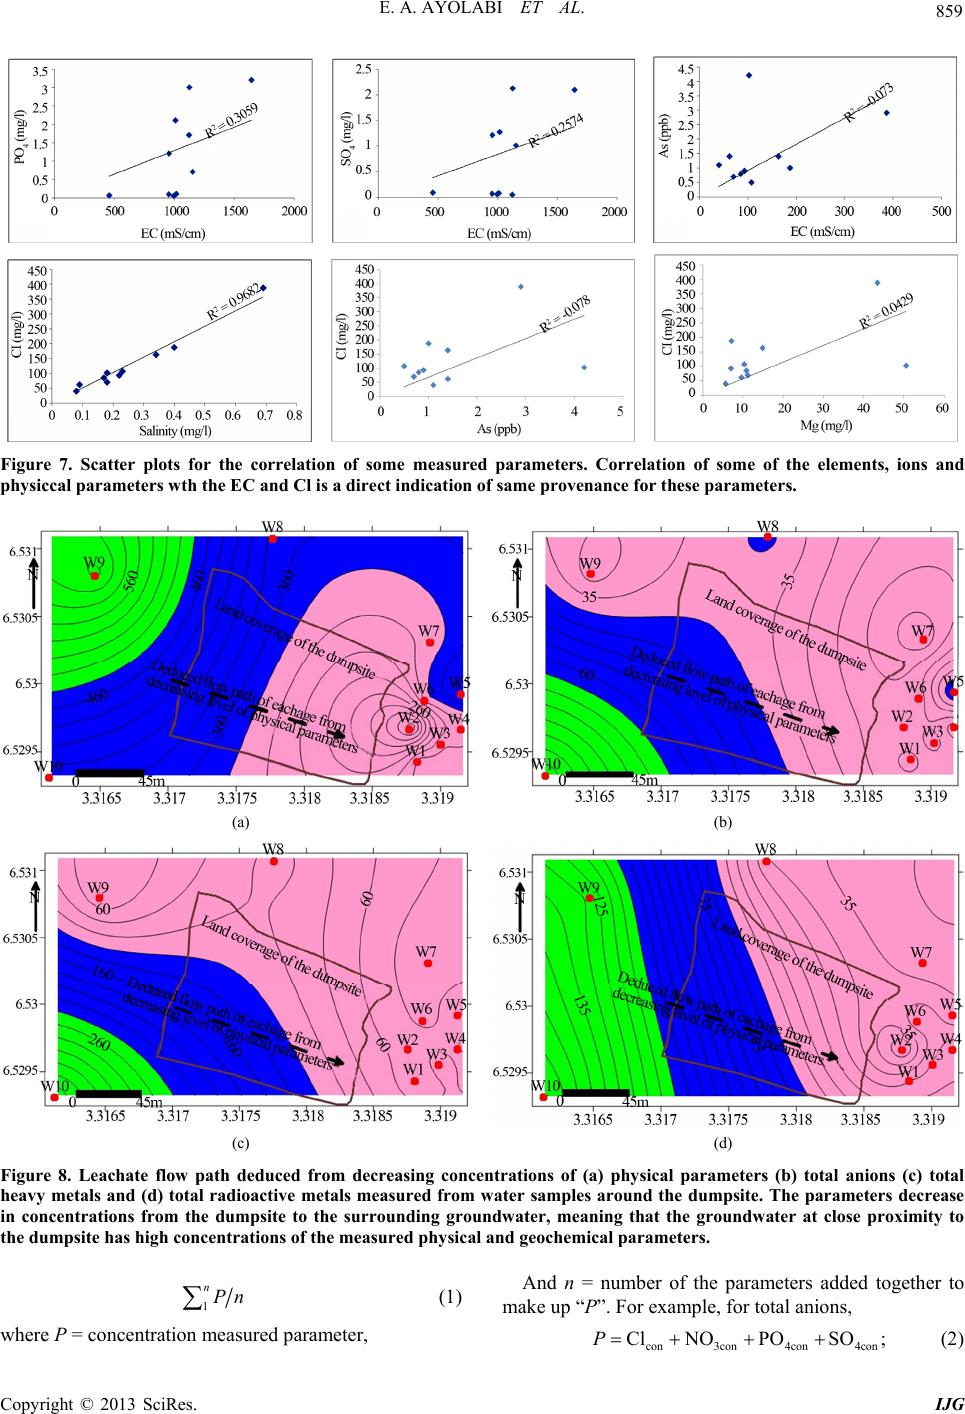 E. A. AYOLABI ET AL. 859 Figure 7. Scatter plots for the correlation of some measured parameters. Correlation of some of the elements, ions and physiccal parameters wth the EC and Cl is a direct indication of same provenance for these parameters. (a) (b) (c) (d) Figure 8. Leachate flow path deduced from decreasing concentrations of (a) physical parameters (b) total anions (c) total heavy metals and (d) total radioactive metals measured from water samples around the dumpsite. The parameters decrease in concentrations from the dumpsite to the surrounding groundwater, meaning that the groundwater at close proximity to the dumpsite has high concen trations of the measured physical and geochemical par a me ters. 1 nPn (1) where P = concentration measured parameter, And n = number of the parameters added together to make up “P”. For example, for total anions, con Cl NOP3con4con 4con POSO; (2) Copyright © 2013 SciRes. IJG 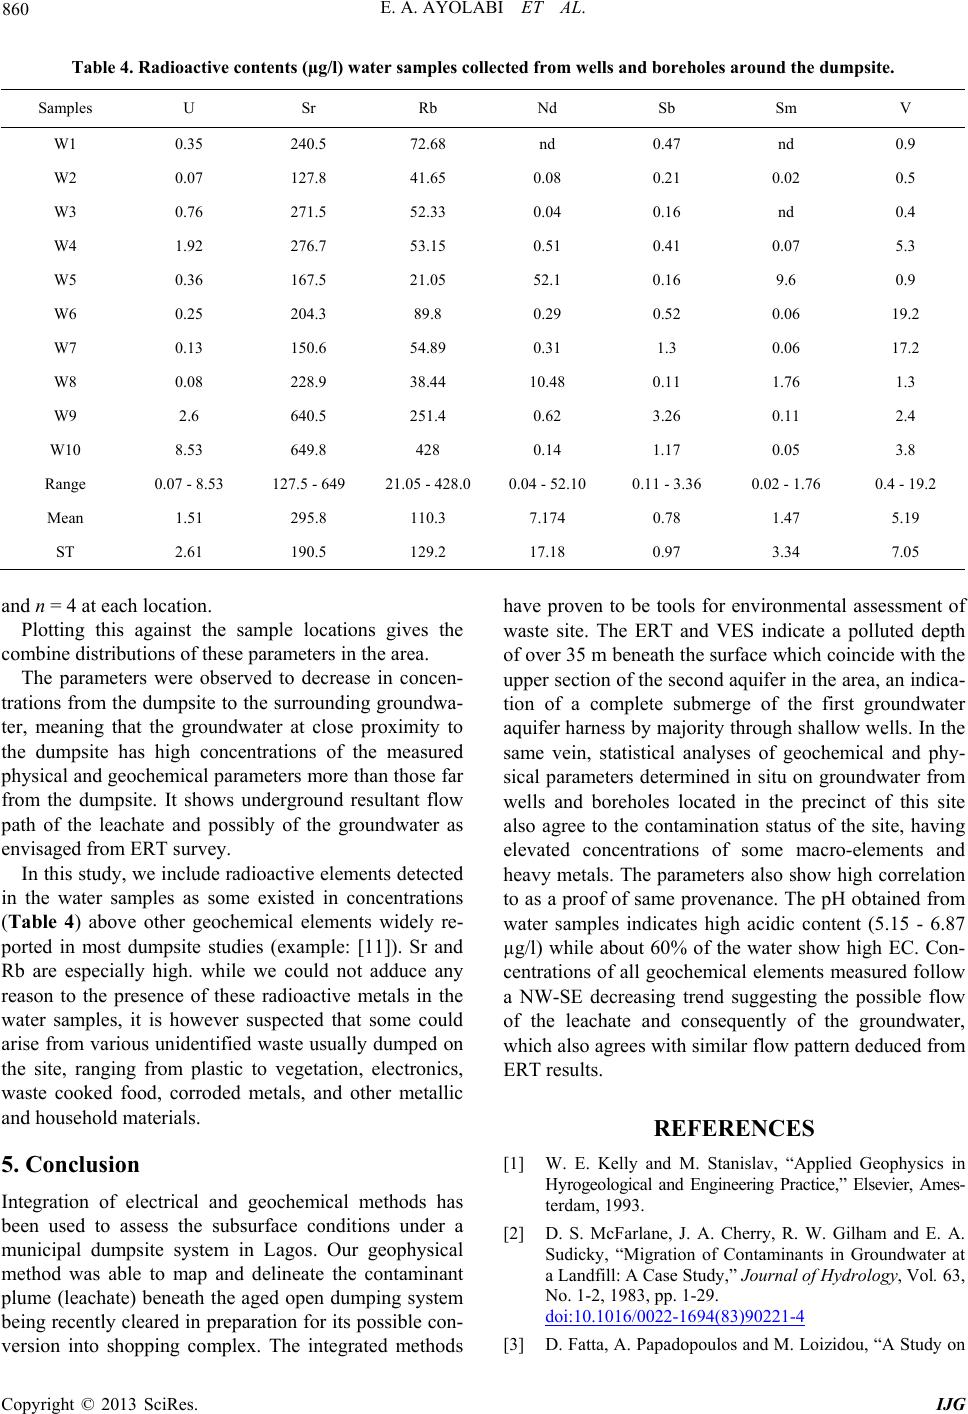 E. A. AYOLABI ET AL. 860 Table 4. Radioactive contents (µg/l) water samples colle cted from wells and boreholes around the dumpsite. Samples U Nd Sb Sm Sr Rb V W1 0.35 240.5 72.68 nd 0.47 nd 0.9 W2 0.07 127.8 41.65 0.08 0.21 0.02 0.5 W3 0.76 271.5 52.33 0.04 0.16 nd 0.4 1.276.7 53.0.5. 52. W6 0.25 204.3 89.8 0.29 0.52 0.06 19.2 0. 17. W9 2.6 640.5 251.4 0.62 3.26 0.11 2.4 W Range 0.07 -53 127.21.05 -0 0.04 -10 0.11 -36 0.02 -76 0.4 -2 Mean 1.51 295.8 110.3 7.174 0.78 1.47 5.19 2. 7. W4 92 15 51 0.41 0.07 3 W5 0.36 167.5 21.05 1 0.16 9.6 0.9 W7 0.13 150.6 54.89 0.31 1.3 06 2 W8 0.08 228.9 38.44 10.48 0.11 1.76 1.3 10 8.53 649.8 428 0.14 1.17 0.05 3.8 8.5 - 649 428. 52. 3. 1. 19. ST 61 190.5 129.2 17.18 0.97 3.34 05 and n each l Plois againe sampltions give combstributionsese param the area. The parameters wserved tease in c- ations from the dumpsite to the surrounding groundwa- dwater at close proximity to th r fr we could not adduce any re in Lagos. Our geophysical o map and delineate the contaminant eneath the aged open dumping system to or enal as wae. The End VES ite a polluepth of over 35 m beneath the surface which coincide with the uption of thond aquifhe area, ca- tion of a complete submerge of the first groundwater 16/0022-1694(83)90221-4 = 4 atocation. tting th ine di st th of th e loca eters in es th ere obo decroncen tr ter, meaning that the groun e dumpsite has high concentrations of the measured physical and geochemical parameters more than those fa om the dumpsite. It shows underground resultant flow path of the leachate and possibly of the groundwater as envisaged from ERT survey. In this study, we include radioactive elements detected in the water samples as some existed in concentrations (Table 4) above other geochemical elements widely re- ported in most dumpsite studies (example: [11]). Sr and Rb are especially high. while ason to the presence of these radioactive metals in the water samples, it is however suspected that some could arise from various unidentified waste usually dumped on the site, ranging from plastic to vegetation, electronics, waste cooked food, corroded metals, and other metallic and household materials. 5. Conclusion Integration of electrical and geochemical methods has been used to assess the subsurface conditions under a municipal dumpsite system method was able t plume (leachate) b being recently cleared in preparation for its possible con- version into shopping complex. The integrated methods aquifer harness by majority through shallow wells. In the same vein, statistical analyses of geochemical and phy- sical parameters determined in situ on groundwater from wells and boreholes located in the precinct of this site also agree to the contamination status of the site, having have provenbe tools fvironmentsessment of ste sitRT andicated d per sece secer in tan indi elevated concentrations of some macro-elements and heavy metals. The parameters also show high correlation to as a proof of same provenance. The pH obtained from water samples indicates high acidic content (5.15 - 6.87 µg/l) while about 60% of the water show high EC. Con- centrations of all geochemical elements measured follow a NW-SE decreasing trend suggesting the possible flow of the leachate and consequently of the groundwater, which also agrees with similar flow pattern deduced from ERT results. REFERENCES [1] W. E. Kelly and M. Stanislav, “Applied Geophysics in Hyrogeological and Engineering Practice,” Elsevier, Ames- terdam, 1993. [2] D. S. McFarlane, J. A. Cherry, R. W. Gilham and E. A. Sudicky, “Migration of Contaminants in Groundwater at a Landfill: A Case Study,” Journal of Hydrology, Vol. 63, No. 1-2, 1983, pp. 1-29. doi:10.10 [3] D. Fatta, A. Papadopoulos and M. Loizidou, “A Study on Copyright © 2013 SciRes. IJG  E. A. AYOLABI ET AL. 861 the Landfill Leachate and Its Impact on the Groundwater Quality of the Greater Area,” Environmental Geochemis- try and Health, Vol. 21, No. 2, 1999, pp. 175-190. doi:10.1023/A:1006613530137 [4] S. Mor, K. Ravindra, P. R. Dahiya and A. Chandra, “Lea- chate Characterization and Assessment of Groundwater Pollution near Municipal Solid Waste Landfill Site,” En- vironmental Monitoring and Assessment, Vol. 118, No. 1-3, 2006, pp. 435-456. doi:10.1007/s10661-006-1505-7 . 526- .03.019 [5] kos, I. Zacharias, K. Bogdanos and A. Diapoulis, “Groundwater Risk Assess- ment at a Heavily Industrialized Catchment and the Asso- ciated Impacts on a Peri-Urban Wetland,” Journal of En- vironmental Management, Vol. 88, No. 3, 2008, pp 538. E. Dimitriou, I. Karaouzas, K. Sarata doi:10.1016/j.jenvman.2007 ions on Ground- roundwater Pollution Due to a Urban Waste Landfills and [6] R. K. Singh, M. Datta and A. K. Nema, “Review of Groundwater Contamination Hazard Rating Systems for Old Landfills,” Waste Management & Research, Vol. 28, No. 2, 2009, pp. 97-108. E. A. Ayolabi, A. F. Folorunso, L. Adeoti, S. Matthew[7] and E. Atakpo, “2-D and 3-D Electrical Resistivity To- mography and Its Implications,” The 4th Annual Re- search Conference and Fair held at the University of La- gos, Akoka, 8 Jannuary 2009, p. 189. [8] E. A. Ayolabi, “Geoelectric Evaluation of Olushosun Land- fill Site Southwest, Nigeria and Its Implicat water,” Journal of the Geological Society of India, Vol. 66, No. 3, 2005, pp. 318-322. [9] E. A. Ayolabi and J. Oyelayo, “Geophysical and Hydro- chemical Assessment of G Dumpsite in Lagos, Nigeria,” Journal of the Geological Society of India, Vol. 66, No. 5, 2005, pp. 617-622. [10] E. A. Ayolabi and D. Y. Peters, “Hydrochemical and Elec- trical Resistivity Assessment of the Impact of Solid Waste on the Groundwater at Oke-Alfa Refuse Dump- site,” Journal of Engineering and Technology Manage- ment, Vol. 12, No. 1, 2004, pp. 5936-5946. [11] J. Pastor and A. J. Hernández, “Heavy Metals, Salts and Organic Residues in Old Solid Surface Waters in Their Discharge Areas: Determinants for Restoring Their Impact,” Journal of Environmental Management, Vol. 98, 2012, pp. S42-S49. doi:10.1016/j.jenvman.2011.06.048 [12] P. C. Ogbonna and E. O. Ukiwe, “Metals (Hg, As, Fe, Cr) Uptake in Selected Woody Species in Umuahia, Nigeria,” Journal of Applied Sciences in Environmental Sanitation, Vol. 6, No. 1, 2011, pp. 23-28. [13] E. G. Akpokodje, “Principle of Applied and Environmen- badan, Ibadan nal of Environmental Sci- ,” African Journal of Biotechnology, Vol. 4, No. al of Geophysical Research, Vol. 92, No. tal Geology,” Paragraphic Publisher, Port Harcourt, 1999. [14] A. A. Odewande, “Hydro-Chemical Characteristic of the Environmental Impact of Solid Waste; Dumpsite, Orita Aperin Central Refuge Dumpsite in Ibadan. South West- ern, Nigeria,” Ph.D. Thesis, University of I 1999. , [15] G. J. Udom and E. O. Esu, “A Preliminary Assessment of the Impact of Solid Wastes on Soil and Groundwater Sys- Tem in Part of Port Harcourt City and Its Environs. Riv- ers State Nigeria,” Global Jour ences, Vol. 4, No. 1, 2005, pp. 23-30. [16] S. Anon, “Hydrogeological Implications in Solid Waste Disposal,” Bull. International Association Hydrogeol, 2009, pp. 146-158. [17] N. Okoronkwo, J. C. Igwe and E. C. Onwuchekwa, “Risk and Health Implications of Polluted Soils for Crop Pro- duction 13, 2005, pp. 1521-1524. [18] C. Bairds, “Environmental Chemistry,” W.H. Free-man and Company, New York, 1995, pp. 384-387. [19] N. J. Bunce, “Environmental Chemistry,” Winers Pub- lishing Ltd., Winnipeg, 1990. [20] W. D. Daily, W. Lin and T. Buscheck, “Hydrological Pro- perties of Topopah Spring Tuff: Laboratory Measure- ments,” Journ B8, 1987, pp. 7854-7864. doi:10.1029/JB092iB08p07854 [21] A. Ramirez, W. Daily, A. Binley, D. LaBrecque and D. Roelant, “Detection of Leaks in Underground Storage Tanks Using Electrical Resistance Methods” Journal of Environmental & Engineering Geophysics, Vol. 1, No. 3, 1996, pp. 189-203. doi:10.4133/JEEG1.3.189 [22] D. J. LaBrecque, A. Ramirez, W. Daily and A. Binley, “ERT Monitoring of Environmental Remediation Proc- esses,” Measurement Science and Technology, Vol. 7, No. 3, 1996, pp. 375-383. doi:10.1088/0957-0233/7/3/019 [23] W. D. Daily, A. L. Ramirez and R. Johnson, “Electrical Impedance Tomography of a Perchloroethylene Release,” Journal of Environmental & Engineering Geophysics, Vol. 2, No. 3, 1998, pp. 189-201. [24] E. Auken, L. Pellerin, N. B. Christensen and K. Sorensen, “A Survey of Current Trends in Near-Surface Electrical and Electromagnetic Methods,” Geophysics, Vol. 71, No. adi 1023/A:1015044200567 5, 2006, pp. G249-G260. [25] E. A. Al-Sayed and G. El-Qady, “Evaluation of Sea Wa- ter Intrusion Using the Electrical Resistivity and Tran- sient Electromagnetic Survey: Case Study at Fan of W Feiran, Sinai, Egypt,” EGM International Workshop In- novation in EM, Gravity and Magnetic Methods: A New Perspective for Exploration Capri, Capri, 15-18 April 2007. [26] L. Pellerin, “Applications of Electrical and Electromag- netic Methods for Environmental and Geotechnical In- vestigations,” Surveys in Geophysics, Vol. 23, No. 2-3, 2002, pp. 101-132. doi:10. y Journal, Vol. 16, No. 2, 2008, pp. 349-361. physi- [27] M. O. Olorunfemi, A. I. Idoringie and A. T. Coker, “Ap- plication of the Electrical Resistivity Method in Founda- tion Failure Investigation: A Case Study,” Global Journal of Geological Sciences, Vol. 2, No. 1, 2004, pp. 139-151. [28] M. Corriols and T. Dahlin, “Geophysical Characterization of the Leon-Chinandega Aquifer Nicaragua,” Hydro- geolog [29] A. A. Nigm, R. A. Elterb, F. E. Nasr and H. M. Thobaity, “Contribution of Ground Magnetic and Resistivity Meth- ods in Groundwater Assessment in Wadi Bany Omair. Holy Makkah Area, Saudi Arabia,” Egyptian. Geo cal Society Journal, Vol. 6, No. 1, 2008, pp. 67-79. [30] E. A. Ayolabi, E. A. Atakpo, L. Adeoti, E. C. Otobor and T. Arerin, “Groundwater Quality Assessment Using Pre- drilling Electrical Measurements,” Journal of Environ- Copyright © 2013 SciRes. IJG  E. A. AYOLABI ET AL. Copyright © 2013 SciRes. IJG 862 rbon ntola mental Hydrology, Vol. 17, 2009, pp. 1-12. [31] E. A. Ayolabi, A. F. Folorunso and P. W. Obende, “Inte- grated Assessments of Possible Effects of Hydroca and Salt Water Intrusion on the Groundwater of Iganmu Area of Lagos Metropolis, Southwestern Nigeria,” Earth Sciences Researc h Journal, Vol. 14, No. 1, 2010, pp. 100- 110. [32] E. A. Ayolabi, A. F. Folorunso and M. O. Oloru, “Constraining Causes of Structural Failure Using Electri- cal Resistivity Tomography (ERT): A Case Study of La- gos, Southwestern, Nigeria,” Mineral Wealth, Vol. 156, No. 4, 2010, pp. 7-18. [33] L. Giovanni, “The Use of Geophysical Methods for 3-D Images of Total Root Volume of Soil in Urban Environ- ments,” Exploration Geophysics, Vol. 41, No. 4, 2010, pp. 268-278. doi:10.1071/EG09034 [34] N. Myers, “Population, Resources and the Environment: The Critical Challenges,” UNPF—United Nation Popula- h.D. thesis, University of Ibadan, tion Fund, New York, 1991. [35] O. Oresanya, “Integrated Waste Management in Lagos State—Shifting the Paradigm,” Annual Conferen ce of NMGS, Minna, 6-11 March 2011, pp. 1-117. [36] H. A. Jones and R. D. Hockey, “The Geology of Part of Southwestern Nigeria,” Bulletin (Geological Survey of Nigeria), Vol. 31, 1964, p. 87. [37] C. A. Kogbe, “Geology of Nigeria,” 2nd Revised Edition, Elizabethan Publishing Company, Rock View Nigeria Ltd, Jos, 1989, p. 538. [38] M. E. Omatsola and O. S. Adegoke, “Tectonic and Cre- taceous Stratigraphy of the Dahomey Basin,” Journal of Geology and Mining Research, Vol. 154, No. 1, 1981, pp. 65-68. [39] H. G. Billman, “Offshore Stratigraphy and Paleontology of Dahomey Embayment, West Africa. Nigerian,” Asso- ciation of Petroleum Explorationist Bulletin, Vol. 7, No. 2, 1992, pp. 121-130. [40] M. E. Nton, “Sedimentological and Geochemical Studies of Rock units in the Eastern Dahomey Basin, South West- ern Nigeria,” Unpubl P Ibadan, 2001. [41] NGSA, “The Geological Map of Nigeria,” A Publication of Nigeria Geological Survey Agency, Abuja, 2004. [42] E. O. Longe, S. Malomo and M. A. Olorunniwo, “Hydro- geology of Lagos Metropolis,” Journal of African Earth Sciences, Vol. 6, No. 2, 1987, pp. 163-174. [43] A. A. Adepelumi, B. D. Ako, T. R. Ajayi, O. Afolabi and E. J. Omotoso, “Delineation of Saltwater Intrusion into the Freshwater Aquifer of Lekki. Peninsula, Lagos, Ni- geria,” Environmental Geology, Vol. 56, No. 5, 2008, pp. 927-933. doi:10.1007/s00254-008-1194-3 [44] D. H. Griffiths, J. Turnbull and A. I. Olayinka, “Two-Di- mensional Resistivity Mapping with a Computer-Con- trolled Array,” First Break, Vol. 8, No. 4, 1990, pp. 121- etrics.c 129. [45] M. H. Loke, “Tutorial: 2-D and 3-D Electrical Imaging Surveys,” 2004 Revised Edition. www.geomom [46] A. Dey and H. F. Morrison, “Resistivity Modelling for Arbitrary Shaped Two-Dimensional Structures,” Geophy- sical Prospecting, Vol. 27, No. 1, 1979, pp. 1020-1036. doi:10.1111/j.1365-2478.1979.tb00961.x [47] C. Degroot-Hedlin and C. Constable, “Occam’s Inversion to Generate Smooth Two-Dimensional Models from Mag- netotelluric Data,” Geophysics, Vol. 55, No. 12, 1990, pp. 1613-1624. , ospecting, Vol. [48] M. H. Loke, “The Inversion of Two-Dimensional Resis- tivity Data,” Ph.D. thesis, University of Birmingham Birmingham, 1994. [49] M. H. Loke and R. D. Barker, “Rapid Least-Squares In- version of Apparent Resistivity Pseudosections Using a Quasi-Newton Method,” Geophysical Pr 44, No. 1, 1996, pp. 131-152. doi:10.1111/j.1365-2478.1996.tb00142.x [50] T. Dahlin and M. H. Loke, “Resolution of 2D Wenner Resistivity Imaging as Assessed by Numerical Model- ling,” Journal of Applied Geophysics, Vol. 38, No. 4, 1998, pp. 237-249. doi:10.1016/S0926-9851(97)00030-X [51] M. H. Loke, I. Acworth and T. Dahlin, “A Comparison of Smooth and Blocky Inversion Methods in 2D Electrical Imaging Surveys,” Exploration Geophysics, Vol. 34, No. 3, 2003, pp. 182-187. doi:10.1071/EG03182 [52] S. Murali and N. S. Patangay, “P of Groundwater Geophysics,” 3rd Edition rinciples and Application , Association of No. Exploration Geophysicists, Hyderabad, 2006. [53] V. O. Olanrewaju, M. O. Olorunfemi and O. Alade, “Che- mical Characteristic of Groundwater from Some Parts of the Basement Complex of Central Nigeria,” Journal of Mining and Geology, Vol. 33, No. 2, 1996, pp. 135-139. [54] K. M. Ibe Sr and A. H. O. Sowa, “Hydrogeology of Part of the Oramiriukwa River Basin, Southeast of Owerri, Imo State, Nigeria,” Hydrogeology Journal, Vol. 10, 4, 2002, pp. 509-521. doi:10.1007/s10040-002-0207-7 [55] A. E. Ofoma, D. A. Omologbe and P. Aigberua, “Phys- ico-Chemical Quality of Groundwater in Parts of Port- , Prohic and V. Soukup, Harcourt City, Eastern Niger Delta Nigeria,” Water Re- sources, Vol. 16, 2005, pp. 18-24. [56] P. R. Ikhane A. F. Folorunso, O. L. Shonibare, A. M. Odukoya and C. O. Shomoye, “Hydrogeochemical Study Health Implications and Interpretation of Surface Water Analysis around Rural Settlements of Itasin and Oki- Gbode, Southwestern, Nigeria,” Research Journal of Ap- plied Sciences, Vol. 6, No. 12, 2010, pp. 2042-2050. [57] W. H. O., “Guidelines for Drinking Water Quality,” 4th Edition, A Publication of World Health Organization, Switzerland, 2011. [58] M. Ahel, N. Mikac, B. Cosovic, E. “The Impact of Contamination from a Municipal Solid Waste Landfill (Zagreb, Croatia) on Underlying Soil,” Water Science and Technology, Vol. 37, No. 8, 1998, pp. 203-210. doi:10.1016/S0273-1223(98)00260-1 [59] SON-Standard Organization of Nigeria, “Standard for Drinking Water Quality,” Nigerian Industrial Standard, Abuja, 2007.
|