Paper Menu >>
Journal Menu >>
 International Journal of Geosciences, 2010, 1, 139-148 doi:10.4236/ijg.2010.13018 Published Online November 2010 (http://www.SciRP.org/journal/ijg) Copyright © 2010 SciRes. IJG Pedoecological Regularities of Organic Carbon Retention in Estonian Mineral Soils Raimo Kõlli1, Tiina Köster2, Karin Kauer1, Illar Lemetti1 1Institute of Agricultural and Environmental Sciences, Estonian University of Life Sciences, Kreutzwaldi, Tartu, Estonia 2Agricultural Research Centre, Tartu, Estonia E-mail: raimo.kolli@emu.ee Received July 27, 2010; revised August 24, 2010; accepted September 1, 2010 Abstract Soil organic carbon (SOC) retaining capacities of epipedon (EP), subsoil (SS) and soil cover (SC) as a whole, are soil type specific. Depending on individual and sites characteristics, the generalized humus status indices of soil types (EP and SC thickness and SOC stocks) may vary. Land use and land use change primarily in- fluence the properties and fabric of the EP, but the humus status (SOC concentration and stock, fabric of ho- rizons) of the SS remains practically unchangeable. The mean mineral soils SOC stocks, EP quality and SOC distribution in soil profiles depend mainly on the water regime, mineral composition (texture, calcareous- ness), development of eluvial processes and the land use peculiarities of soils. The mean area weighted SC SOC stock of Estonian mineral soils is 99.9 Mg ha–1, thereby the mean hydromorphic soils SOC retention capacity considerably exceeds the SOC retention capacity of automorphic soils (means are accordingly 127.5 and 78.9 Mg ha–1). The sustainable management of SOC is based on adequate information about actual SOC stocks and theoretically established or optimal humus status levels of soil types. The aggregate of SOC re- tained in the mineral soils of Estonia (3,235,100 ha) amounts to 323 ± 46 Tg (1 Tg = 1012 g). Approximately 42% of this is sequestered into stabilized humus, 40% into instable raw-humous material and 18% into forest (grassland) floor and shallow peat layers. Keywords: Carbon Retention Capacity, Land Use, Mineral Soils, Pedoecological Regularities 1. Introduction Soil organic carbon (SOC) is retained in the soil profile and its horizons in different forms and states and, largely, determines soil functioning and development [1-3]. A prerequisite for the pedoecological study of SOC cycling and dynamics is the quantification of SOC storage by soil types, especially in those soil layers in which most soil organic matter (SOM) is accumulated [4,5]. Every soil type has specific SOC flow throughout the soil cover (SC) depending on ecological conditions [6,7]. The fea- tures characteristic of certain soil types may differ in SOC stocks and cycling intensity, in soil edaphon activ- ity, and in vertical distribution of the humus profile [4,8, 9]. Differences also exist in, for example, input composi- tion (biochemical, ash content), in input dynamics, in characteristics of transformation, and in the residence time of SOM in soil [5,8]. Several studies [10-12] have clarified that SOC-retaining capacity depends on the soil moisture regime, clay and carbonate content in fine earth, and on the character of soil management. In comparative analyses and evaluation of local soils SOC-retaining po- tential, the generalized soil types SOC densities and total stocks of SC received in various ecological regions [13- 16] were necessary for our work. In our previous work, the soil humus status (or func- tioning of soil in relation to SOC stocks and cycling) was treated separately in arable [17], forest [18] and grass- land [19] soils. In these works, the basic characteristics of soil humus status were the thickness and fabric of the epipedon (EP) layer and SC, stocks and concentrations of SOC (and SOM) in different soil horizons and layers, and humus quality, determined by EP types. The main tasks of the actual study were: 1) to generalize the data about SOC stocks by soil types, 2) to analyse the influ- ence of land use change on SOC retention in soil, 3) to elucidate the generalized pedoecological regularities of SOC retention in soil and management, and 4) to identify the share of mineral soils in total Estonian SOC storage. 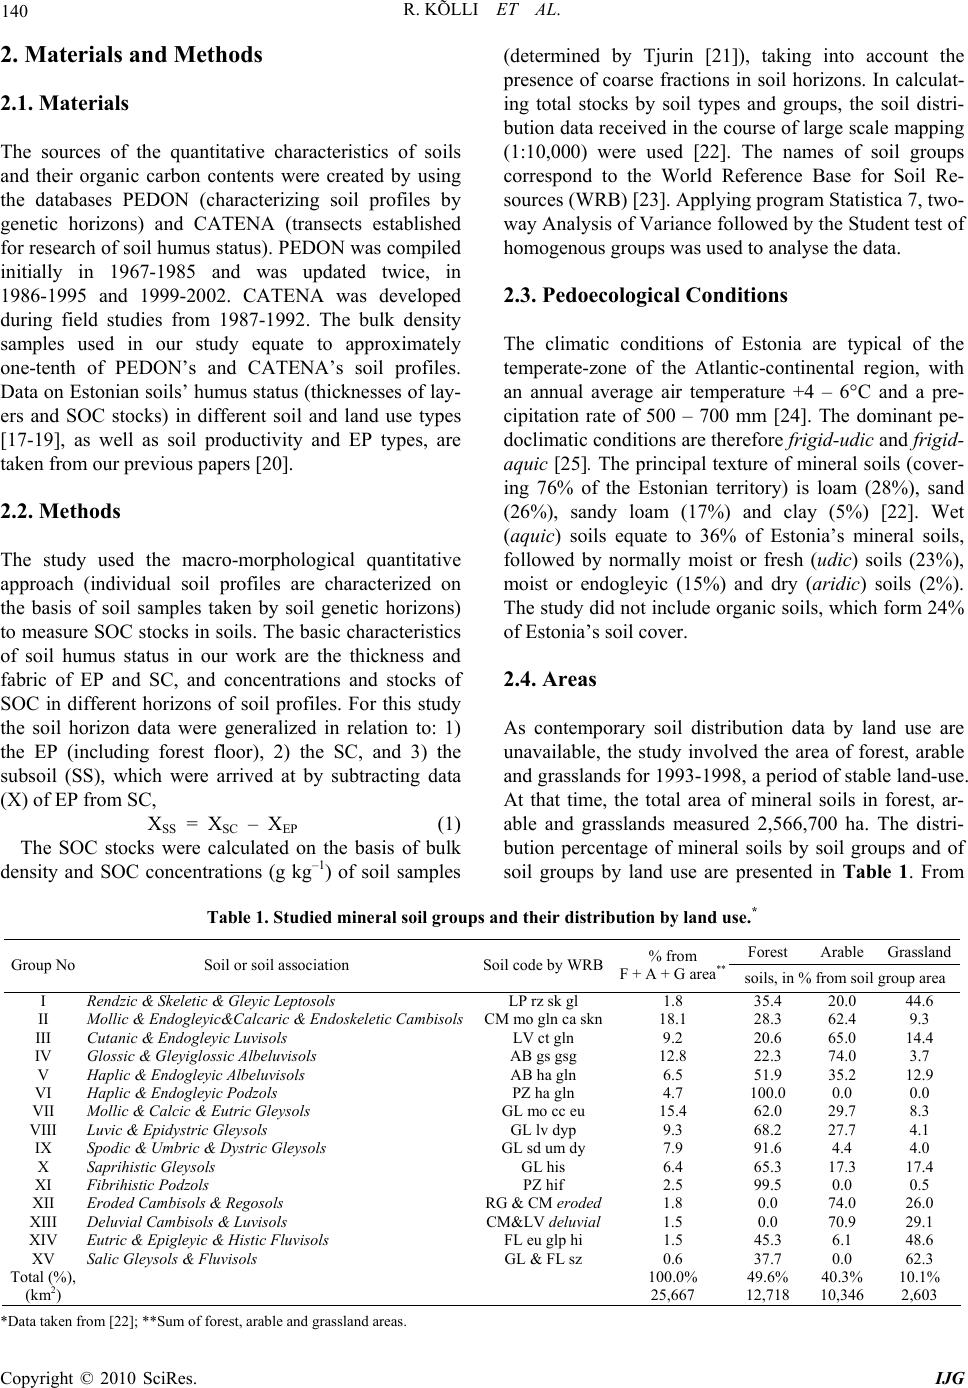 140 R. KÕLLI ET AL. 2. Materials and Methods 2.1. Materials The sources of the quantitative characteristics of soils and their organic carbon contents were created by using the databases PEDON (characterizing soil profiles by genetic horizons) and CATENA (transects established for research of soil humus status). PEDON was compiled initially in 1967-1985 and was updated twice, in 1986-1995 and 1999-2002. CATENA was developed during field studies from 1987-1992. The bulk density samples used in our study equate to approximately one-tenth of PEDON’s and CATENA’s soil profiles. Data on Estonian soils’ humus status (thicknesses of lay- ers and SOC stocks) in different soil and land use types [17-19], as well as soil productivity and EP types, are taken from our previous papers [20]. 2.2. Methods The study used the macro-morphological quantitative approach (individual soil profiles are characterized on the basis of soil samples taken by soil genetic horizons) to measure SOC stocks in soils. The basic characteristics of soil humus status in our work are the thickness and fabric of EP and SC, and concentrations and stocks of SOC in different horizons of soil profiles. For this study the soil horizon data were generalized in relation to: 1) the EP (including forest floor), 2) the SC, and 3) the subsoil (SS), which were arrived at by subtracting data (X) of EP from SC, XSS = XSC – XEP (1) The SOC stocks were calculated on the basis of bulk density and SOC concentrations (g kg–1) of soil samples (determined by Tjurin [21]), taking into account the presence of coarse fractions in soil horizons. In calculat- ing total stocks by soil types and groups, the soil distri- bution data received in the course of large scale mapping (1:10,000) were used [22]. The names of soil groups correspond to the World Reference Base for Soil Re- sources (WRB) [23]. Applying program Statistica 7, two- way Analysis of Variance followed by the Student test of homogenous groups was used to analyse the data. 2.3. Pedoecological Conditions The climatic conditions of Estonia are typical of the temperate-zone of the Atlantic-continental region, with an annual average air temperature +4 – 6°C and a pre- cipitation rate of 500 – 700 mm [24]. The dominant pe- doclimatic conditions are therefore frigid-udic and frigid- aquic [25]. The principal texture of mineral soils (cover- ing 76% of the Estonian territory) is loam (28%), sand (26%), sandy loam (17%) and clay (5%) [22]. Wet (aquic) soils equate to 36% of Estonia’s mineral soils, followed by normally moist or fresh (udic) soils (23%), moist or endogleyic (15%) and dry (aridic) soils (2%). The study did not include organic soils, which form 24% of Estonia’s soil cover. 2.4. Areas As contemporary soil distribution data by land use are unavailable, the study involved the area of forest, arable and grasslands for 1993-1998, a period of stable land-use. At that time, the total area of mineral soils in forest, ar- able and grasslands measured 2,566,700 ha. The distri- bution percentage of mineral soils by soil groups and of soil groups by land use are presented in Table 1. From Table 1. Studied mineral soil groups and their distribution by land use .* Forest Arable Grassland Group No Soil or soil association Soil code by WRB% from F + A + G area** soils, in % from soil group area I Rendzic & Skeletic & Gleyic Leptosols LP rz sk gl 1.8 35.4 20.0 44.6 II Mollic & Endogleyic&Calcaric & Endoskeletic CambisolsCM mo gln ca skn18.1 28.3 62.4 9.3 III Cutanic & Endogleyic Luvisols LV ct gln 9.2 20.6 65.0 14.4 IV Glossic & Gleyiglossic Albeluvisols AB gs gsg 12.8 22.3 74.0 3.7 V Haplic & Endogleyic Albeluvisols AB ha gln 6.5 51.9 35.2 12.9 VI Haplic & Endogleyic Podzols PZ ha gln 4.7 100.0 0.0 0.0 VII Mollic & Calcic & Eutric Gleysols GL mo cc eu 15.4 62.0 29.7 8.3 VIII Luvic & Epidystric Gleysols GL lv dyp 9.3 68.2 27.7 4.1 IX Spodic & Umbric & Dystric Gleysols GL sd um dy 7.9 91.6 4.4 4.0 X Saprihistic Gleysols GL his 6.4 65.3 17.3 17.4 XI Fibrihistic Podzols PZ hif 2.5 99.5 0.0 0.5 XII Eroded Cambisols & Regosols RG & CM eroded 1.8 0.0 74.0 26.0 XIII Deluvial Cambisols & Luvisols CM&LV deluvial 1.5 0.0 70.9 29.1 XIV Eutric & Epigleyic & Histic Fluvisols FL eu glp hi 1.5 45.3 6.1 48.6 XV Salic Gleysols & Fluvisols GL & FL sz 0.6 37.7 0.0 62.3 Total (%), (km2) 100.0% 25,667 49.6% 12,718 40.3% 10,346 10.1% 2,603 *Data taken from [22]; **Sum of forest, arable and grassland areas. Copyright © 2010 SciRes. IJG 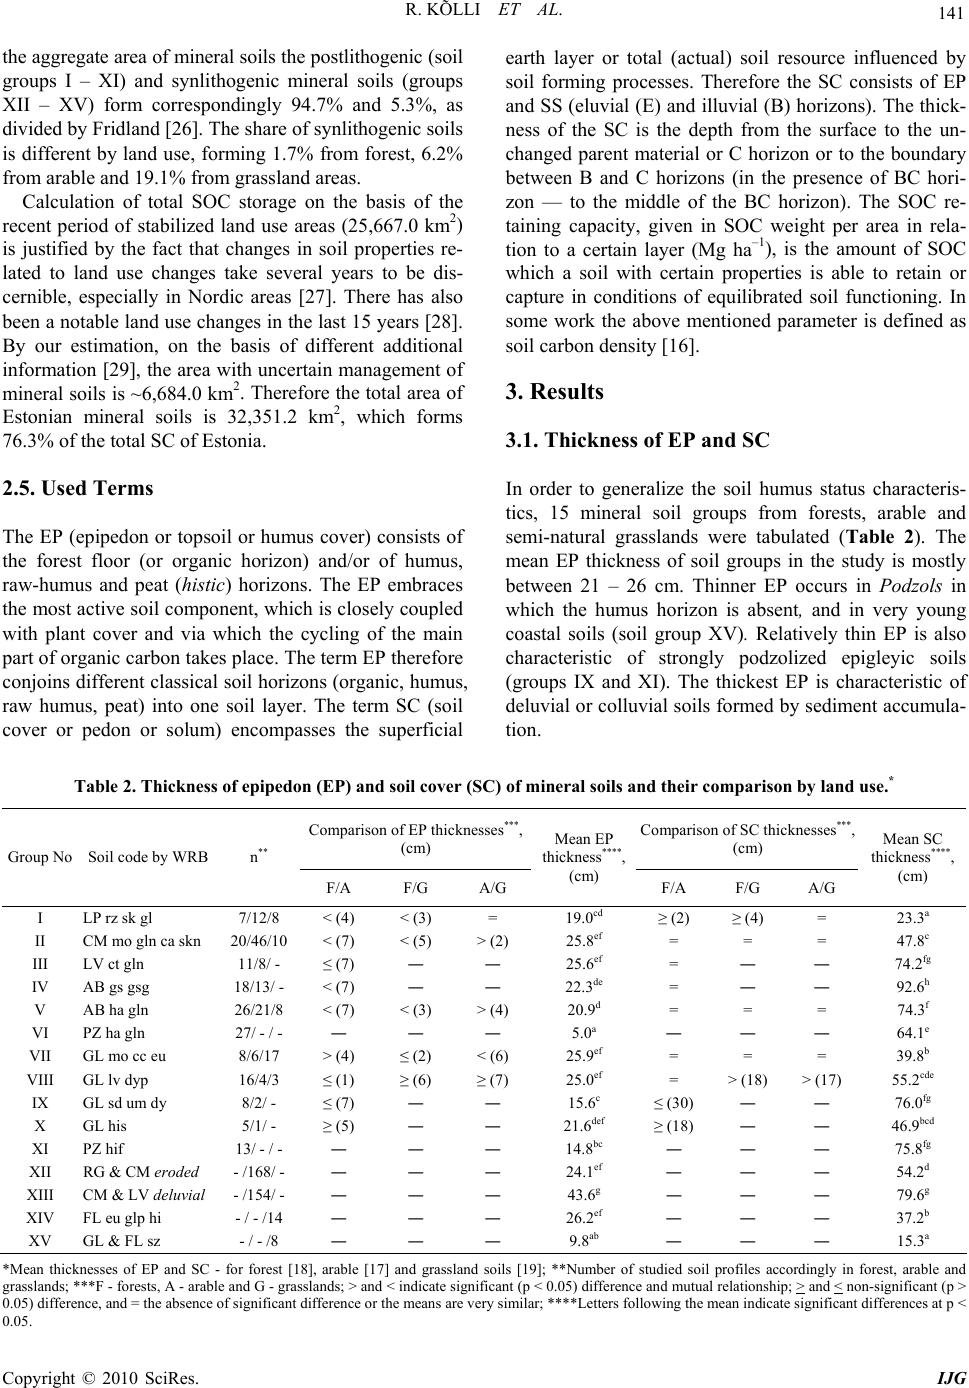 R. KÕLLI ET AL. Copyright © 2010 SciRes. IJG 141 the aggregate area of mineral soils the postlithogenic (soil groups I – XI) and synlithogenic mineral soils (groups XII – XV) form correspondingly 94.7% and 5.3%, as divided by Fridland [26]. The share of synlithogenic soils is different by land use, forming 1.7% from forest, 6.2% from arable and 19.1% from grassland areas. Calculation of total SOC storage on the basis of the recent period of stabilized land use areas (25,667.0 km2) is justified by the fact that changes in soil properties re- lated to land use changes take several years to be dis- cernible, especially in Nordic areas [27]. There has also been a notable land use changes in the last 15 years [28]. By our estimation, on the basis of different additional information [29], the area with uncertain management of mineral soils is ~6,684.0 km2. Therefore the total area of Estonian mineral soils is 32,351.2 km2, which forms 76.3% of the total SC of Estonia. 2.5. Used Terms The EP (epipedon or topsoil or humus cover) consists of the forest floor (or organic horizon) and/or of humus, raw-humus and peat (histic) horizons. The EP embraces the most active soil component, which is closely coupled with plant cover and via which the cycling of the main part of organic carbon takes place. The term EP therefore conjoins different classical soil horizons (organic, humus, raw humus, peat) into one soil layer. The term SC (soil cover or pedon or solum) encompasses the superficial earth layer or total (actual) soil resource influenced by soil forming processes. Therefore the SC consists of EP and SS (eluvial (E) and illuvial (B) horizons). The thick- ness of the SC is the depth from the surface to the un- changed parent material or C horizon or to the boundary between B and C horizons (in the presence of BC hori- zon — to the middle of the BC horizon). The SOC re- taining capacity, given in SOC weight per area in rela- tion to a certain layer (Mg ha–1), is the amount of SOC which a soil with certain properties is able to retain or capture in conditions of equilibrated soil functioning. In some work the above mentioned parameter is defined as soil carbon density [16]. 3. Results 3.1. Thickness of EP and SC In order to generalize the soil humus status characteris- tics, 15 mineral soil groups from forests, arable and semi-natural grasslands were tabulated (Table 2). The mean EP thickness of soil groups in the study is mostly between 21 – 26 cm. Thinner EP occurs in Podzols in which the humus horizon is absent, and in very young coastal soils (soil group XV). Relatively thin EP is also characteristic of strongly podzolized epigleyic soils (groups IX and XI). The thickest EP is characteristic of deluvial or colluvial soils formed by sediment accumula- tion. Table 2. Thickness of epipedon (EP) and soil cover (SC) of mineral soils and their comparison by land use.* Comparison of EP thicknesses***, (cm) Comparison of SC thicknesses***, (cm) Group No Soil code by WRB n** F/A F/G A/G Mean EP thickness****, (cm) F/A F/G A/G Mean SC thickness****, (cm) I LP rz sk gl 7/12/8 < (4) < (3) = 19.0cd ≥ (2) ≥ (4) = 23.3a II CM mo gln ca skn 20/46/10 < (7) < (5) > (2) 25.8ef = = = 47.8c III LV ct gln 11/8/ - ≤ (7) ― ― 25.6ef = ― ― 74.2fg IV AB gs gsg 18/13/ - < (7) ― ― 22.3de = ― ― 92.6h V AB ha gln 26/21/8 < (7) < (3) > (4) 20.9d = = = 74.3f VI PZ ha gln 27/ - / - ― ― ― 5.0a ― ― ― 64.1e VII GL mo cc eu 8/6/17 > (4) ≤ (2) < (6) 25.9ef = = = 39.8b VIII GL lv dyp 16/4/3 ≤ (1) ≥ (6) ≥ (7) 25.0ef = > (18) > (17) 55.2cde IX GL sd um dy 8/2/ - ≤ (7) ― ― 15.6c ≤ (30) ― ― 76.0fg X GL his 5/1/ - ≥ (5) ― ― 21.6def ≥ (18) ― ― 46.9bcd XI PZ hif 13/ - / - ― ― ― 14.8bc ― ― ― 75.8fg XII RG & CM eroded - /168/ - ― ― ― 24.1ef ― ― ― 54.2d XIII CM & LV deluvial - /154/ - ― ― ― 43.6g ― ― ― 79.6g XIV FL eu glp hi - / - /14 ― ― ― 26.2ef ― ― ― 37.2b XV GL & FL sz - / - /8 ― ― ― 9.8ab ― ― ― 15.3a *Mean thicknesses of EP and SC - for forest [18], arable [17] and grassland soils [19]; **Number of studied soil profiles accordingly in forest, arable and grasslands; ***F - forests, A - arable and G - grasslands; > and < indicate significant (p < 0.05) difference and mutual relationship; > and < non-significant (p > 0.05) difference, and = the absence of significant difference or the means are very similar; ****Letters following the mean indicate significant differences at p < 0.05. 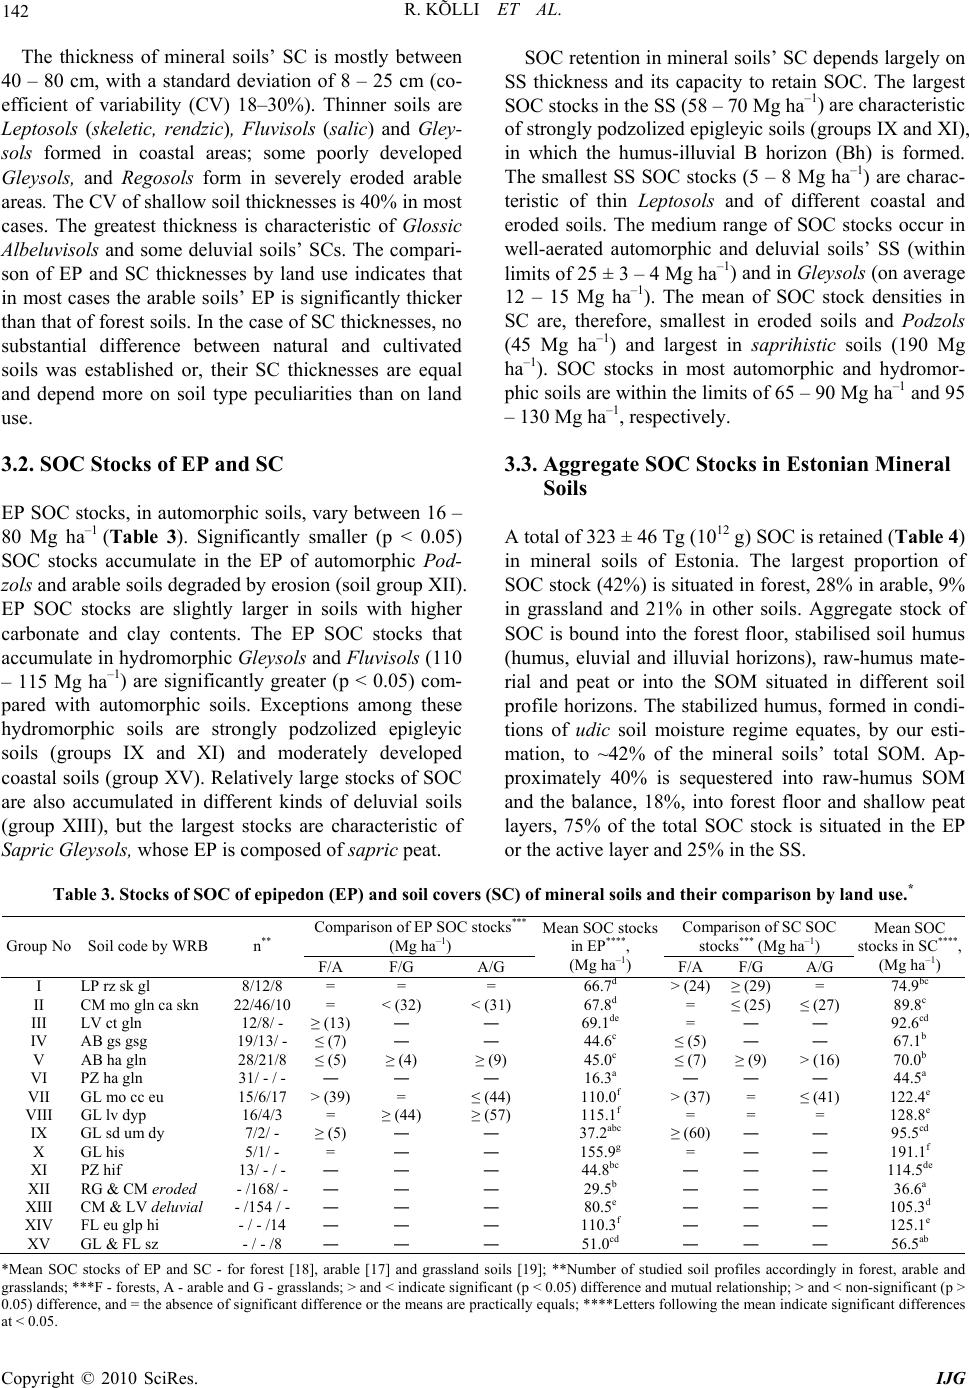 R. KÕLLI ET AL. Copyright © 2010 SciRes. IJG 142 The thickness of mineral soils’ SC is mostly between 40 – 80 cm, with a standard deviation of 8 – 25 cm (co- efficient of variability (CV) 18–30%). Thinner soils are Leptosols (skeletic, rendzic), Fluvisols (salic) and Gley- sols formed in coastal areas; some poorly developed Gleysols, and Regosols form in severely eroded arable areas. The CV of shallow soil thicknesses is 40% in most cases. The greatest thickness is characteristic of Glossic Albeluvisols and some deluvial soils’ SCs. The compari- son of EP and SC thicknesses by land use indicates that in most cases the arable soils’ EP is significantly thicker than that of forest soils. In the case of SC thicknesses, no substantial difference between natural and cultivated soils was established or, their SC thicknesses are equal and depend more on soil type peculiarities than on land use. 3.2. SOC Stocks of EP and SC EP SOC stocks, in automorphic soils, vary between 16 – 80 Mg ha–1 (Table 3). Significantly smaller (p < 0.05) SOC stocks accumulate in the EP of automorphic Pod- zols and arable soils degraded by erosion (soil group XII). EP SOC stocks are slightly larger in soils with higher carbonate and clay contents. The EP SOC stocks that accumulate in hydromorphic Gleysols and Fluvisols (110 – 115 Mg ha–1) are significantly greater (p < 0.05) com- pared with automorphic soils. Exceptions among these hydromorphic soils are strongly podzolized epigleyic soils (groups IX and XI) and moderately developed coastal soils (group XV). Relatively large stocks of SOC are also accumulated in different kinds of deluvial soils (group XIII), but the largest stocks are characteristic of Sapric Gl e ys ols, whose EP is composed of sapric peat. SOC retention in mineral soils’ SC depends largely on SS thickness and its capacity to retain SOC. The largest SOC stocks in the SS (58 – 70 Mg ha–1) are characteristic of strongly podzolized epigleyic soils (groups IX and XI), in which the humus-illuvial B horizon (Bh) is formed. The smallest SS SOC stocks (5 – 8 Mg ha–1) are charac- teristic of thin Leptosols and of different coastal and eroded soils. The medium range of SOC stocks occur in well-aerated automorphic and deluvial soils’ SS (within limits of 25 ± 3 – 4 Mg ha–1) and in Gleysols (on average 12 – 15 Mg ha–1). The mean of SOC stock densities in SC are, therefore, smallest in eroded soils and Podzols (45 Mg ha–1) and largest in saprihistic soils (190 Mg ha–1). SOC stocks in most automorphic and hydromor- phic soils are within the limits of 65 – 90 Mg ha–1 and 95 – 130 Mg ha–1, respectively. 3.3. Aggregate SOC Stocks in Estonian Mineral Soils A total of 323 ± 46 Tg (1012 g) SOC is retained (Table 4) in mineral soils of Estonia. The largest proportion of SOC stock (42%) is situated in forest, 28% in arable, 9% in grassland and 21% in other soils. Aggregate stock of SOC is bound into the forest floor, stabilised soil humus (humus, eluvial and illuvial horizons), raw-humus mate- rial and peat or into the SOM situated in different soil profile horizons. The stabilized humus, formed in condi- tions of udic soil moisture regime equates, by our esti- mation, to ~42% of the mineral soils’ total SOM. Ap- proximately 40% is sequestered into raw-humus SOM and the balance, 18%, into forest floor and shallow peat layers, 75% of the total SOC stock is situated in the EP or the active layer and 25% in the SS. Table 3. Stocks of SOC of epipedon (EP) and soil covers (SC) of mineral soils and their comparison by land use.* Comparison of EP SOC stocks*** (Mg ha–1) Comparison of SC SOC stocks*** (Mg ha–1) Group No Soil code by WRB n** F/A F/G A/G Mean SOC stocks in EP****, (Mg ha–1) F/AF/G A/G Mean SOC stocks in SC****, (Mg ha–1) I LP rz sk gl 8/12/8 = = = 66.7d > (24)≥ (29) = 74.9bc II CM mo gln ca skn 22/46/10 = < (32) < (31) 67.8d = ≤ (25) ≤ (27) 89.8c III LV ct gln 12/8/ - ≥ (13) ― ― 69.1de = ― ― 92.6cd IV AB gs gsg 19/13/ - ≤ (7) ― ― 44.6c ≤ (5)― ― 67.1b V AB ha gln 28/21/8 ≤ (5) ≥ (4) ≥ (9) 45.0c ≤ (7)≥ (9) > (16) 70.0b VI PZ ha gln 31/ - / - ― ― ― 16.3a ― ― ― 44.5a VII GL mo cc eu 15/6/17 > (39) = ≤ (44) 110.0f > (37)= ≤ (41) 122.4e VIII GL lv dyp 16/4/3 = ≥ (44) ≥ (57) 115.1f = = = 128.8e IX GL sd um dy 7/2/ - ≥ (5) ― ― 37.2abc ≥ (60)― ― 95.5cd X GL his 5/1/ - = ― ― 155.9g = ― ― 191.1f XI PZ hif 13/ - / - ― ― ― 44.8bc ― ― ― 114.5de XII RG & CM eroded - /168/ - ― ― ― 29.5b ― ― ― 36.6a XIII CM & LV deluvial - /154 / - ― ― ― 80.5e ― ― ― 105.3d XIV FL eu glp hi - / - /14 ― ― ― 110.3f ― ― ― 125.1e XV GL & FL sz - / - /8 ― ― ― 51.0cd ― ― ― 56.5ab *Mean SOC stocks of EP and SC - for forest [18], arable [17] and grassland soils [19]; **Number of studied soil profiles accordingly in forest, arable and grasslands; ***F - forests, A - arable and G - grasslands; > and < indicate significant (p < 0.05) difference and mutual relationship; > and < non-significant (p > 0.05) difference, and = the absence of significant difference or the means are practically equals; ****Letters following the mean indicate significant differences at < 0.05. 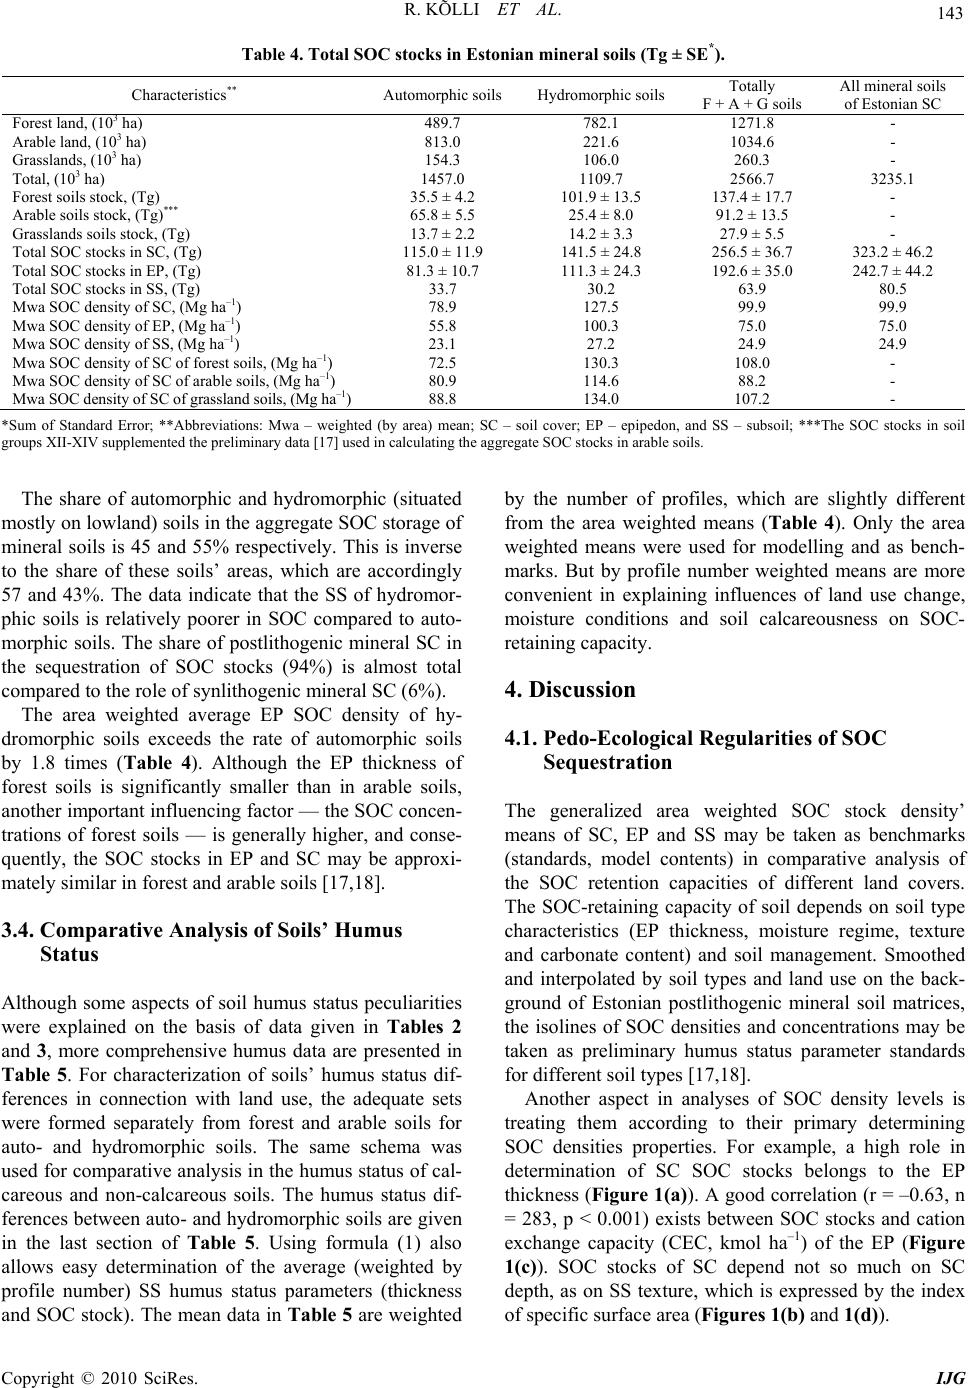 R. KÕLLI ET AL. 143 Table 4. Total SOC stocks in Estonian mineral soils (Tg ± SE*). Characteristics** Automorphic soils Hydromorphic soils Totally F + A + G soils All mineral soils of Estonian SC Forest land, (103 ha) 489.7 782.1 1271.8 - Arable land, (103 ha) 813.0 221.6 1034.6 - Grasslands, (103 ha) 154.3 106.0 260.3 - Total, (103 ha) 1457.0 1109.7 2566.7 3235.1 Forest soils stock, (Tg) 35.5 ± 4.2 101.9 ± 13.5 137.4 ± 17.7 - Arable soils stock, (Tg)*** 65.8 ± 5.5 25.4 ± 8.0 91.2 ± 13.5 - Grasslands soils stock, (Tg) 13.7 ± 2.2 14.2 ± 3.3 27.9 ± 5.5 - Total SOC stocks in SC, (Tg) 115.0 ± 11.9 141.5 ± 24.8 256.5 ± 36.7 323.2 ± 46.2 Total SOC stocks in EP, (Tg) 81.3 ± 10.7 111.3 ± 24.3 192.6 ± 35.0 242.7 ± 44.2 Total SOC stocks in SS, (Tg) 33.7 30.2 63.9 80.5 Mwa SOC density of SC, (Mg ha–1) 78.9 127.5 99.9 99.9 Mwa SOC density of EP, (Mg ha–1) 55.8 100.3 75.0 75.0 Mwa SOC density of SS, (Mg ha–1) 23.1 27.2 24.9 24.9 Mwa SOC density of SC of forest soils, (Mg ha–1) 72.5 130.3 108.0 - Mwa SOC density of SC of arable soils, (Mg ha–1) 80.9 114.6 88.2 - Mwa SOC density of SC of grassland soils, (Mg ha–1) 88.8 134.0 107.2 - *Sum of Standard Error; **Abbreviations: Mwa – weighted (by area) mean; SC – soil cover; EP – epipedon, and SS – subsoil; ***The SOC stocks in soil groups XII-XIV supplemented the preliminary data [17] used in calculating the aggregate SOC stocks in arable soils. The share of automorphic and hydromorphic (situated mostly on lowland) soils in the aggregate SOC storage of mineral soils is 45 and 55% respectively. This is inverse to the share of these soils’ areas, which are accordingly 57 and 43%. The data indicate that the SS of hydromor- phic soils is relatively poorer in SOC compared to auto- morphic soils. The share of postlithogenic mineral SC in the sequestration of SOC stocks (94%) is almost total compared to the role of synlithogenic mineral SC (6%). The area weighted average EP SOC density of hy- dromorphic soils exceeds the rate of automorphic soils by 1.8 times (Table 4). Although the EP thickness of forest soils is significantly smaller than in arable soils, another important influencing factor — the SOC concen- trations of forest soils — is generally higher, and conse- quently, the SOC stocks in EP and SC may be approxi- mately similar in forest and arable soils [17,18]. 3.4. Comparative Analysis of Soils’ Humus Status Although some aspects of soil humus status peculiarities were explained on the basis of data given in Tables 2 and 3, more comprehensive humus data are presented in Table 5. For characterization of soils’ humus status dif- ferences in connection with land use, the adequate sets were formed separately from forest and arable soils for auto- and hydromorphic soils. The same schema was used for comparative analysis in the humus status of cal- careous and non-calcareous soils. The humus status dif- ferences between auto- and hydromorphic soils are given in the last section of Table 5. Using formula (1) also allows easy determination of the average (weighted by profile number) SS humus status parameters (thickness and SOC stock). The mean data in Table 5 are weighted by the number of profiles, which are slightly different from the area weighted means (Table 4). Only the area weighted means were used for modelling and as bench- marks. But by profile number weighted means are more convenient in explaining influences of land use change, moisture conditions and soil calcareousness on SOC- retaining capacity. 4. Discussion 4.1. Pedo-Ecological Regularities of SOC Sequestration The generalized area weighted SOC stock density’ means of SC, EP and SS may be taken as benchmarks (standards, model contents) in comparative analysis of the SOC retention capacities of different land covers. The SOC-retaining capacity of soil depends on soil type characteristics (EP thickness, moisture regime, texture and carbonate content) and soil management. Smoothed and interpolated by soil types and land use on the back- ground of Estonian postlithogenic mineral soil matrices, the isolines of SOC densities and concentrations may be taken as preliminary humus status parameter standards for different soil types [17,18]. Another aspect in analyses of SOC density levels is treating them according to their primary determining SOC densities properties. For example, a high role in determination of SC SOC stocks belongs to the EP thickness (Figure 1(a)). A good correlation (r = –0.63, n = 283, p < 0.001) exists between SOC stocks and cation exchange capacity (CEC, kmol ha–1) of the EP (Figure 1(c)). SOC stocks of SC depend not so much on SC depth, as on SS texture, which is expressed by the index of specific surface area (Figures 1(b) and 1(d)). Copyright © 2010 SciRes. IJG 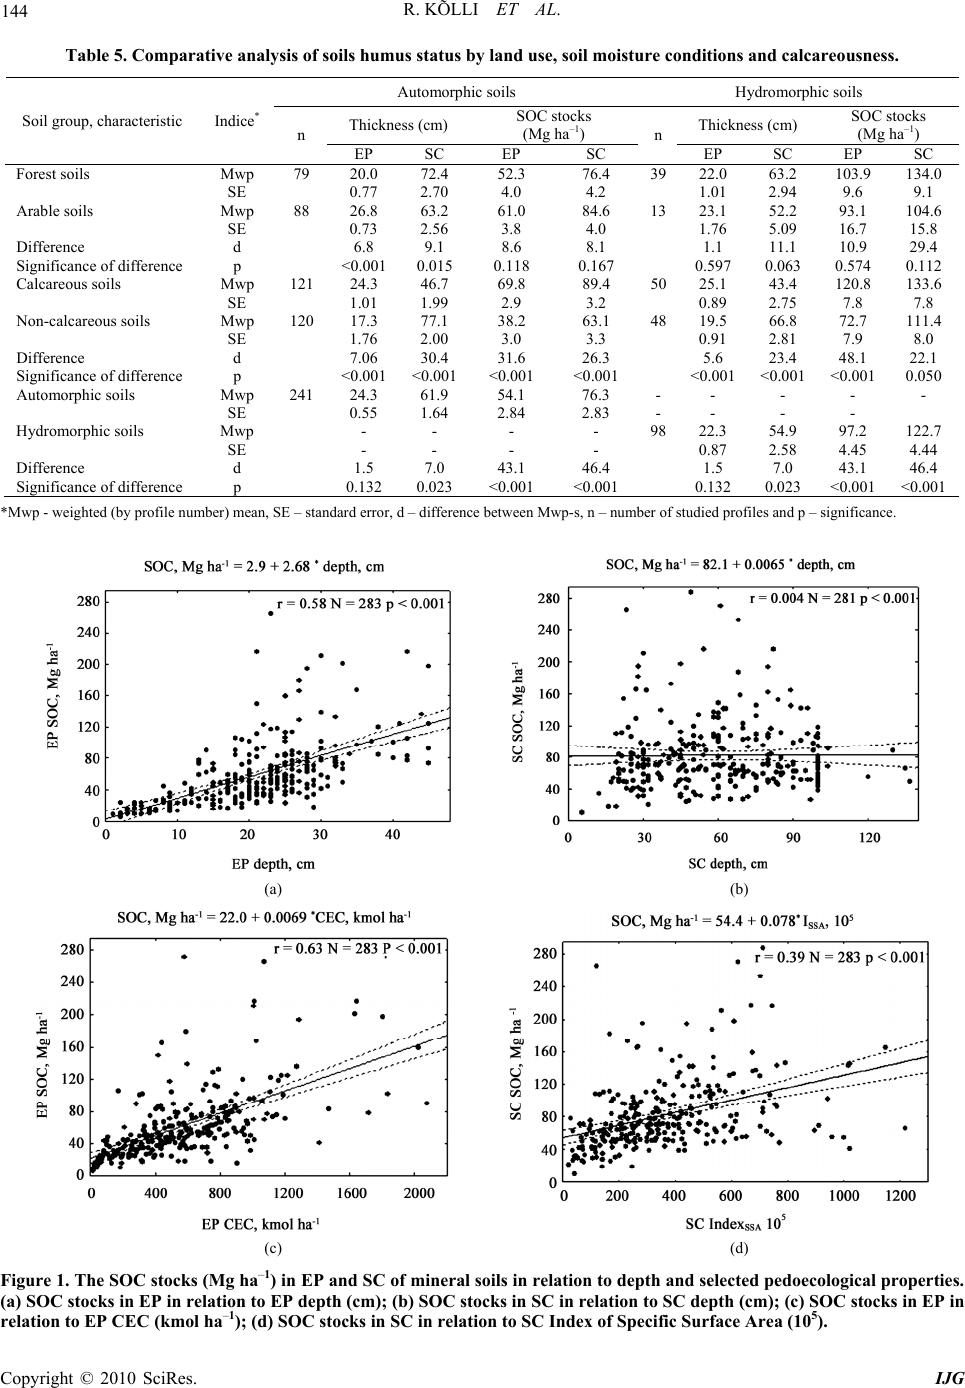 R. KÕLLI ET AL. Copyright © 2010 SciRes. IJG 144 Table 5. Comparative analysis of soils humus status by land use, soil moisture conditions and calcare o usne ss. Automorphic soils Hydromorphic soils Thickness (cm) SOC stocks (Mg ha–1) Thickness (cm) SOC stocks (Mg ha–1) Soil group, characteristic Indice* n EP SC EP SC n EP SC EP SC Forest soils Mwp 79 20.0 72.4 52.3 76.4 3922.0 63.2 103.9 134.0 SE 0.77 2.70 4.0 4.2 1.01 2.94 9.6 9.1 Arable soils Mwp 88 26.8 63.2 61.0 84.6 1323.1 52.2 93.1 104.6 SE 0.73 2.56 3.8 4.0 1.76 5.09 16.7 15.8 Difference d 6.8 9.1 8.6 8.1 1.1 11.1 10.9 29.4 Significance of difference p <0.0010.015 0.118 0.167 0.597 0.063 0.574 0.112 Calcareous soils Mwp 121 24.3 46.7 69.8 89.4 5025.1 43.4 120.8 133.6 SE 1.01 1.99 2.9 3.2 0.89 2.75 7.8 7.8 Non-calcareous soils Mwp 120 17.3 77.1 38.2 63.1 4819.5 66.8 72.7 111.4 SE 1.76 2.00 3.0 3.3 0.91 2.81 7.9 8.0 Difference d 7.06 30.4 31.6 26.3 5.6 23.4 48.1 22.1 Significance of difference p <0.001<0.001<0.001 <0.001 <0.001 <0.001 <0.0010.050 Automorphic soils Mwp 241 24.3 61.9 54.1 76.3 - - - - - SE 0.55 1.64 2.84 2.83 - - - - Hydromorphic soils Mwp - - - - 9822.3 54.9 97.2 122.7 SE - - - - 0.87 2.58 4.45 4.44 Difference d 1.5 7.0 43.1 46.4 1.5 7.0 43.1 46.4 Significance of difference p 0.132 0.023 <0.001 <0.001 0.132 0.023 <0.001<0.001 *Mwp - weighted (by profile number) mean, SE – standard error, d – difference between Mwp-s, n – number of studied profiles and p – significance. (a) (b) (c) (d) Figure 1. The SOC stocks (Mg ha–1) in EP and SC of mineral soils in relation to depth and selected pedoec ological propertie s. (a) SOC stocks in EP in relation to EP depth (cm); (b) SOC stocks in SC in relation to SC depth (cm); (c) SOC stocks in EP in relation to EP CEC (kmol ha–1); (d) SOC stocks in SC in relation to SC Index of Specific Surface Are a (105). 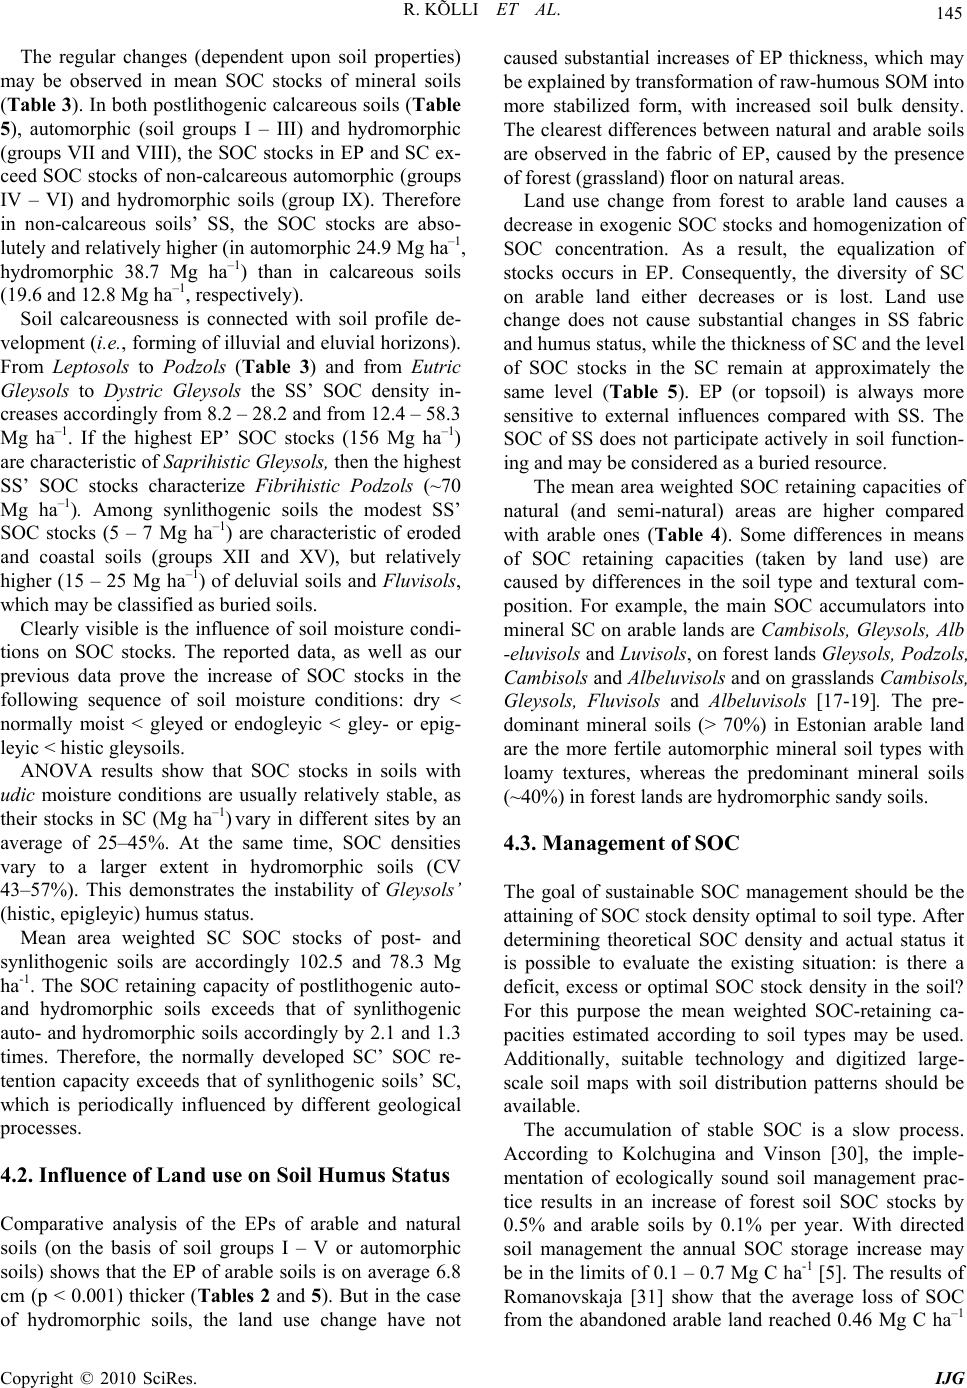 R. KÕLLI ET AL. Copyright © 2010 SciRes. IJG 145 The regular changes (dependent upon soil properties) may be observed in mean SOC stocks of mineral soils (Table 3). In both postlithogenic calcareous soils (Table 5), automorphic (soil groups I – III) and hydromorphic (groups VII and VIII), the SOC stocks in EP and SC ex- ceed SOC stocks of non-calcareous automorphic (groups IV – VI) and hydromorphic soils (group IX). Therefore in non-calcareous soils’ SS, the SOC stocks are abso- lutely and relatively higher (in automorphic 24.9 Mg ha–1, hydromorphic 38.7 Mg ha–1) than in calcareous soils (19.6 and 12.8 Mg ha–1, respectively). Soil calcareousness is connected with soil profile de- velopment (i.e., forming of illuvial and eluvial horizons). From Leptosols to Podzols (Table 3) and from Eutric Gleysols to Dystric Gleysols the SS’ SOC density in- creases accordingly from 8.2 – 28.2 and from 12.4 – 58.3 Mg ha–1. If the highest EP’ SOC stocks (156 Mg ha–1) are characteristic of Saprihistic Gleysols, then the highest SS’ SOC stocks characterize Fibrihistic Podzols (~70 Mg ha–1). Among synlithogenic soils the modest SS’ SOC stocks (5 – 7 Mg ha–1) are characteristic of eroded and coastal soils (groups XII and XV), but relatively higher (15 – 25 Mg ha–1) of deluvial soils and Fluvisols, which may be classified as buried soils. Clearly visible is the influence of soil moisture condi- tions on SOC stocks. The reported data, as well as our previous data prove the increase of SOC stocks in the following sequence of soil moisture conditions: dry < normally moist < gleyed or endogleyic < gley- or epig- leyic < histic gleysoils. ANOVA results show that SOC stocks in soils with udic moisture conditions are usually relatively stable, as their stocks in SC (Mg ha–1) vary in different sites by an average of 25–45%. At the same time, SOC densities vary to a larger extent in hydromorphic soils (CV 43–57%). This demonstrates the instability of Gleysols’ (histic, epigleyic) humus status. Mean area weighted SC SOC stocks of post- and synlithogenic soils are accordingly 102.5 and 78.3 Mg ha-1. The SOC retaining capacity of postlithogenic auto- and hydromorphic soils exceeds that of synlithogenic auto- and hydromorphic soils accordingly by 2.1 and 1.3 times. Therefore, the normally developed SC’ SOC re- tention capacity exceeds that of synlithogenic soils’ SC, which is periodically influenced by different geological processes. 4.2. Influence of Land use on Soil Humus Status Comparative analysis of the EPs of arable and natural soils (on the basis of soil groups I – V or automorphic soils) shows that the EP of arable soils is on average 6.8 cm (p < 0.001) thicker (Tables 2 and 5). But in the case of hydromorphic soils, the land use change have not caused substantial increases of EP thickness, which may be explained by transformation of raw-humous SOM into more stabilized form, with increased soil bulk density. The clearest differences between natural and arable soils are observed in the fabric of EP, caused by the presence of forest (grassland) floor on natural areas. Land use change from forest to arable land causes a decrease in exogenic SOC stocks and homogenization of SOC concentration. As a result, the equalization of stocks occurs in EP. Consequently, the diversity of SC on arable land either decreases or is lost. Land use change does not cause substantial changes in SS fabric and humus status, while the thickness of SC and the level of SOC stocks in the SC remain at approximately the same level (Table 5). EP (or topsoil) is always more sensitive to external influences compared with SS. The SOC of SS does not participate actively in soil function- ing and may be considered as a buried resource. The mean area weighted SOC retaining capacities of natural (and semi-natural) areas are higher compared with arable ones (Table 4). Some differences in means of SOC retaining capacities (taken by land use) are caused by differences in the soil type and textural com- position. For example, the main SOC accumulators into mineral SC on arable lands are Cambisols, Gleysols, Alb -eluvisols and Luvisols, on forest lands Gleysols, Podzols, Cambisols and Albe luvisols and on grasslands Cambisols, Gleysols, Fluvisols and Albeluvisols [17-19]. The pre- dominant mineral soils (> 70%) in Estonian arable land are the more fertile automorphic mineral soil types with loamy textures, whereas the predominant mineral soils (~40%) in forest lands are hydromorphic sandy soils. 4.3. Management of SOC The goal of sustainable SOC management should be the attaining of SOC stock density optimal to soil type. After determining theoretical SOC density and actual status it is possible to evaluate the existing situation: is there a deficit, excess or optimal SOC stock density in the soil? For this purpose the mean weighted SOC-retaining ca- pacities estimated according to soil types may be used. Additionally, suitable technology and digitized large- scale soil maps with soil distribution patterns should be available. The accumulation of stable SOC is a slow process. According to Kolchugina and Vinson [30], the imple- mentation of ecologically sound soil management prac- tice results in an increase of forest soil SOC stocks by 0.5% and arable soils by 0.1% per year. With directed soil management the annual SOC storage increase may be in the limits of 0.1 – 0.7 Mg C ha-1 [5]. The results of Romanovskaja [31] show that the average loss of SOC from the abandoned arable land reached 0.46 Mg C ha–1  146 R. KÕLLI ET AL. yr–1, but the increase of SOC storages after seven years was expected. The great SOC stocks losses in the first years after a change from forest to arable land use are also reported by other researchers [5,32]. One possible reason may be the greater share of potentially mineraliz- able SOM in forest soils. According to Semenov et al. [32] the share of easily mineralizable SOM in sod-podzolic forest and arable soils forms, respectively, 6.0% and 3.2% of total SOM. The turnover period of EP organic carbon is much shorter than in SS and is controllable with soil manage- ment, primarily on arable lands. For ecologically-based soil management the identification of soil EP type is es- sential. The best EP of Estonian arable soils belongs to the neutral mild type. The main constraints of arable EPs may be high acidity, low humus content, low biological activity, unsuitable mineral composition, the raw-hu- mous fabric and unfavourable moisture conditions. These factors, limiting SOC turnover and the level of produc- tivity constraints, may be regulated by improving SOC management. The means for controlling or conversion of EPs into good productive status are soil drainage, liming, equilibrated fertilization and periodic input of new or- ganic matter. Our previous research indicates that with the transformation of forest soils with good productive EP properties (fresh-moist-wet mull and moder) into arable ones, the neutral mild (from mull) and eluvic low-humous (from moder) EP types are formed [17,20]. One possibility of embedding additional carbon (or atmospheric CO2) into the soil is to increase soil produc- tivity, which subsequently causes SOC stock increases in soil horizons [33,34]. Another opportunity is deep ploughing, which displaces the rich SOC layer mechani- cally into SS (less active layers) protecting SOC from decomposition and ensuring its prolonged persistence. The optimization of soil humus status should be soil type-specific and arranged in a step-by-step approach, to increase both soil productivity and the annual inflow of new organic matter into the soil. Though SOC densities in hydromorphic soils are quite high, their quality is low, due to low humus quality. The humus of hydromorphic soils is unstable, chemically unsaturated and weakly condensed [20,35]. Therefore Gleysols should be managed very carefully, especially during preparation for cultivation. There is a risk of los- ing a large part of SC’ SOC, which is weakly bound to soil mineral particles. The reversion of low-fertility ar- able lands to grasslands and their latest afforestation may lead to additional sequestration of atmospheric CO2 [36]. 4.4. Comparing SOC Stocks Densities of Estonian Soils with Soils of other Regions Comparison of SOC stocks of Estonian SC with other regions of the world [13,37] reveals the characteristics of the Nordic area: SC is relatively thin and poor in humus. Robert [11] assigns a value of 98 – 102 Mg ha–1 for the mean SOC stocks of 0.3 m soil layer in a boreal area, which corresponds with our mineral soils weighted av- erage of EP (Table 4). The average SOC density of the forest soils 0.3 m layer in Russia equals 81 and for the 1 m layer 114 Mg ha–1; the same parameters for the entire country are accordingly 101 and 180 Mg ha–1 [16]. Bat- jes [38] reported for Central and Eastern Europe Pod- zoluvisols, Cambisols and Gleysols 0.3 m layer mean SOC densities, respectively, of 49, 69 and 114 Mg ha–1. Lal et al. [8] provided 116 Mg ha–1 as the mean SOC stock for grassland ecosystems, which is very similar to the EP density of our lowland mineral soils. Soils with aquic water conditions in the north-western USA tend, according to Kern et al. [14], to be similar to the SOC stocks of Estonian Gleysols (varying from 90 – 190 Mg ha–1). Puzachenko et al. [15] estimated the global pool of SOC to be 1,347 Pg, from which it has been concluded that the mean SOC global density equals 109.5 Mg ha–1. 5. Conclusions 1) SOC retaining capacities of EP and SC as a whole are soil type-specific. The average humus status indices of soil types (EP and SC thickness and SOC stocks) may be used as benchmarks in sustainable SOC management. 2) Land use and land use changes primarily influence the properties and fabric of the EP. In the humus status (SOC concentration and stock, fabric of horizons) of SS, the differences between native soil and cultivated soil of the same type are practically absent. 3) The mean mineral soils SOC stocks, EP quality and SOC distribution in soil profile depend mainly on water regime, mineral composition (texture and calcareous- ness), development of eluvial processes and peculiarities of land use. 4) The aggregate of SOC retained in the mineral soils of Estonia (3,235,100 ha) amounts to 323 ± 46 Tg. Ap- proximately 42% of this is sequestered into stabilized humus, 40% into instable raw-humous material and 18% into forest (grassland) floor and shallow peat layers. Some 75% of the total SOC stock is situated in biologi- cally active EP and 25% in SS, characterized by long SOC turnover periods. 6. Acknowledgements Funding for the research was provided by the Estonian Ministry of Education and Research (Project No. 0172613AGML03). Copyright © 2010 SciRes. IJG  R. KÕLLI ET AL. 147 7. References [1] M. M. Pulleman, J. Bouma, E. A. van Essen and E. W. Meijels, “Soil Organic Matter Content as a Function of Different Land Use History,” Soil Science Society of America Journal, Vol. 64, 2000, pp. 689-693. [2] P. Smith, D. S. Powlson, M. J. Glendining and J. U. Smith, “Opportunities and Limitations for C Sequestra- tion in European Agricultural Soils through Changes in Management,” In: R. Lal, J. M. Kimble, R. F. Follett and B. A. Stewart, Eds., Management of Carbon Sequestra- tion in Soil, CRC Press, Boca Raton, 1998, pp. 143-152. [3] T. O. West and W. M. Post, “Soil Organic Carbon Se- questration Rates by Tillage and Crop Rotation: A Global Data Analysis,” Soil Science Society of America Journal, Vol. 66, 2002, pp. 1930-1946. [4] W. F. DeBusk, J. R. White and K. R. Reddy, “Carbon and Nitrogen Dynamics in Wetland Soils,” In: M. J. Shaffer, L. Ma and S. Hansen, Eds., Modeling Carbon and Nitro- gen Dynamics for Soil Management, Lewis Publishers, Boca Raton, 2001, pp. 27-53. [5] K. Paustian, H. P. Collins and E. A. Paul, “Management Controls on Soil Carbon,” In: E. A. Paul, K. Paustian, E. T. Elliott and C. V. Cole, Eds., Soil Organic Matter in Temperate Agroecosystems Long-Term Experiments in North America, CRC Press, Boca Raton, 1997, pp. 15-49. [6] M. Körchens, A. Weigel and E. Shulz, “Turnover of Soil Organic Matter (SOM) and Long-Term Balances – Tools for Evaluating Sustainable Productivity of Soils,” Z. Pflanzenernäh. Bodenk., Vol. 161, 1998, pp. 409-424. [7] E. Y. Yakimenko, “Soil Comparative Evolution under Grasslands and Woodlands in the Forest Zone of Russia,” In: R. Lal, J. M. Kimble, R. F. Follett and B. A. Stewart, Eds., Management of Carbon Sequestration in Soil, CRC Press, Boca Raton, 1998, pp. 391-404. [8] R. Lal, J. Kimble and R. Follett, “Land Use and Soil C Pools in Terrestrial Ecosystems,” In: R. Lal, J. M. Kimble, R. F. Follett and B. A. Stewart, Eds., Management of Carbon Sequestration in Soil, CRC Press, Boca Raton, 1998, pp. 1-10. [9] H. J. Percival, R. L. Parfitt and N. A. Scott, “Factors Controlling Soil Carbon Levels in New Zealand Grass- lands: Is Clay Content Important?” Soil Science Society of America Journal, Vol. 64, 2000, pp. 1623-1630. [10] T. Kätterer, O. Andren and J. Persson, “The Impact of Altered Management on Long-Term Agricultural Carbon Stocks – A Swedish Case Study,” Nutrient Cycling in Agroecosystems, Vol. 70, 2004, pp. 179-187. [11] M. Robert, “Soil Carbon Sequestration for Improved Land Management,” World Soil Resources Reports 96, FAO, Rome, 2001. [12] B. K. Sitaula, R. M. Bajracharya, B. R. Singh and B. Solberg, “Factors Affecting Organic Carbon Dynamics in Soils of Nepal/Himalayan Region – A Review and Analysis,” Nutrient Cycling in Agroecosystems, Vol. 70, 2004, pp. 215-229. [13] H. Eswaran, E. V. D. Berg and P. Reich, “Organic Car- bon in Soils of the World,” Soil Science Society of Amer- ica Journal, Vol. 57, 1993, pp. 192-194. [14] J. S. Kern, D. P. Turner and R. F. Dodson, “Spatial Pat- terns of Soil Organic Carbon Pool Size in the Northwest- ern United States,” In: R. Lal, J. M. Kimble, R. F. Follett and B. A. Stewart, Eds., Soil Processes and the Carbon Cycle, CRC Press, Boca Raton, 1998, pp. 29-43. [15] Yu. G. Puzachenko, D. N. Kozlov, E. V. Siunova and A. G. Sankovskii, “Assessment of the Reserves of Organic Matter in the World’s Soils: Methodology and Results,” Eurasian Soil Science, Vol. 39, No. 12, 2006, pp. 1284-1296. [16] V. Stolbovoi, “Soil Carbon in the Forests of Russia,” In: Mitigation and Adaptation Strategies for Global Changes, Vol. 11, 2006, pp. 203-222. [17] R. Kõlli and O. Ellermäe, “Humus Status of Postlitho- genic Arable Mineral Soils,” Agronomy Research, Vol. 1, No. 2, 2003, pp. 161-174. [18] R. Kõlli, E. Asi and T. Köster, “Organic Carbon Pools in Estonian Forest Soils,” Baltic Forestry, Vol. 10, No. 18, 2004, pp. 19-26. [19] R. Kõlli, T. Köster and K. Kauer, “Organic Matter of Estonian Grassland Soils,” Agronomy Research, Vol. 5, No. 2, 2007, pp. 109-122. [20] R. K. Kõlli, “Production and Ecological Characteristics of Organic Matter of Forest Soils,” Eurasian Soil Science, Vol. 24, No. 6, 1992, pp. 78-91. [21] L. A. Vorobyova, “Khimitcheskii analiz potchv,” Mos- cow University Press, Moscow, 1998. [22] R. Kokk, “Distribution and Properties of Soils,” In: A. Raukas, Ed., Estonia: Nature, Valgus, Tallinn, 1995. pp. 430-439. [23] FAO, ISRIC and ISSS, “World Reference Base for Soil Resources,” World Soil Resources Reports 84, Rome, 1998. [24] K. Kivi, “Agro-Climate Resources of Estonian SSR,” Valgus, Tallinn, 1976. [25] Soil Survey Staff, “Keys to Soil Taxonomy,” 8th Edition, USDA, NRCS, 1998. [26] V. M. Fridland, “Main Principles and Elements of Basic Soil Classification and Program for Development,” AUAAS, Moscow, 1982. [27] L. Reintam, “Soil Formation,” In: A. Raukas and A. Teedumäe, Eds., Geology and Mineral Resources of Es- tonia, EAP, Tallinn, 1997, pp. 298-306. [28] Statistical Office of Estonia, “Environment 2006,” Tal- linn, 2007. [29] A. Meiner, “Land Cover of Estonia. Implementation of CORINE Land Cover Project in Estonia,” EEIC, Tallinn, 1999. [30] T. P. Kolchugina and T. S. Vinson, “Carbon Cycle of Terrestrial Ecosystems of the Former Soviet Union,” En- vironmental Science and Policy, Vol. 1, 1998, pp. 115-128. [31] A. A. Romanovskaya, “Organic Carbon in Long-Fallow Lands of Russia,” Eurasian Soil Science, Vol. 39, No. 1, Copyright © 2010 SciRes. IJG  R. KÕLLI ET AL. Copyright © 2010 SciRes. IJG 148 2006, pp. 44-52. [32] V. M. Semenov, L. A. Ivannikova, T. V. Kuznetsova, N. A. Semenova and A. S. Tulina, ”Mineralization of Or- ganic Matter and the Carbon Sequestration Capacity of Zonal Soils,” Eurasian Soil Science, Vol. 41, No. 7, 2008, pp. 717-730. [33] A. D. Halvorson, B. J. Wienhold and A. Black, “Tillage, Nitrogen, and Cropping System Effects on Soil Carbon Sequestration,” Soil Science Society of America Journal, Vol. 66, 2002, pp. 906-912. [34] R. A. Rosell and J. A. Galantini, “Soil Organic Carbon Dynamics in Native and Cultivated Ecosystems of South America,” In: R. Lal, J. M. Kimble, R. F. Follett and B. A. Stewart, Eds., Management of Carbon Sequestration in Soil, CRC Press, Boca Raton, 1998, pp. 11-33. [35] L. Reintam, “Humus Relationship as a Representation of Soil Resilience in Extensive Agriculture,” In: Energy, Environment and Natural Resources Management in the Baltic Sea Region, 4th International Conference on Sys- tem Analysis, Tallinn, Estonia, May 18-21, 1993, Copen- hagen, 1993, pp. 409-415. [36] I. N. Kurganova, A. M. Yermolaev, V. O. Lopes de Gerenyu, A. A. Larionova, Ya. Kuzyakov, T. Keller and S. Lange, “Carbon Balance in the Soils of Abandoned Lands in Moscow Region,” Eurasian Soil Science, Vol. 40, No. 1, 2007, pp. 51-58. [37] E. Rusco, R. Jones and G. Bidoglio, “Organic Matter in the Soils of Europe: Present Status and Future Trends,” ESB, IES, JRC, Ispra, 2001. [38] H. Batjes, “Carbon and Nitrogen Stocks in the Soils of Central and Eastern Europe,” Soil Use and Management, Vol. 18, 2002, pp. 324-329. |

