 International Journal of Geosciences, 2010, 1, 102-112 doi:10.4236/ijg.2010.13014 Published Online November 2010 (http://www.SciRP.org/journal/ijg) Copyright © 2010 SciRes. IJG Warming Power of CO2 and H2O: Correlations with Temperatur e Changes Paulo Cesar Soares Earth Sciences, Federal University of Parana (UFPR), Curitiba, Brazil E-mail: p_soares@terra.com.br Received July 29, 2010; revised September 13, 2010; accepted September 30, 2010 Abstract The dramatic and threatening environmental changes announced for the next decades are the result of models whose main drive factor of climatic changes is the increasing carbon dioxide in the atmosphere. Although taken as a premise, the hypothesis does not have verifiable consistence. The comparison of temperature changes and CO2 changes in the atmosphere is made for a large diversity of conditions, with the same data used to model climate changes. Correlation of historical series of data is the main approach. CO2 changes are closely related to temperature. Warmer seasons or triennial phases are followed by an atmosphere that is rich in CO2, reflecting the gas solving or exsolving from water, and not photosynthesis activity. Interannual cor- relations between the variables are good. A weak dominance of temperature changes precedence, relative to CO2 changes, indicate that the main effect is the CO2 increase in the atmosphere due to temperature rising. Decreasing temperature is not followed by CO2 decrease, which indicates a different route for the CO2 cap- ture by the oceans, not by gas re-absorption. Monthly changes have no correspondence as would be expected if the warming was an important absorption-radiation effect of the CO2 increase. The anthropogenic wasting of fossil fuel CO2 to the atmosphere shows no relation with the temperature changes even in an annual basis. The absence of immediate relation between CO2 and temperature is evidence that rising its mix ratio in the atmosphere will not imply more absorption and time residence of energy over the Earth surface. This is ex- plained because band absorption is nearly all done with historic CO2 values. Unlike CO2, water vapor in the atmosphere is rising in tune with temperature changes, even in a monthly scale. The rising energy absorption of vapor is reducing the outcoming long wave radiation window and amplifying warming regionally and in a different way around the globe. Keywords: Global Warming, CO2, Vapor Greenhouse 1. Introduction Climatic studies have reported dramatic and threatening environmental changes mainly what is known as global warming. Many hypotheses have been proposed to ex- plain this supposed dramatic instability of the Earth cli- mate, such as changes in solar radiance, in carbon diox- ide or methane in the atmosphere, or change in ocean termohaline circulation, etc. The carbon dioxide hy- pothesis of climate warming has gained so many adepts and modelers around the world in such a way that it reaches the status of a scientific paradigm. A flooding of data, results and models became available for scientists to make past and future extrapolations and to warrant statements and recommendations for policies [1]. The original hypothesis was formulated by Chamber- lain in order to explain glacial times in Earth history by depleting CO2 from the atmosphere to the oceans, by intensive weathering in extensive exposition of conti- nental areas. For more than one century, the carbon di- oxide was suspected and neglected as the main cause of climate changes; Geochemistry and Earth history of geologic deposits and landscapes present severe restrict- tions regarding the increase of weathering and, as a con- sequence, atmosphere CO2 capture, during cold times. The ice cores recuperated in Antarctica have shown, in an astonishing way, how close is the relationship be- tween atmospheric CO2 changes and isotopic indicators of oceanic temperatures [2]. Both variables are very closely correlated but not cou- 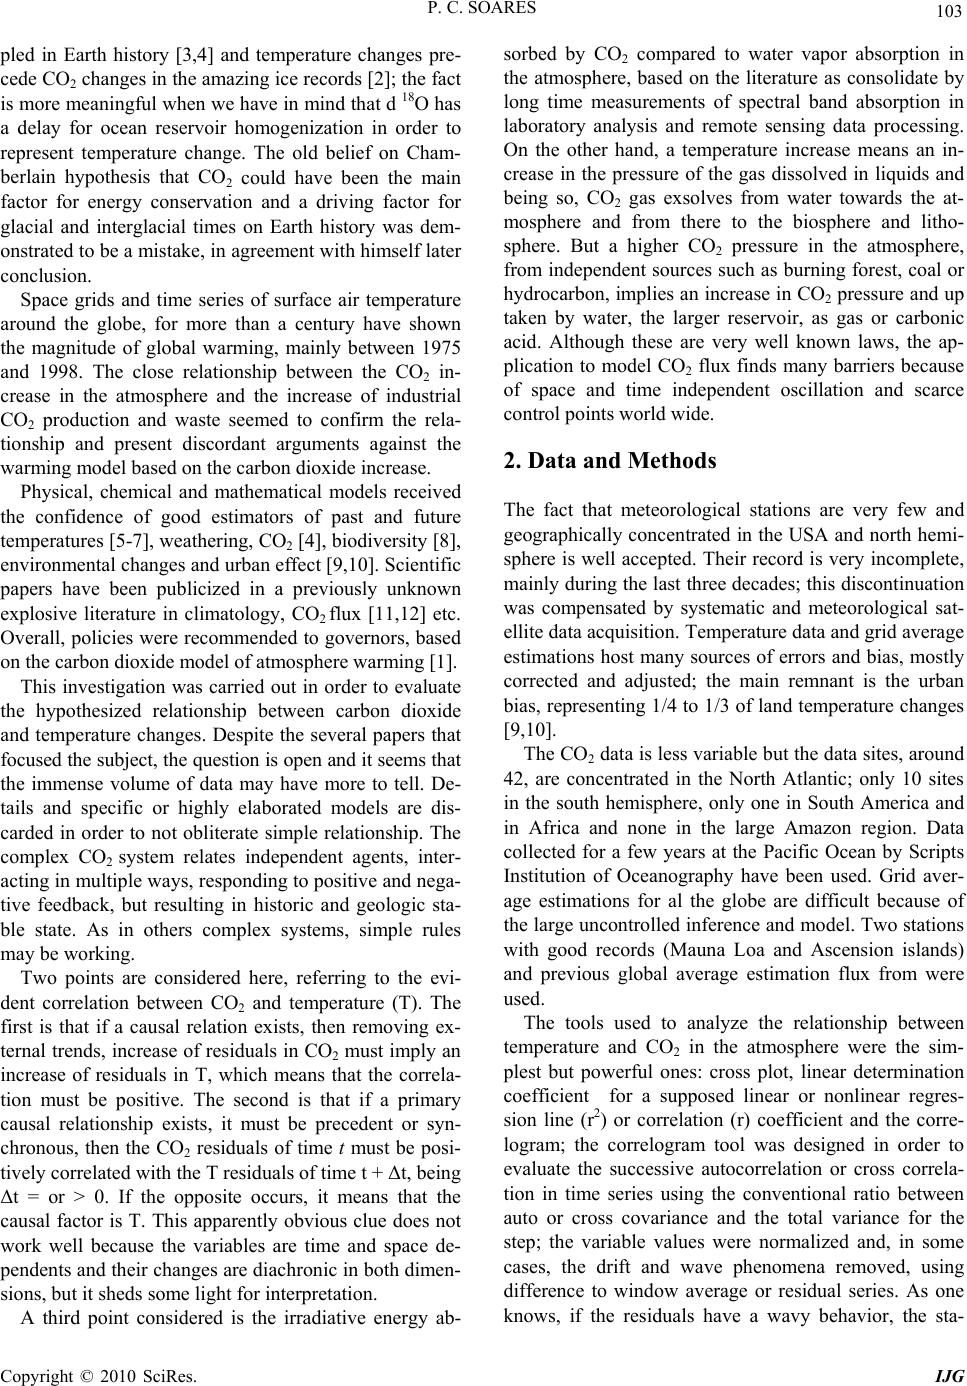 P. C. SOARES 103 pled in Earth history [3,4] and temperature changes pre- cede CO2 changes in the amazing ice records [2]; the fact is more meaningful when we have in mind that d 18O has a delay for ocean reservoir homogenization in order to represent temperature change. The old belief on Cham- berlain hypothesis that CO2 could have been the main factor for energy conservation and a driving factor for glacial and interglacial times on Earth history was dem- onstrated to be a mistake, in agreement with himself later conclusion. Space grids and time series of surface air temperature around the globe, for more than a century have shown the magnitude of global warming, mainly between 1975 and 1998. The close relationship between the CO2 in- crease in the atmosphere and the increase of industrial CO2 production and waste seemed to confirm the rela- tionship and present discordant arguments against the warming model based on the carbon dioxide increase. Physical, chemical and mathematical models received the confidence of good estimators of past and future temperatures [5-7], weathering, CO2 [4], biodiversity [8], environmental changes and urban effect [9,10]. Scientific papers have been publicized in a previously unknown explosive literature in climatology, CO2 flux [11,12] etc. Overall, policies were recommended to governors, based on the carbon dioxide model of atmosphere warming [1]. This investigation was carried out in order to evaluate the hypothesized relationship between carbon dioxide and temperature changes. Despite the several papers that focused the subject, the question is open and it seems that the immense volume of data may have more to tell. De- tails and specific or highly elaborated models are dis- carded in order to not obliterate simple relationship. The complex CO2 system relates independent agents, inter- acting in multiple ways, responding to positive and nega- tive feedback, but resulting in historic and geologic sta- ble state. As in others complex systems, simple rules may be working. Two points are considered here, referring to the evi- dent correlation between CO2 and temperature (T). The first is that if a causal relation exists, then removing ex- ternal trends, increase of residuals in CO2 must imply an increase of residuals in T, which means that the correla- tion must be positive. The second is that if a primary causal relationship exists, it must be precedent or syn- chronous, then the CO2 residuals of time t must be posi- tively correlated with the T residuals of time t + Δt, being Δt = or > 0. If the opposite occurs, it means that the causal factor is T. This apparently obvious clue does not work well because the variables are time and space de- pendents and their changes are diachronic in both dimen- sions, but it sheds some light for interpretation. A third point considered is the irradiative energy ab- sorbed by CO2 compared to water vapor absorption in the atmosphere, based on the literature as consolidate by long time measurements of spectral band absorption in laboratory analysis and remote sensing data processing. On the other hand, a temperature increase means an in- crease in the pressure of the gas dissolved in liquids and being so, CO2 gas exsolves from water towards the at- mosphere and from there to the biosphere and litho- sphere. But a higher CO2 pressure in the atmosphere, from independent sources such as burning forest, coal or hydrocarbon, implies an increase in CO2 pressure and up taken by water, the larger reservoir, as gas or carbonic acid. Although these are very well known laws, the ap- plication to model CO2 flux finds many barriers because of space and time independent oscillation and scarce control points world wide. 2. Data and Methods The fact that meteorological stations are very few and geographically concentrated in the USA and north hemi- sphere is well accepted. Their record is very incomplete, mainly during the last three decades; this discontinuation was compensated by systematic and meteorological sat- ellite data acquisition. Temperature data and grid average estimations host many sources of errors and bias, mostly corrected and adjusted; the main remnant is the urban bias, representing 1/4 to 1/3 of land temperature changes [9,10]. The CO2 data is less variable but the data sites, around 42, are concentrated in the North Atlantic; only 10 sites in the south hemisphere, only one in South America and in Africa and none in the large Amazon region. Data collected for a few years at the Pacific Ocean by Scripts Institution of Oceanography have been used. Grid aver- age estimations for al the globe are difficult because of the large uncontrolled inference and model. Two stations with good records (Mauna Loa and Ascension islands) and previous global average estimation flux from were used. The tools used to analyze the relationship between temperature and CO2 in the atmosphere were the sim- plest but powerful ones: cross plot, linear determination coefficient for a supposed linear or nonlinear regres- sion line (r2) or correlation (r) coefficient and the corre- logram; the correlogram tool was designed in order to evaluate the successive autocorrelation or cross correla- tion in time series using the conventional ratio between auto or cross covariance and the total variance for the step; the variable values were normalized and, in some cases, the drift and wave phenomena removed, using difference to window average or residual series. As one knows, if the residuals have a wavy behavior, the sta- Copyright © 2010 SciRes. IJG 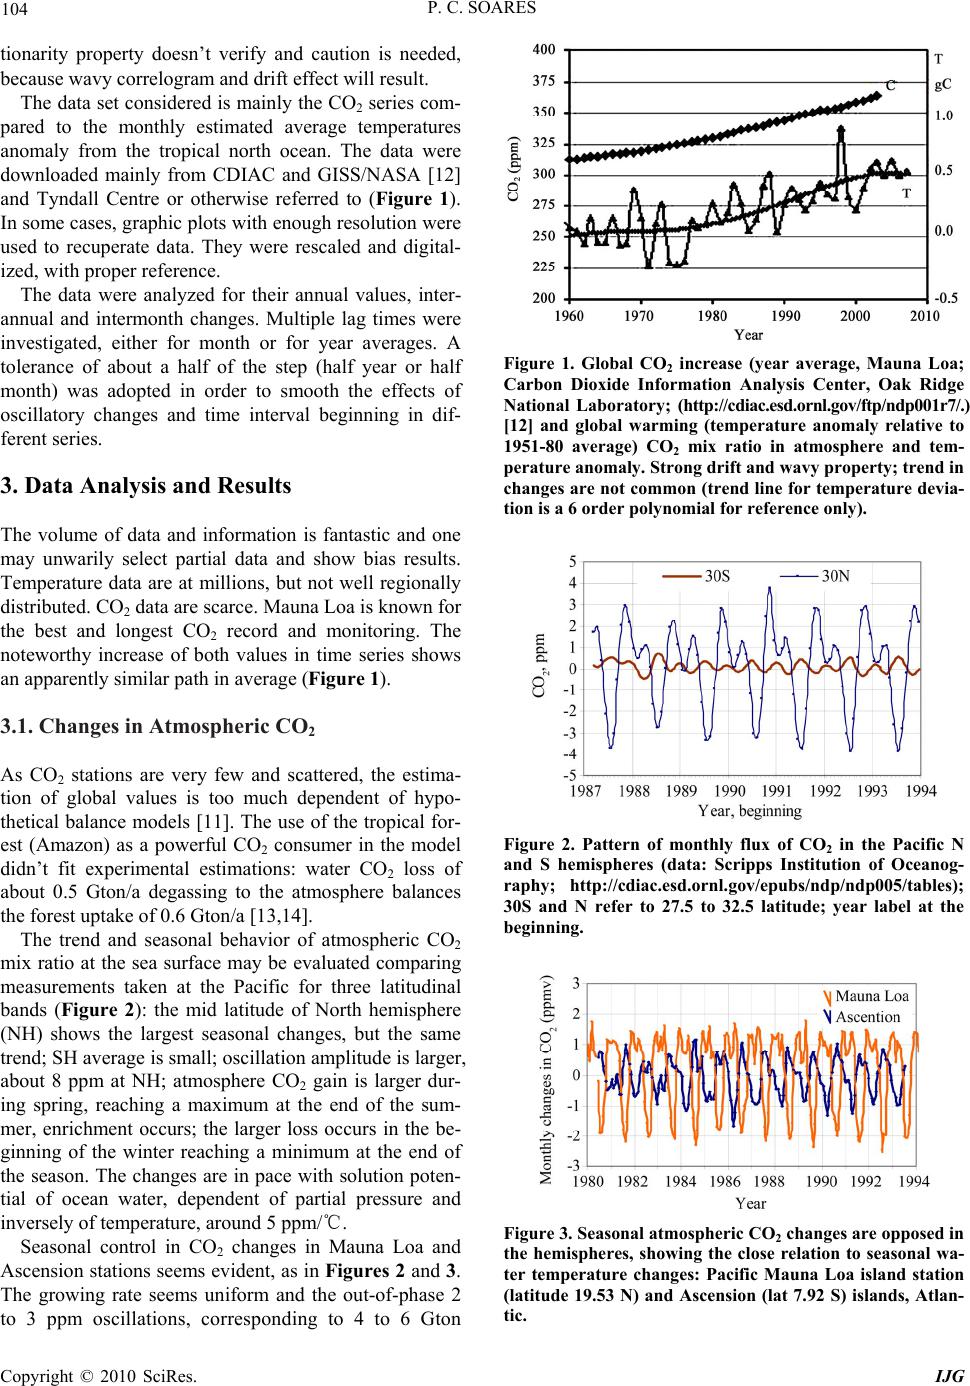 104 P. C. SOARES tionarity property doesn’t verify and caution is needed, because wavy correlogram and drift effect will result. The data set considered is mainly the CO2 series com- pared to the monthly estimated average temperatures anomaly from the tropical north ocean. The data were downloaded mainly from CDIAC and GISS/NASA [12] and Tyndall Centre or otherwise referred to (Figure 1). In some cases, graphic plots with enough resolution were used to recuperate data. They were rescaled and digital- ized, with proper reference. The data were analyzed for their annual values, inter- annual and intermonth changes. Multiple lag times were investigated, either for month or for year averages. A tolerance of about a half of the step (half year or half month) was adopted in order to smooth the effects of oscillatory changes and time interval beginning in dif- ferent series. 3. Data Analysis and Results The volume of data and information is fantastic and one may unwarily select partial data and show bias results. Temperature data are at millions, but not well regionally distributed. CO2 data are scarce. Mauna Loa is known for the best and longest CO2 record and monitoring. The noteworthy increase of both values in time series shows an apparently similar path in average (Figure 1). 3.1. Changes in Atmospheric CO2 As CO2 stations are very few and scattered, the estima- tion of global values is too much dependent of hypo- thetical balance models [11]. The use of the tropical for- est (Amazon) as a powerful CO2 consumer in the model didn’t fit experimental estimations: water CO2 loss of about 0.5 Gton/a degassing to the atmosphere balances the forest uptake of 0.6 Gton/a [13,14]. The trend and seasonal behavior of atmospheric CO2 mix ratio at the sea surface may be evaluated comparing measurements taken at the Pacific for three latitudinal bands (Figure 2): the mid latitude of North hemisphere (NH) shows the largest seasonal changes, but the same trend; SH average is small; oscillation amplitude is larger, about 8 ppm at NH; atmosphere CO2 gain is larger dur- ing spring, reaching a maximum at the end of the sum- mer, enrichment occurs; the larger loss occurs in the be- ginning of the winter reaching a minimum at the end of the season. The changes are in pace with solution poten- tial of ocean water, dependent of partial pressure and inversely of temperature, around 5 ppm/℃. Seasonal control in CO2 changes in Mauna Loa and Ascension stations seems evident, as in Figures 2 and 3. The growing rate seems uniform and the out-of-phase 2 to 3 ppm oscillations, corresponding to 4 to 6 Gton Figure 1. Global CO2 increase (year average, Mauna Loa; Carbon Dioxide Information Analysis Center, Oak Ridge National Laboratory; (http://cdiac.esd.ornl.gov/ftp/ndp001r7/.) [12] and global warming (temperature anomaly relative to 1951-80 average) CO2 mix ratio in atmosphere and tem- perature anomaly. Stro ng dr ift and wavy property; trend in changes are not common (trend line for temperature devia- tion is a 6 order polynomial for reference only). Figure 2. Pattern of monthly flux of CO2 in the Pacific N and S hemispheres (data: Scripps Institution of Oceanog- raphy; http://cdiac.esd.ornl.gov/epubs/ndp/ndp005/tables); 30S and N refer to 27.5 to 32.5 latitude; year label at the beginning. Figure 3. Seasonal atmospheric CO2 changes are opposed in the hemispheres, showing the close relation to seasonal wa- ter temperature changes: Pacific Mauna Loa island station (latitude 19.53 N) and Ascension (lat 7.92 S) islands, Atlan- tic. Copyright © 2010 SciRes. IJG 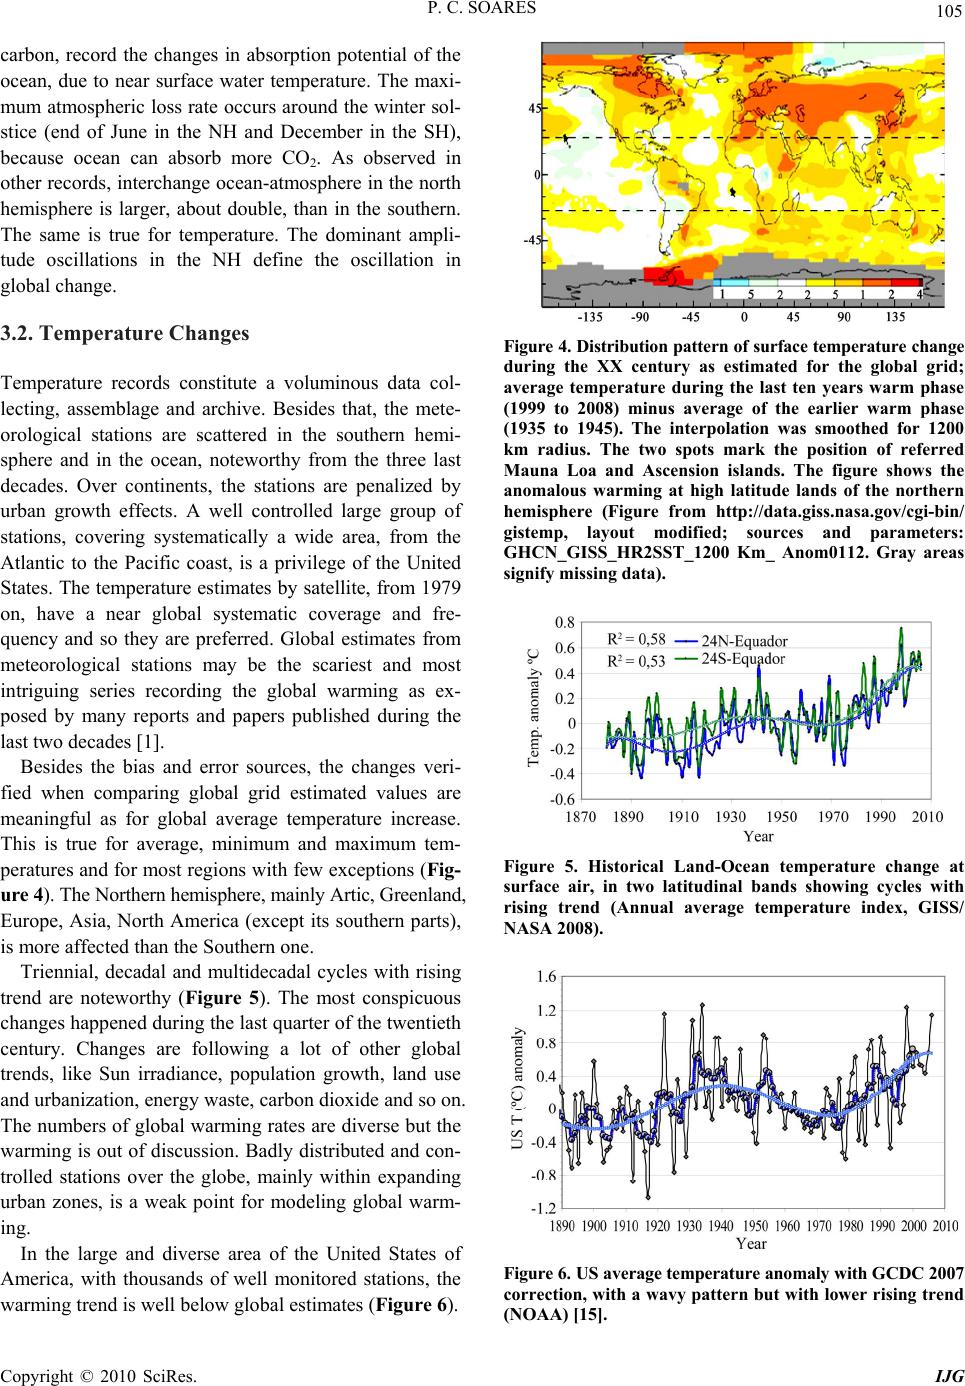 P. C. SOARES 105 carbon, record the changes in absorption potential of the ocean, due to near surface water temperature. The maxi- mum atmospheric loss rate occurs around the winter sol- stice (end of June in the NH and December in the SH), because ocean can absorb more CO2. As observed in other records, interchange ocean-atmosphere in the north hemisphere is larger, about double, than in the southern. The same is true for temperature. The dominant ampli- tude oscillations in the NH define the oscillation in global change. 3.2. Temperature Changes Temperature records constitute a voluminous data col- lecting, assemblage and archive. Besides that, the mete- orological stations are scattered in the southern hemi- sphere and in the ocean, noteworthy from the three last decades. Over continents, the stations are penalized by urban growth effects. A well controlled large group of stations, covering systematically a wide area, from the Atlantic to the Pacific coast, is a privilege of the United States. The temperature estimates by satellite, from 1979 on, have a near global systematic coverage and fre- quency and so they are preferred. Global estimates from meteorological stations may be the scariest and most intriguing series recording the global warming as ex- posed by many reports and papers published during the last two decades [1]. Besides the bias and error sources, the changes veri- fied when comparing global grid estimated values are meaningful as for global average temperature increase. This is true for average, minimum and maximum tem- peratures and for most regions with few exceptions (Fig- ure 4). The Northern hemisphere, mainly Artic, Greenland, Europe, Asia, North America (except its southern parts), is more affected than the Southern one. Triennial, decadal and multidecadal cycles with rising trend are noteworthy (Figure 5). The most conspicuous changes happened during the last quarter of the twentieth century. Changes are following a lot of other global trends, like Sun irradiance, population growth, land use and urbanization, energy waste, carbon dioxide and so on. The numbers of global warming rates are diverse but the warming is out of discussion. Badly distributed and con- trolled stations over the globe, mainly within expanding urban zones, is a weak point for modeling global warm- ing. In the large and diverse area of the United States of America, with thousands of well monitored stations, the warming trend is well below global estimates (Figure 6). Figure 4. Distribution pattern of surface temperature change during the XX century as estimated for the global grid; average temperature during the last ten years warm phase (1999 to 2008) minus average of the earlier warm phase (1935 to 1945). The interpolation was smoothed for 1200 km radius. The two spots mark the position of referred Mauna Loa and Ascension islands. The figure shows the anomalous warming at high latitude lands of the northern hemisphere (Figure from http://data.giss.nasa.gov/cgi-bin/ gistemp, layout modified; sources and parameters: GHCN_GISS_HR2SST_1200 Km_ Anom0112. Gray areas signify missing data). Figure 5. Historical Land-Ocean temperature change at surface air, in two latitudinal bands showing cycles with rising trend (Annual average temperature index, GISS/ NASA 2008). Figure 6. US average temperat ure anomaly w ith GCDC 200 7 correction, with a wavy pattern but with lower rising trend (NOAA) [15]. Copyright © 2010 SciRes. IJG 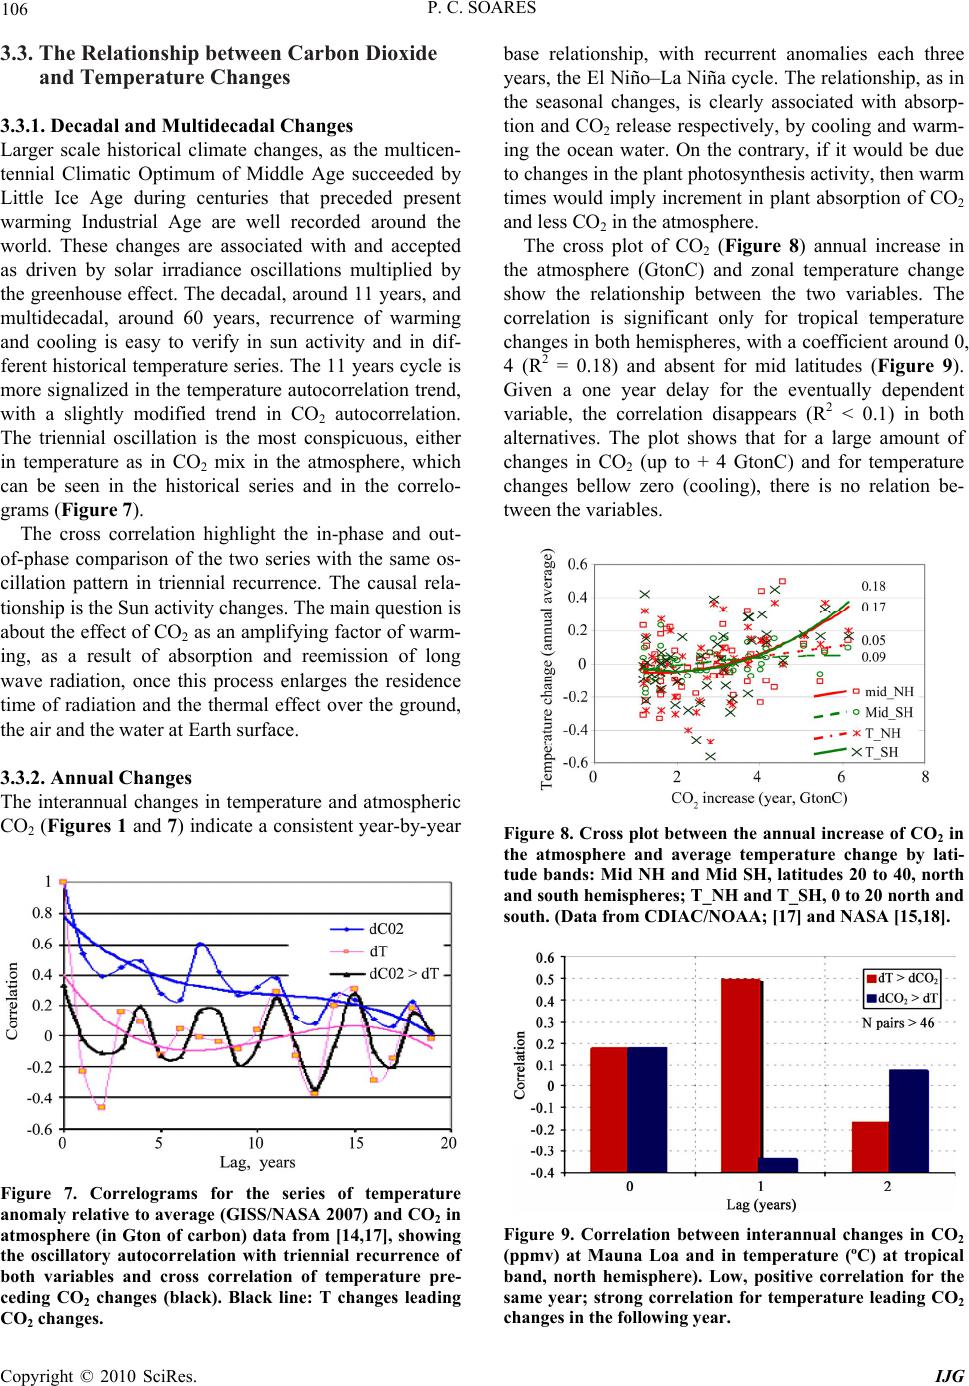 106 P. C. SOARES 3.3. The Relationship between Carbon Dioxide and Temperature Changes 3.3.1. Decad al and Mul ti decadal Changes Larger scale historical climate changes, as the multicen- tennial Climatic Optimum of Middle Age succeeded by Little Ice Age during centuries that preceded present warming Industrial Age are well recorded around the world. These changes are associated with and accepted as driven by solar irradiance oscillations multiplied by the greenhouse effect. The decadal, around 11 years, and multidecadal, around 60 years, recurrence of warming and cooling is easy to verify in sun activity and in dif- ferent historical temperature series. The 11 years cycle is more signalized in the temperature autocorrelation trend, with a slightly modified trend in CO2 autocorrelation. The triennial oscillation is the most conspicuous, either in temperature as in CO2 mix in the atmosphere, which can be seen in the historical series and in the correlo- grams (Figure 7). The cross correlation highlight the in-phase and out- of-phase comparison of the two series with the same os- cillation pattern in triennial recurrence. The causal rela- tionship is the Sun activity changes. The main question is about the effect of CO2 as an amplifying factor of warm- ing, as a result of absorption and reemission of long wave radiation, once this process enlarges the residence time of radiation and the thermal effect over the ground, the air and the water at Earth surface. 3.3.2. Annual Ch anges The interannual changes in temperature and atmospheric CO2 (Figures 1 and 7) indicate a consistent year-by-year Figure 7. Correlograms for the series of temperature anomaly relative to average (GISS/NASA 2007) and CO2 in atmosphere (in Gton of carbon) data from [14,17], showing the oscillatory autocorrelation with triennial recurrence of both variables and cross correlation of temperature pre- ceding CO2 changes (black). Black line: T changes leading CO2 changes. base relationship, with recurrent anomalies each three years, the El Niño–La Niña cycle. The relationship, as in the seasonal changes, is clearly associated with absorp- tion and CO2 release respectively, by cooling and warm- ing the ocean water. On the contrary, if it would be due to changes in the plant photosynthesis activity, then warm times would imply increment in plant absorption of CO2 and less CO2 in the atmosphere. The cross plot of CO2 (Figure 8) annual increase in the atmosphere (GtonC) and zonal temperature change show the relationship between the two variables. The correlation is significant only for tropical temperature changes in both hemispheres, with a coefficient around 0, 4 (R2 = 0.18) and absent for mid latitudes (Figure 9). Given a one year delay for the eventually dependent variable, the correlation disappears (R2 < 0.1) in both alternatives. The plot shows that for a large amount of changes in CO2 (up to + 4 GtonC) and for temperature changes bellow zero (cooling), there is no relation be- tween the variables. Figure 8. Cross plot between the annual increase of CO2 in the atmosphere and average temperature change by lati- tude bands: Mid NH and Mid SH, latitudes 20 to 40, north and south hemispheres; T_NH and T_SH, 0 to 20 north and south. (Data from CDIAC/NOAA; [17] and NASA [15,18]. Figure 9. Correlation between interannual changes in CO2 (ppmv) at Mauna Loa and in temperature (ºC) at tropical band, north hemisphere). Low, positive correlation for the same year; strong correlation for temperature leading CO2 changes in the following year. Copyright © 2010 SciRes. IJG 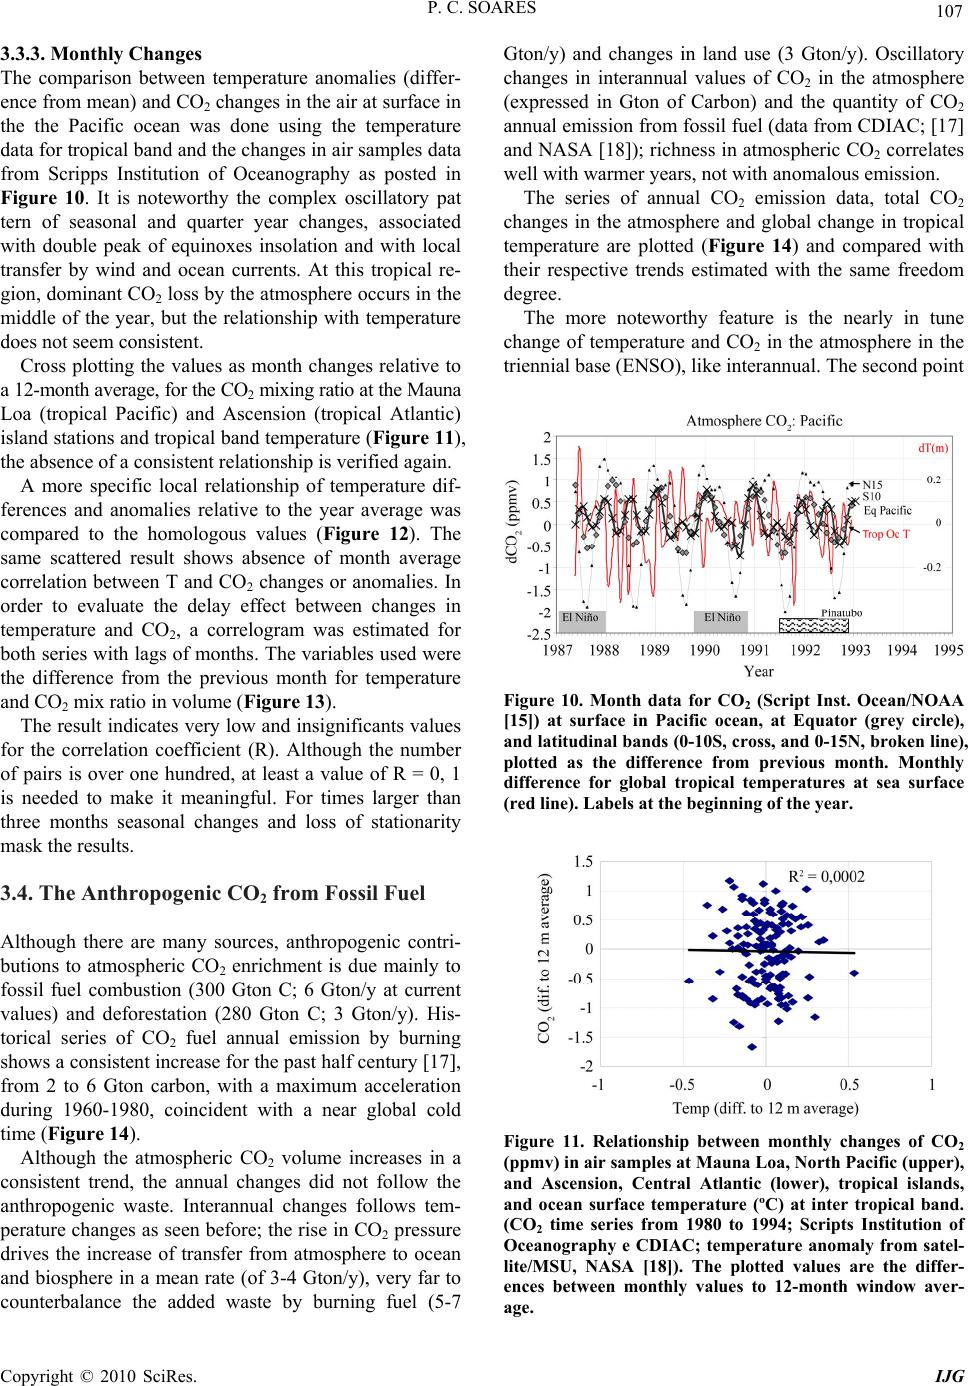 P. C. SOARES 107 3.3.3. M onthly Changes The comparison between temperature anomalies (differ- ence from mean) and CO2 changes in the air at surface in the the Pacific ocean was done using the temperature data for tropical band and the changes in air samples data from Scripps Institution of Oceanography as posted in Figure 10. It is noteworthy the complex oscillatory pat tern of seasonal and quarter year changes, associated with double peak of equinoxes insolation and with local transfer by wind and ocean currents. At this tropical re- gion, dominant CO2 loss by the atmosphere occurs in the middle of the year, but the relationship with temperature does not seem consistent. Cross plotting the values as month changes relative to a 12-month average, for the CO2 mixing ratio at the Mauna Loa (tropical Pacific) and Ascension (tropical Atlantic) island stations and tropical band temperature (Figure 11), the absence of a consistent relationship is verified again. A more specific local relationship of temperature dif- ferences and anomalies relative to the year average was compared to the homologous values (Figure 12). The same scattered result shows absence of month average correlation between T and CO2 changes or anomalies. In order to evaluate the delay effect between changes in temperature and CO2, a correlogram was estimated for both series with lags of months. The variables used were the difference from the previous month for temperature and CO2 mix ratio in volume (Figure 13). The result indicates very low and insignificants values for the correlation coefficient (R). Although the number of pairs is over one hundred, at least a value of R = 0, 1 is needed to make it meaningful. For times larger than three months seasonal changes and loss of stationarity mask the results. 3.4. The Anthropogenic CO2 from Fossil Fuel Although there are many sources, anthropogenic contri- butions to atmospheric CO2 enrichment is due mainly to fossil fuel combustion (300 Gton C; 6 Gton/y at current values) and deforestation (280 Gton C; 3 Gton/y). His- torical series of CO2 fuel annual emission by burning shows a consistent increase for the past half century [17], from 2 to 6 Gton carbon, with a maximum acceleration during 1960-1980, coincident with a near global cold time (Figure 14). Although the atmospheric CO2 volume increases in a consistent trend, the annual changes did not follow the anthropogenic waste. Interannual changes follows tem- perature changes as seen before; the rise in CO2 pressure drives the increase of transfer from atmosphere to ocean and biosphere in a mean rate (of 3-4 Gton/y), very far to counterbalance the added waste by burning fuel (5-7 Gton/y) and changes in land use (3 Gton/y). Oscillatory changes in interannual values of CO2 in the atmosphere (expressed in Gton of Carbon) and the quantity of CO2 annual emission from fossil fuel (data from CDIAC; [17] and NASA [18]); richness in atmospheric CO2 correlates well with warmer years, not with anomalous emission. The series of annual CO2 emission data, total CO2 changes in the atmosphere and global change in tropical temperature are plotted (Figure 14) and compared with their respective trends estimated with the same freedom degree. The more noteworthy feature is the nearly in tune change of temperature and CO2 in the atmosphere in the triennial base (ENSO), like interannual. The second point Figure 10. Month data for CO2 (Script Inst. Ocean/NOAA [15]) at surface in Pacific ocean, at Equator (grey circle), and latitudinal bands (0-10S, cross, and 0-15N, br oken line), plotted as the difference from previous month. Monthly difference for global tropical temperatures at sea surface (red line). Labels at the beginning of the year. Figure 11. Relationship between monthly changes of CO2 (ppmv) in air samples at Mauna Loa, North Pacific (upper), and Ascension, Central Atlantic (lower), tropical islands, and ocean surface temperature (ºC) at inter tropical band. (CO2 time series from 1980 to 1994; Scripts Institution of Oceanography e CDIAC; temperature anomaly from satel- lite/MSU, NASA [18]). The plotted values are the differ- ences between monthly values to 12-month window aver- age. Copyright © 2010 SciRes. IJG 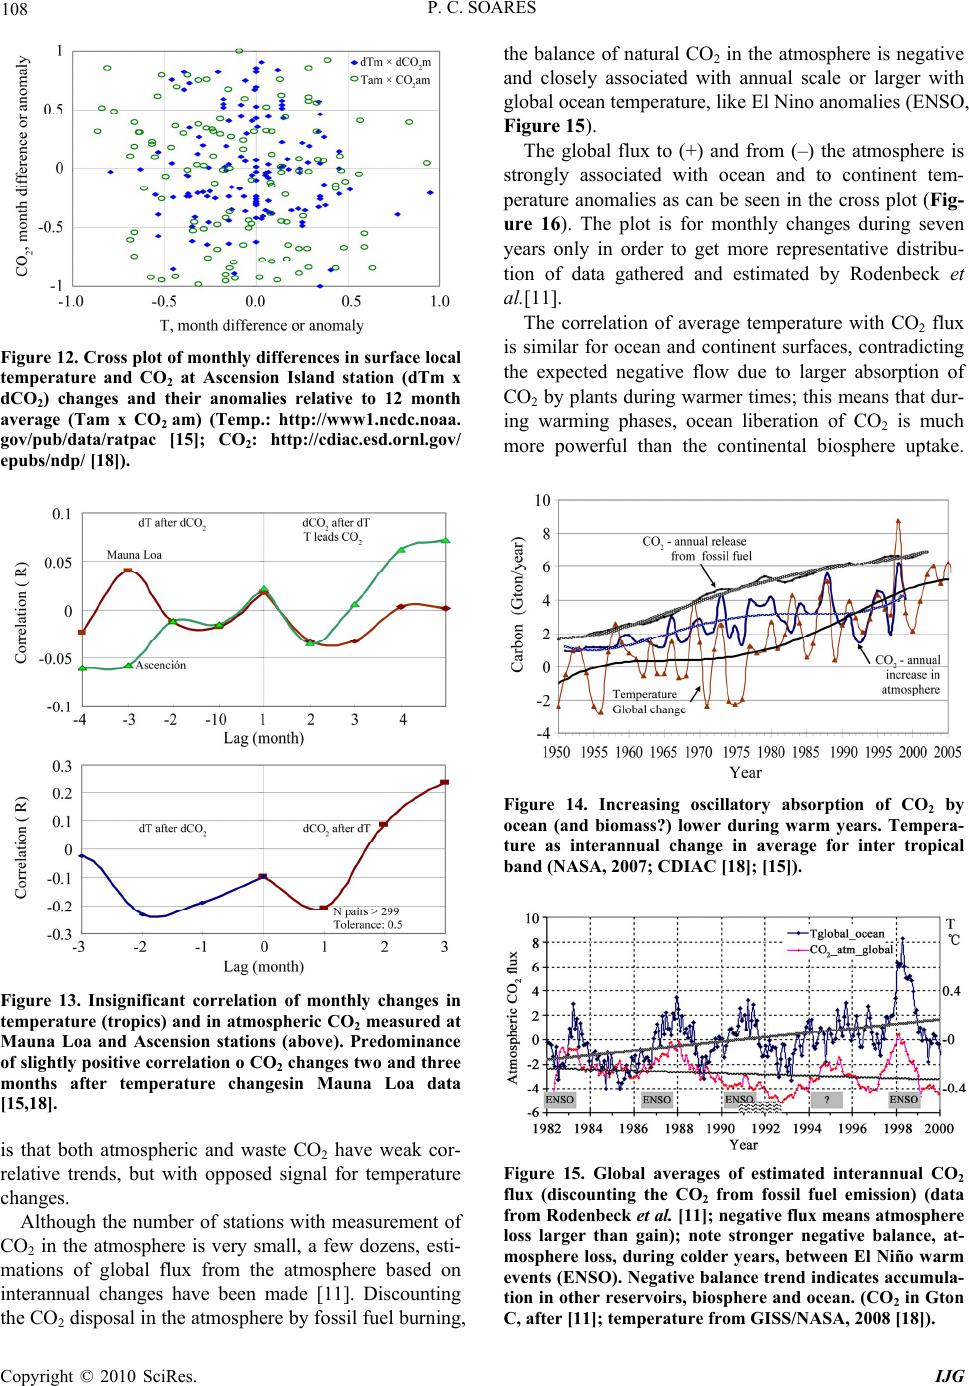 108 P. C. SOARES Figure 12. Cross plot of monthly differences in surface local temperature and CO2 at Ascension Island station (dTm x dCO2) changes and their anomalies relative to 12 month average (Tam x CO2 am) (Temp.: http://www1.ncdc.noaa. gov/pub/data/ratpac [15]; CO2: http://cdiac.esd.ornl.gov/ epubs/ndp/ [18]). Figure 13. Insignificant correlation of monthly changes in temperature (tropics) and in atmospheric CO 2 measured at Mauna Loa and Ascension stations (above). Predominance of slightly positive correlation o CO2 changes two and three months after temperature changesin Mauna Loa data [15,18]. is that both atmospheric and waste CO2 have weak cor- relative trends, but with opposed signal for temperature changes. Although the number of stations with measurement of CO2 in the atmosphere is very small, a few dozens, esti- mations of global flux from the atmosphere based on interannual changes have been made [11]. Discounting the CO2 disposal in the atmosphere by fossil fuel burning, the balance of natural CO2 in the atmosphere is negative and closely associated with annual scale or larger with global ocean temperature, like El Nino anomalies (ENSO, Figure 15). The global flux to (+) and from (–) the atmosphere is strongly associated with ocean and to continent tem- perature anomalies as can be seen in the cross plot (Fig- ure 16). The plot is for monthly changes during seven years only in order to get more representative distribu- tion of data gathered and estimated by Rodenbeck et al.[11]. The correlation of average temperature with CO2 flux is similar for ocean and continent surfaces, contradicting the expected negative flow due to larger absorption of CO2 by plants during warmer times; this means that dur- ing warming phases, ocean liberation of CO2 is much more powerful than the continental biosphere uptake. Figure 14. Increasing oscillatory absorption of CO2 by ocean (and biomass?) lower during warm years. Tempera- ture as interannual change in average for inter tropical band (NASA, 2007; CDIAC [18]; [15]). Figure 15. Global averages of estimated interannual CO2 flux (discounting the CO2 from fossil fuel emission) (data from Rodenbec k et al. [11]; negative flux means atmosphere loss larger than gain); note stronger negative balance, at- mosphere loss, during colder years, between El Niño warm events (ENSO). Negative balance trend indicates accumula- tion in other reservoirs, biosphere and ocean. (CO2 in Gton C, after [11]; temperature from GISS/NASA, 2008 [18]). Copyright © 2010 SciRes. IJG 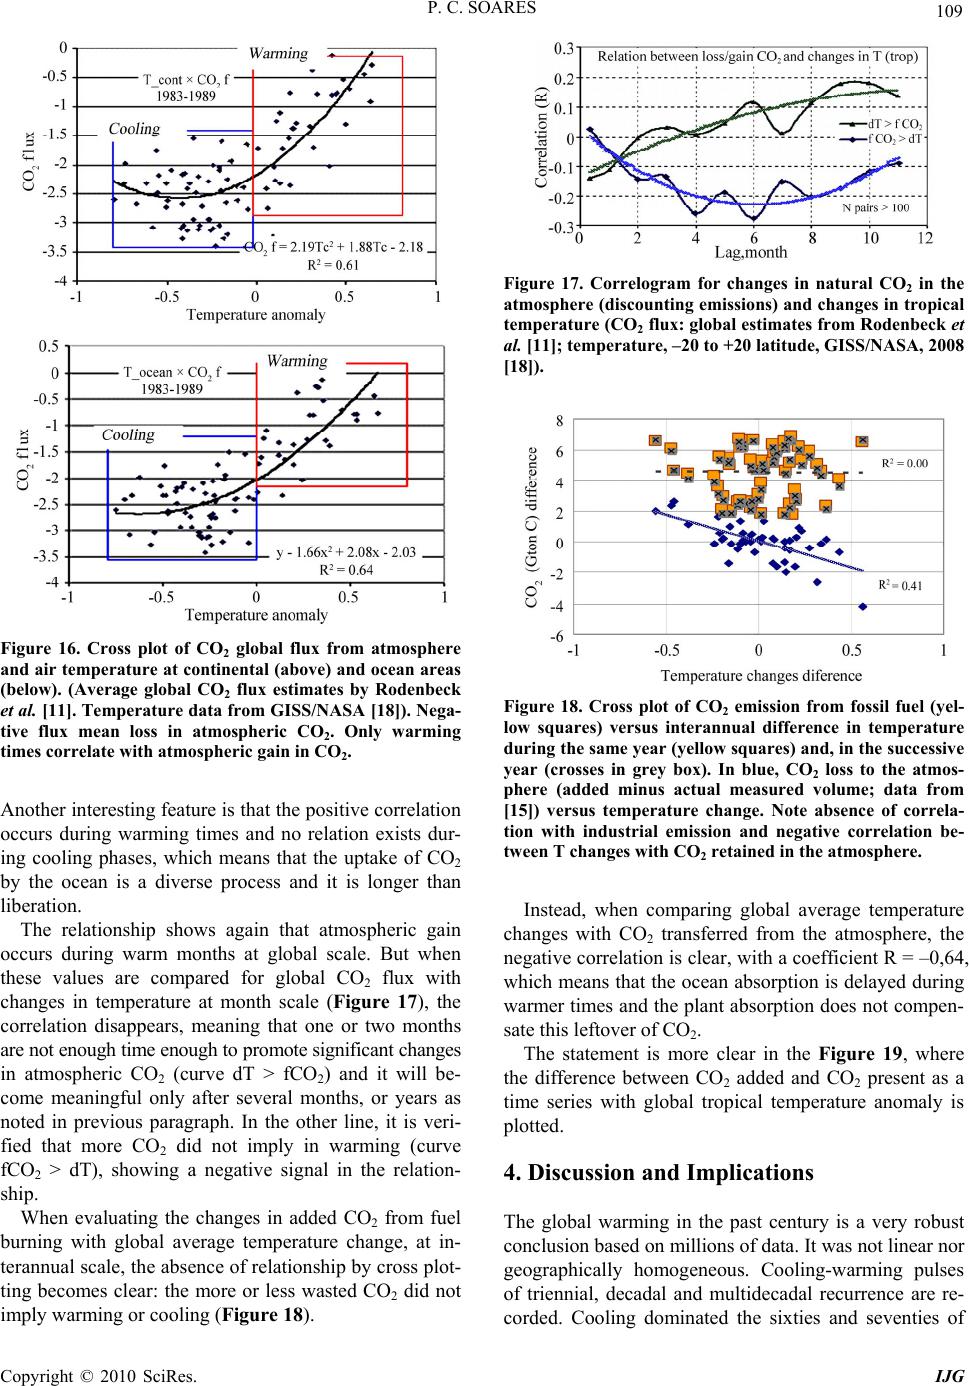 P. C. SOARES 109 Figure 16. Cross plot of CO2 global flux from atmosphere and air temperature at continental (above) and ocean areas (below). (Average global CO2 flux estimates by Rodenbeck et al. [11]. Temperature data from GISS/NASA [18]). Nega- tive flux mean loss in atmospheric CO2. Only warming times correlate with atmospheric gain in CO2. Another interesting feature is that the positive correlation occurs during warming times and no relation exists dur- ing cooling phases, which means that the uptake of CO2 by the ocean is a diverse process and it is longer than liberation. The relationship shows again that atmospheric gain occurs during warm months at global scale. But when these values are compared for global CO2 flux with changes in temperature at month scale (Figure 17), the correlation disappears, meaning that one or two months are not enough time enough to promote significant changes in atmospheric CO2 (curve dT > fCO2) and it will be- come meaningful only after several months, or years as noted in previous paragraph. In the other line, it is veri- fied that more CO2 did not imply in warming (curve fCO2 > dT), showing a negative signal in the relation- ship. When evaluating the changes in added CO2 from fuel burning with global average temperature change, at in- terannual scale, the absence of relationship by cross plot- ting becomes clear: the more or less wasted CO2 did not imply warming or cooling (Figure 18). Figure 17. Correlogram for changes in natural CO2 in the atmosphere (discounting emissions) and changes in tropical temperature (CO2 flux: global estimates from Rodenbeck et al. [11]; temperature, –20 to +20 latitude, GISS/NASA, 2008 [18]). Figure 18. Cross plot of CO2 emission from fossil fuel (yel- low squares) versus interannual difference in temperature during the same year (yellow squares) and, in the successive year (crosses in grey box). In blue, CO2 loss to the atmos- phere (added minus actual measured volume; data from [15]) versus temperature change. Note absence of correla- tion with industrial emission and negative correlation be- tween T changes with CO2 retained in the atmosphere. Instead, when comparing global average temperature changes with CO2 transferred from the atmosphere, the negative correlation is clear, with a coefficient R = –0,64, which means that the ocean absorption is delayed during warmer times and the plant absorption does not compen- sate this leftover of CO2. The statement is more clear in the Figure 19, where the difference between CO2 added and CO2 present as a time series with global tropical temperature anomaly is plotted. 4. Discussion and Implications The global warming in the past century is a very robust conclusion based on millions of data. It was not linear nor geographically homogeneous. Cooling-warming pulses of triennial, decadal and multidecadal recurrence are re- corded. Cooling dominated the sixties and seventies of Copyright © 2010 SciRes. IJG 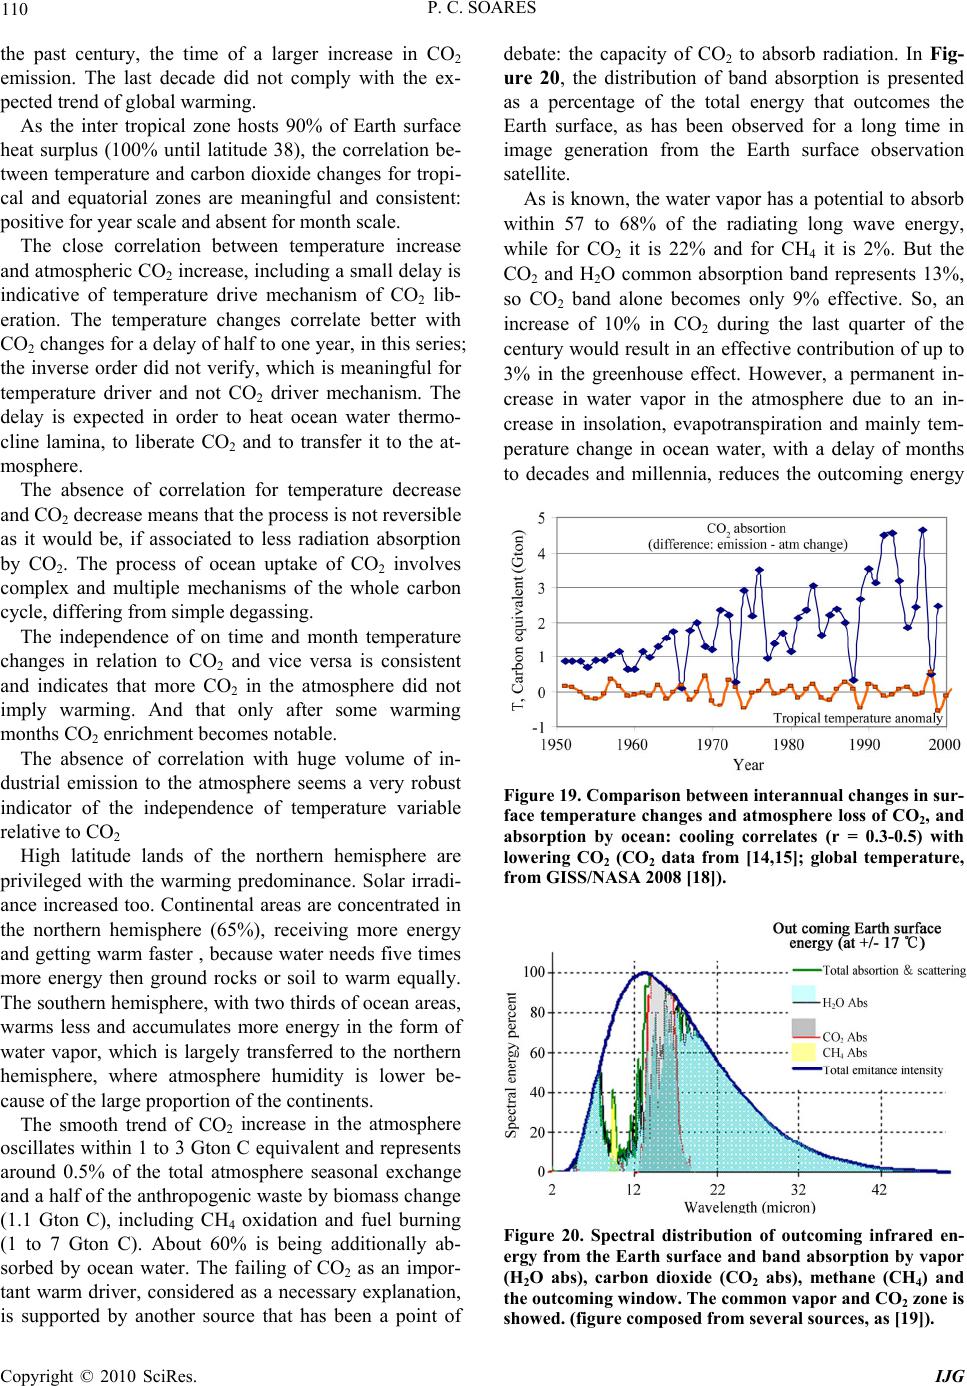 110 P. C. SOARES the past century, the time of a larger increase in CO2 emission. The last decade did not comply with the ex- pected trend of global warming. As the inter tropical zone hosts 90% of Earth surface heat surplus (100% until latitude 38), the correlation be- tween temperature and carbon dioxide changes for tropi- cal and equatorial zones are meaningful and consistent: positive for year scale and absent for month scale. The close correlation between temperature increase and atmospheric CO2 increase, including a small delay is indicative of temperature drive mechanism of CO2 lib- eration. The temperature changes correlate better with CO2 changes for a delay of half to one year, in this series; the inverse order did not verify, which is meaningful for temperature driver and not CO2 driver mechanism. The delay is expected in order to heat ocean water thermo- cline lamina, to liberate CO2 and to transfer it to the at- mosphere. The absence of correlation for temperature decrease and CO2 decrease means that the process is not reversible as it would be, if associated to less radiation absorption by CO2. The process of ocean uptake of CO2 involves complex and multiple mechanisms of the whole carbon cycle, differing from simple degassing. The independence of on time and month temperature changes in relation to CO2 and vice versa is consistent and indicates that more CO2 in the atmosphere did not imply warming. And that only after some warming months CO2 enrichment becomes notable. The absence of correlation with huge volume of in- dustrial emission to the atmosphere seems a very robust indicator of the independence of temperature variable relative to CO2 High latitude lands of the northern hemisphere are privileged with the warming predominance. Solar irradi- ance increased too. Continental areas are concentrated in the northern hemisphere (65%), receiving more energy and getting warm faster , because water needs five times more energy then ground rocks or soil to warm equally. The southern hemisphere, with two thirds of ocean areas, warms less and accumulates more energy in the form of water vapor, which is largely transferred to the northern hemisphere, where atmosphere humidity is lower be- cause of the large proportion of the continents. The smooth trend of CO2 increase in the atmosphere oscillates within 1 to 3 Gton C equivalent and represents around 0.5% of the total atmosphere seasonal exchange and a half of the anthropogenic waste by biomass change (1.1 Gton C), including CH4 oxidation and fuel burning (1 to 7 Gton C). About 60% is being additionally ab- sorbed by ocean water. The failing of CO2 as an impor- tant warm driver, considered as a necessary explanation, is supported by another source that has been a point of debate: the capacity of CO2 to absorb radiation. In Fig- ure 20, the distribution of band absorption is presented as a percentage of the total energy that outcomes the Earth surface, as has been observed for a long time in image generation from the Earth surface observation satellite. As is known, the water vapor has a potential to absorb within 57 to 68% of the radiating long wave energy, while for CO2 it is 22% and for CH4 it is 2%. But the CO2 and H2O common absorption band represents 13%, so CO2 band alone becomes only 9% effective. So, an increase of 10% in CO2 during the last quarter of the century would result in an effective contribution of up to 3% in the greenhouse effect. However, a permanent in- crease in water vapor in the atmosphere due to an in- crease in insolation, evapotranspiration and mainly tem- perature change in ocean water, with a delay of months to decades and millennia, reduces the outcoming energy Figure 19. Comparison betw een inter annual changes in sur - face temperature changes and atmosphere loss of CO2, and absorption by ocean: cooling correlates (r = 0.3-0.5) with lowering CO2 (CO2 data from [14,15]; global temperature, from GISS/NASA 2008 [18]). Figure 20. Spectral distribution of outcoming infrared en- ergy from the Earth surface and band absorption by vapor (H2O abs), carbon dioxide (CO2 abs), methane (CH4) and the outcoming window. The common vapor and CO2 zone i s showed. (figure composed from several sources, as [19]). Copyright © 2010 SciRes. IJG 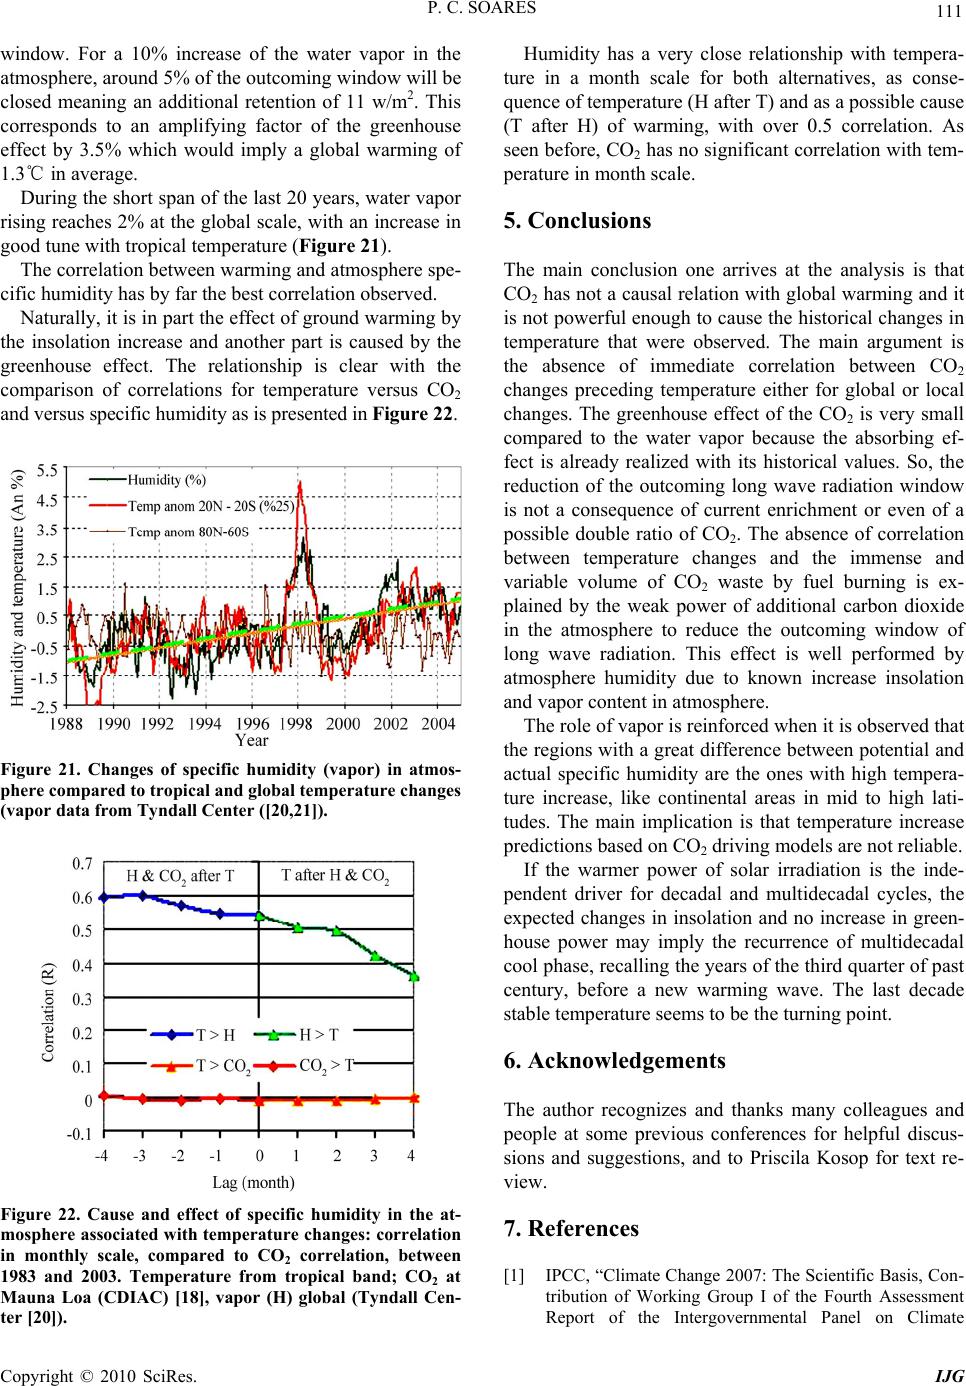 P. C. SOARES 111 window. For a 10% increase of the water vapor in the atmosphere, around 5% of the outcoming window will be closed meaning an additional retention of 11 w/m2. This corresponds to an amplifying factor of the greenhouse effect by 3.5% which would imply a global warming of 1.3℃ in average. During the short span of the last 20 years, water vapor rising reaches 2% at the global scale, with an increase in good tune with tropical temperature (Figure 21). The correlation between warming and atmosphere spe- cific humidity has by far the best correlation observed. Naturally, it is in part the effect of ground warming by the insolation increase and another part is caused by the greenhouse effect. The relationship is clear with the comparison of correlations for temperature versus CO2 and versus specific humidity as is presented in Figure 22. Figure 21. Changes of specific humidity (vapor) in atmos- phere compared to tropical and global temperature changes (vapor data from Tyndall Center ([20,21]). Figure 22. Cause and effect of specific humidity in the at- mosphere associated with temperature changes: correlation in monthly scale, compared to CO2 correlation, between 1983 and 2003. Temperature from tropical band; CO2 at Mauna Loa (CDIAC) [18], vapor (H) global (Tyndall Cen- ter [20]). Humidity has a very close relationship with tempera- ture in a month scale for both alternatives, as conse- quence of temperature (H after T) and as a possible cause (T after H) of warming, with over 0.5 correlation. As seen before, CO2 has no significant correlation with tem- perature in month scale. 5. Conclusions The main conclusion one arrives at the analysis is that CO2 has not a causal relation with global warming and it is not powerful enough to cause the historical changes in temperature that were observed. The main argument is the absence of immediate correlation between CO2 changes preceding temperature either for global or local changes. The greenhouse effect of the CO2 is very small compared to the water vapor because the absorbing ef- fect is already realized with its historical values. So, the reduction of the outcoming long wave radiation window is not a consequence of current enrichment or even of a possible double ratio of CO2. The absence of correlation between temperature changes and the immense and variable volume of CO2 waste by fuel burning is ex- plained by the weak power of additional carbon dioxide in the atmosphere to reduce the outcoming window of long wave radiation. This effect is well performed by atmosphere humidity due to known increase insolation and vapor content in atmosphere. The role of vapor is reinforced when it is observed that the regions with a great difference between potential and actual specific humidity are the ones with high tempera- ture increase, like continental areas in mid to high lati- tudes. The main implication is that temperature increase predictions based on CO2 driving models are not reliable. If the warmer power of solar irradiation is the inde- pendent driver for decadal and multidecadal cycles, the expected changes in insolation and no increase in green- house power may imply the recurrence of multidecadal cool phase, recalling the years of the third quarter of past century, before a new warming wave. The last decade stable temperature seems to be the turning point. 6. Acknowledgements The author recognizes and thanks many colleagues and people at some previous conferences for helpful discus- sions and suggestions, and to Priscila Kosop for text re- view. 7. References [1] IPCC, “Climate Change 2007: The Scientific Basis, Con- tribution of Working Group I of the Fourth Assessment Report of the Intergovernmental Panel on Climate Copyright © 2010 SciRes. IJG 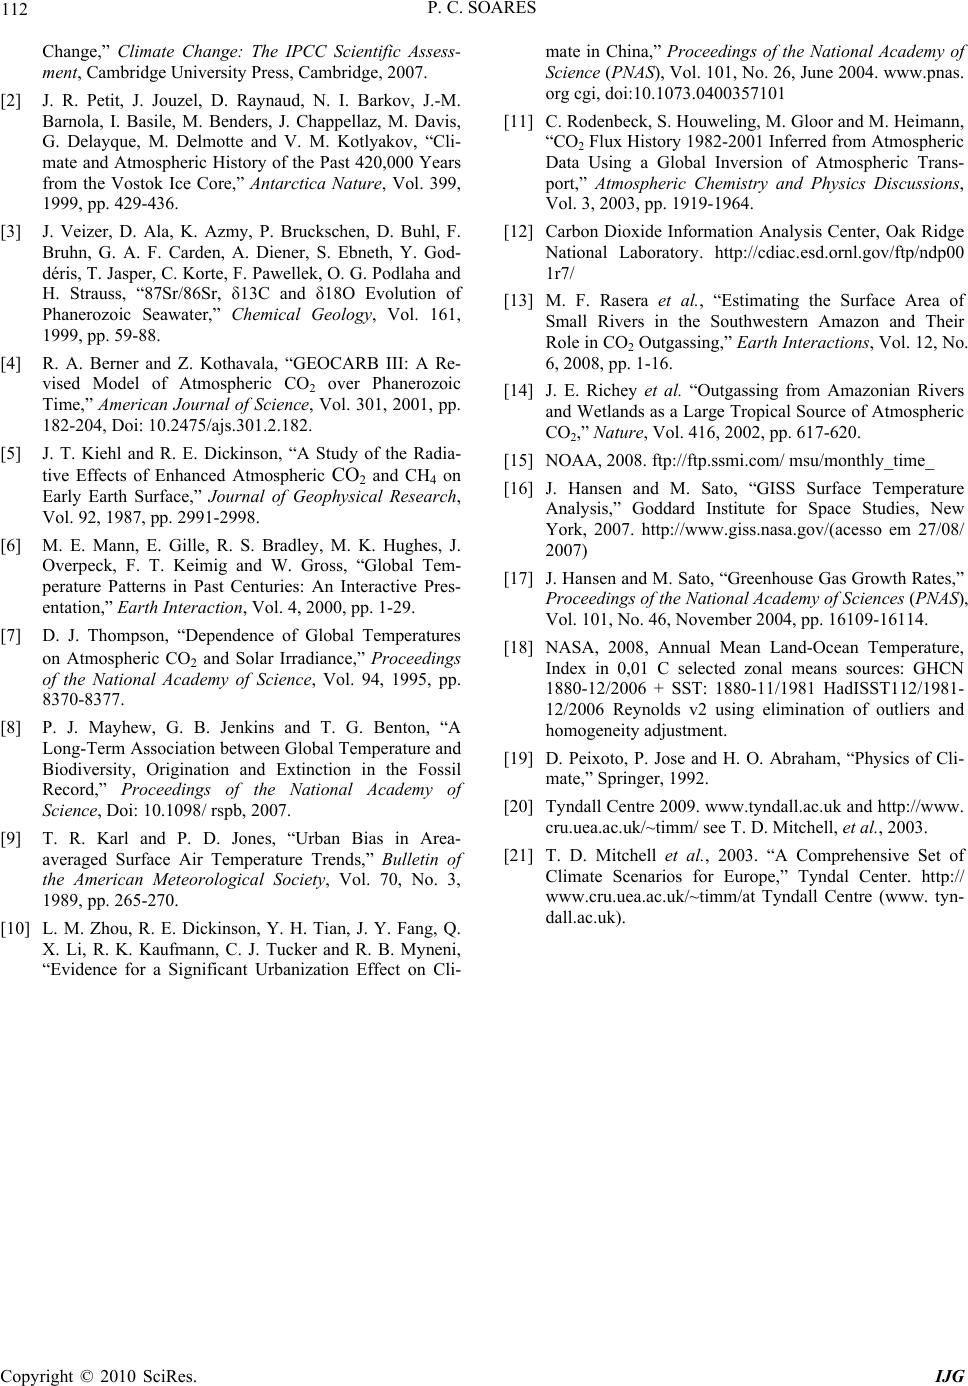 P. C. SOARES Copyright © 2010 SciRes. IJG 112 Change,” Climate Change: The IPCC Scientific Assess- ment, Cambridge University Press, Cambridge, 2007. [2] J. R. Petit, J. Jouzel, D. Raynaud, N. I. Barkov, J.-M. Barnola, I. Basile, M. Benders, J. Chappellaz, M. Davis, G. Delayque, M. Delmotte and V. M. Kotlyakov, “Cli- mate and Atmospheric History of the Past 420,000 Years from the Vostok Ice Core,” Antarctica Nature, Vol. 399, 1999, pp. 429-436. [3] J. Veizer, D. Ala, K. Azmy, P. Bruckschen, D. Buhl, F. Bruhn, G. A. F. Carden, A. Diener, S. Ebneth, Y. God- déris, T. Jasper, C. Korte, F. Pawellek, O. G. Podlaha and H. Strauss, “87Sr/86Sr, δ13C and δ18O Evolution of Phanerozoic Seawater,” Chemical Geology, Vol. 161, 1999, pp. 59-88. [4] R. A. Berner and Z. Kothavala, “GEOCARB III: A Re- vised Model of Atmospheric CO2 over Phanerozoic Time,” American Journal of Science, Vol. 301, 2001, pp. 182-204, Doi: 10.2475/ajs.301.2.182. [5] J. T. Kiehl and R. E. Dickinson, “A Study of the Radia- tive Effects of Enhanced Atmospheric CO2 and CH4 on Early Earth Surface,” Journal of Geophysical Research, Vol. 92, 1987, pp. 2991-2998. [6] M. E. Mann, E. Gille, R. S. Bradley, M. K. Hughes, J. Overpeck, F. T. Keimig and W. Gross, “Global Tem- perature Patterns in Past Centuries: An Interactive Pres- entation,” Earth Interaction , Vol. 4, 2000, pp. 1-29. [7] D. J. Thompson, “Dependence of Global Temperatures on Atmospheric CO2 and Solar Irradiance,” Proceedings of the National Academy of Science, Vol. 94, 1995, pp. 8370-8377. [8] P. J. Mayhew, G. B. Jenkins and T. G. Benton, “A Long-Term Association between Global Temperature and Biodiversity, Origination and Extinction in the Fossil Record,” Proceedings of the National Academy of Science, Doi: 10.1098/ rspb, 2007. [9] T. R. Karl and P. D. Jones, “Urban Bias in Area- averaged Surface Air Temperature Trends,” Bulletin of the American Meteorological Society, Vol. 70, No. 3, 1989, pp. 265-270. [10] L. M. Zhou, R. E. Dickinson, Y. H. Tian, J. Y. Fang, Q. X. Li, R. K. Kaufmann, C. J. Tucker and R. B. Myneni, “Evidence for a Significant Urbanization Effect on Cli- mate in China,” Proceedings of the National Academy of Science (PNAS), Vol. 101, No. 26, June 2004. www.pnas. org cgi, doi:10.1073.0400357101 [11] C. Rodenbeck, S. Houweling, M. Gloor and M. Heimann, “CO2 Flux History 1982-2001 Inferred from Atmospheric Data Using a Global Inversion of Atmospheric Trans- port,” Atmospheric Chemistry and Physics Discussions, Vol. 3, 2003, pp. 1919-1964. [12] Carbon Dioxide Information Analysis Center, Oak Ridge National Laboratory. http://cdiac.esd.ornl.gov/ftp/ndp00 1r7/ [13] M. F. Rasera et al., “Estimating the Surface Area of Small Rivers in the Southwestern Amazon and Their Role in CO2 Outgassing,” Earth Interactions, Vol. 12, No. 6, 2008, pp. 1-16. [14] J. E. Richey et al. “Outgassing from Amazonian Rivers and Wetlands as a Large Tropical Source of Atmospheric CO2,” Nature, Vol. 416, 2002, pp. 617-620. [15] NOAA, 2008. ftp://ftp.ssmi.com/ msu/monthly_time_ [16] J. Hansen and M. Sato, “GISS Surface Temperature Analysis,” Goddard Institute for Space Studies, New York, 2007. http://www.giss.nasa.gov/(acesso em 27/08/ 2007) [17] J. Hansen and M. Sato, “Greenhouse Gas Growth Rates,” Proceedings of the National Academy of Sciences (PNAS), Vol. 101, No. 46, November 2004, pp. 16109-16114. [18] NASA, 2008, Annual Mean Land-Ocean Temperature, Index in 0,01 C selected zonal means sources: GHCN 1880-12/2006 + SST: 1880-11/1981 HadISST112/1981- 12/2006 Reynolds v2 using elimination of outliers and homogeneity adjustment. [19] D. Peixoto, P. Jose and H. O. Abraham, “Physics of Cli- mate,” Springer, 1992. [20] Tyndall Centre 2009. www.tyndall.ac.uk and http://www. cru.uea.ac.uk/~timm/ see T. D. Mitchell, et al., 2003. [21] T. D. Mitchell et al., 2003. “A Comprehensive Set of Climate Scenarios for Europe,” Tyndal Center. http:// www.cru.uea.ac.uk/~timm/at Tyndall Centre (www. tyn- dall.ac.uk).
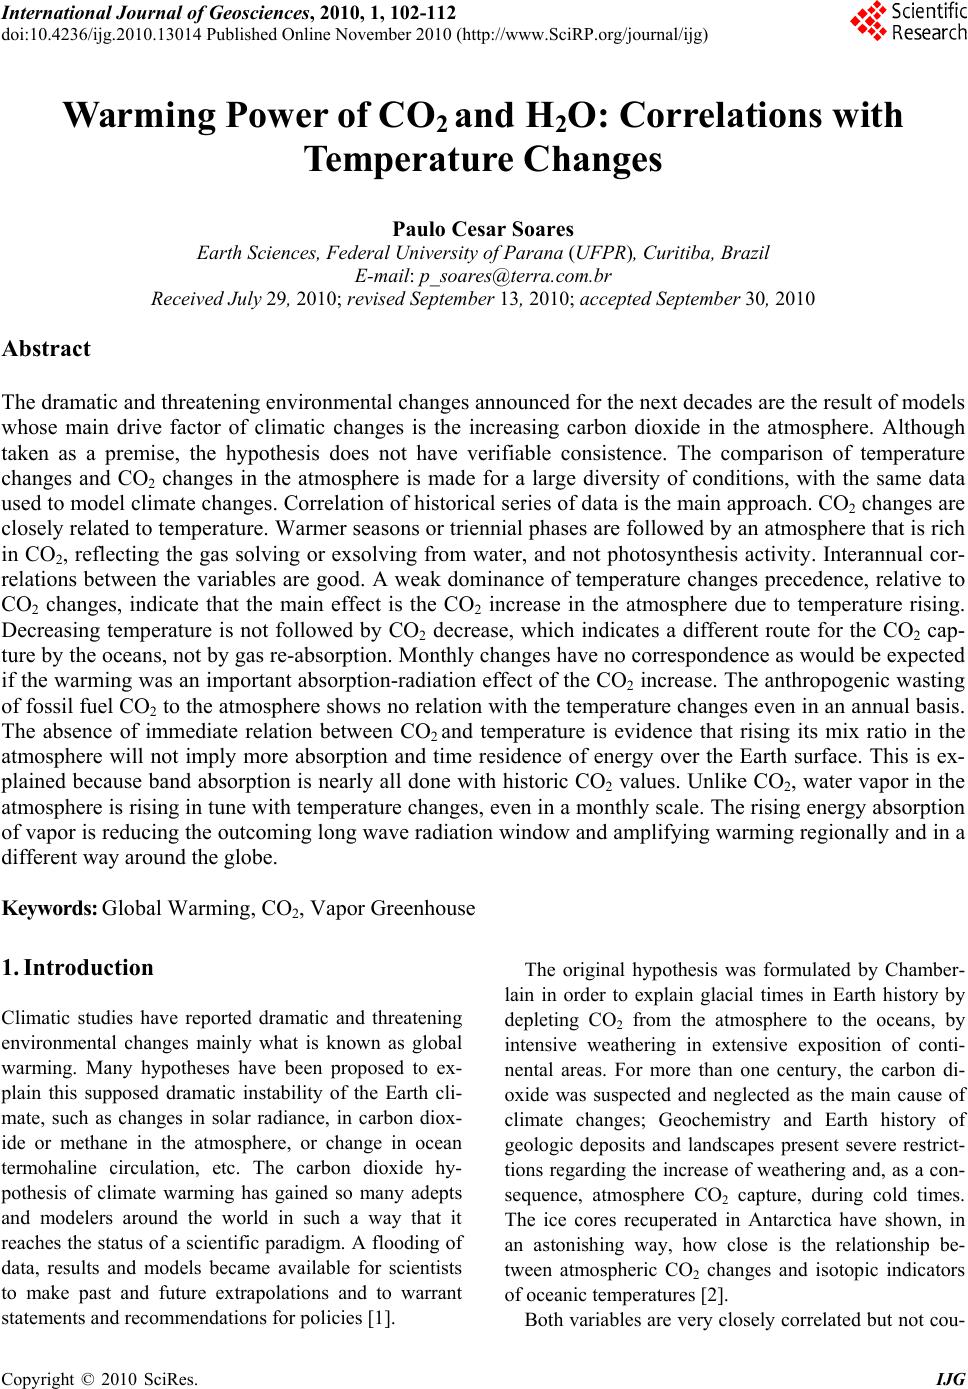
|