 Journal of Modern Physics, 2013, 4, 89-95 doi:10.4236/jmp.2013.45B015 Published Online May 2013 (http://www.scirp.org/journal/jmp) On the Sub-Critical Bifurcation of Anti-Phase and In-Phase Synchronized Vortex Shedding Forms Yih Ferng Peng Department of Civil Engineering, National Chi Nan University, Puli 545, Taiwan, China. Email: yfpeng@ncnu.edu.tw Received 2013 ABSTRACT Transition of flows past a pair of side-by-side circular cylinders are investigated by numerical simulations and the bi- furcation analysis of the numerical results. Various flow patterns behind the cylinder-pair have been identified by the gap ratio (G) and Reynolds number (Re). This study focus on transition of in-phase and anti-phase vortex shedding synchronized forms. A nested Cartesian-grid formulation, in combination with an effective immersed boundary method and a two-step fractional-step procedure, has been adopted to simulate the flows. Numerical results reveal that the in-phase and anti-phase vortex shedding flows at Re = 100 can co-exist at 2.08 2.58G . Hysteresis loop with in- creasing/decreasing G at constant Reynolds number Re = 100 is reported. Keywords: In-phase Vortex Shedding; Anti-phase Vortex Shedding; Hysteresis 1. Introduction Because of its fundamental importance and engineering significance, unstable flow interferences across bluff bodies have been investigated extensively. Flow inter- ference with a pair of cylinders is complex in which both relative-gap between the cylinders and arrangements of relative position (in tandem, side-by-side, or in staggered) play crucial roles in the physical transition. Among flows around a pair of cylinders in various configurations, those behind circular cylinders in a side-by-side arrangement have been mostly extensively studied [1-11]. It is now well established that the flow patterns behind a pair of side-by-side cylinders can be classified [3,12] by the gap- ratio G (surface-to-surface distance divided by cylinder- diameter) and the Reynolds number (Reynolds number, Re, is defined as/ o ReU D , where o U is the free- stream velocity, D is the cylinder diameter, and is the kinematic viscosity). At very small Gap ratios, the two cylinders may behave in a similar fashion to a single bluff- body [1]. At intermediate Gap ratios, the two side-by- side cylinders is known [2] to exhibit a deflected or bi- ased flow patterns, which are bi-stable in nature. The deflected flow pattern is characterized by a gap flow bi- ased towards one of the two cylinders. The gap flow in this regime switches spontaneously from one side to the other and thus corresponds to the flip-flopped regime [5]. For weak coupling (with relatively large G, 1 G 5) many of the past researchers report occurrences of both anti-phase and in-phase synchronized vortex shedding behind a pair of circular cylinders. Findings of William- son [4] confirm that the shedding vortices (for 40 Re 160) remain synchronized either in phase or in anti- phase. Anti-phase streets often preserve the phase-locked identity of the vortices even at a far downstream location. However, for strong coupling (with relatively lower G) only in-phase vortex shedding has been reported, and the associated physical process eventually leads to formation of a complex asymmetrically evolving Benard von Kar- man streets. Although there are varieties of flow patterns behind a pair of side-by-side cylinders have been identified (which include semi-single and twin vortex street formations, symmetric and deflected flows, stationary, biased and flip-flopped-type vortex shedding, periodic, quasi-peri- odic, and weakly-chaotic flows, and in-phase and anti- phase vortex synchronizations), very restriction results have been reported on transition of those various flow patterns. Examples can be found in the studies of Mizu- shima & Ino [13] and Peng et al. [14]. In [13], parameter space of the gap ratio and the critical Reynolds number of symmetry/deflected vortex shedding flows and in- phase/anti-phase vortex shedding flows behind a pair of circular cylinders at low Reynolds number have been reported by results of numerical simulations and linear stability analyses. While in the study [14], transition from semi-single symmetry vortex shedding flow to semi- single deflected vortex shedding flow as well as transi- tion from twin symmetry vortex shedding to twin de- flected vortex shedding and then transition to the flipped- Copyright © 2013 SciRes. JMP 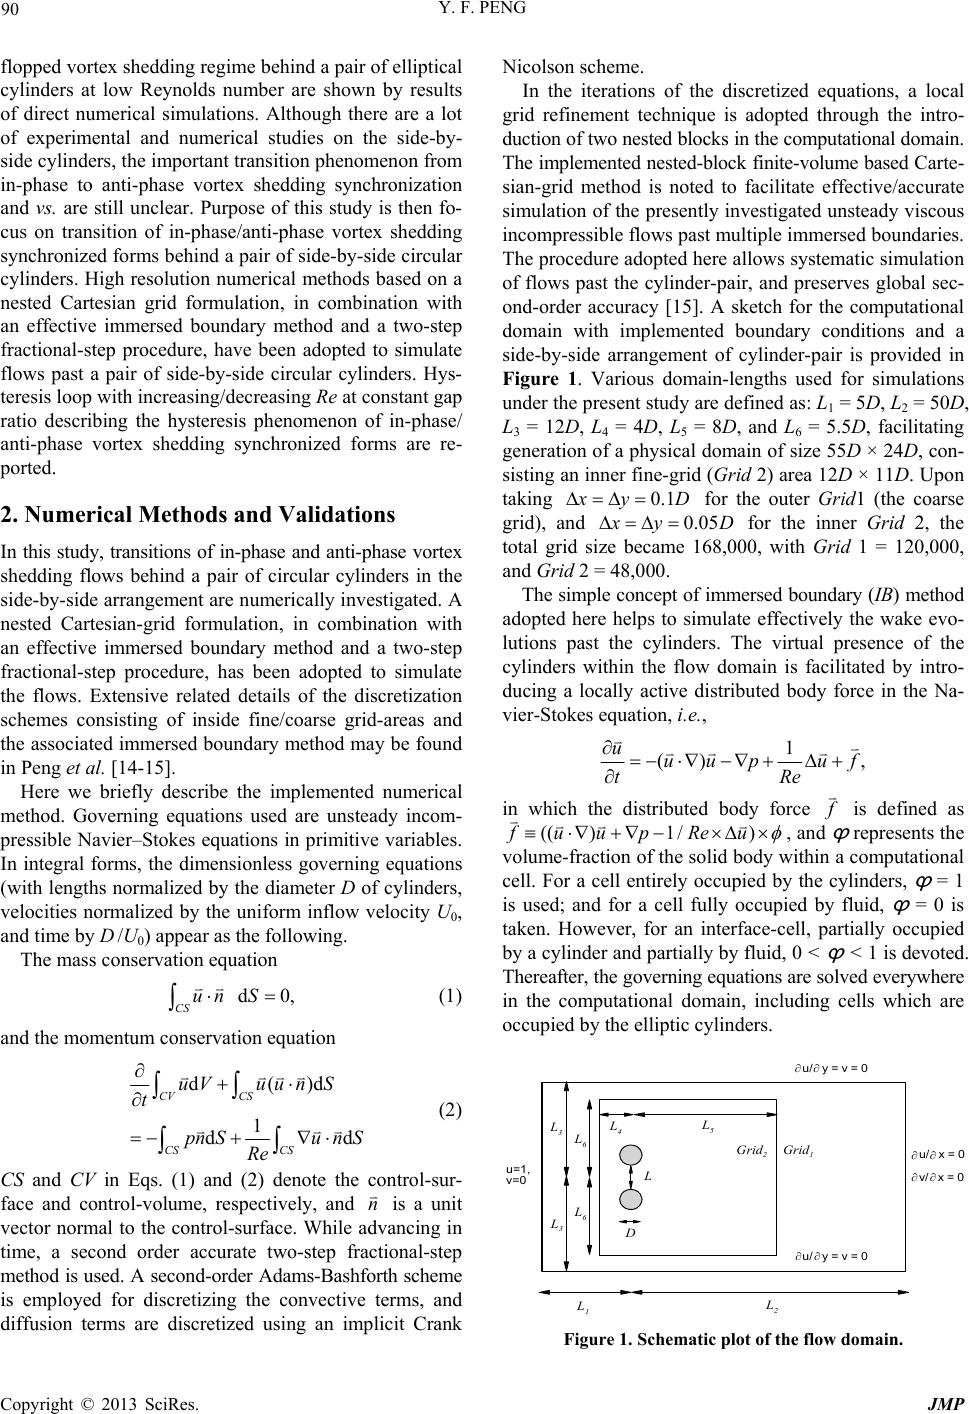 Y. F. PENG 90 flopped vortex shedding regime behind a pair of elliptical cylinders at low Reynolds number are shown by results of direct numerical simulations. Although there are a lot of experimental and numerical studies on the side-by- side cylinders, the important transition phenomenon from in-phase to anti-phase vortex shedding synchronization and vs. are still unclear. Purpose of this study is then fo- cus on transition of in-phase/anti-phase vortex shedding synchronized forms behind a pair of side-by-side circular cylinders. High resolution numerical methods based on a nested Cartesian grid formulation, in combination with an effective immersed boundary method and a two-step fractional-step procedure, have been adopted to simulate flows past a pair of side-by-side circular cylinders. Hys- teresis loop with increasing/decreasing Re at constant gap ratio describing the hysteresis phenomenon of in-phase/ anti-phase vortex shedding synchronized forms are re- ported. 2. Numerical Methods and Validations In this study, transitions of in-phase and anti-phase vortex shedding flows behind a pair of circular cylinders in the side-by-side arrangement are numerically investigated. A nested Cartesian-grid formulation, in combination with an effective immersed boundary method and a two-step fractional-step procedure, has been adopted to simulate the flows. Extensive related details of the discretization schemes consisting of inside fine/coarse grid-areas and the associated immersed boundary method may be found in Peng et al. [14-15]. Here we briefly describe the implemented numerical method. Governing equations used are unsteady incom- pressible Navier–Stokes equations in primitive variables. In integral forms, the dimensionless governing equations (with lengths normalized by the diameter D of cylinders, velocities normalized by the uniform inflow velocity U0, and time by D /U0) appear as the following. The mass conservation equation d0 CS un S , (1) and the momentum conservation equation d()d 1 dd CV CS CS CS uVuun S t pn Sun S Re Ni n inner fine-gri (2) CS and CV in Eqs. (1) and (2) denote the control-sur- face and control-volume, respectively, and is a unit vector normal to the control-surface. While advancing in time, a second order accurate two-step fractional-step method is used. A second-order Adams-Bashforth scheme is employed for discretizing the convective terms, and diffusion terms are discretized using an implicit Crank n colson scheme. In the iterations of the discretized equations, a local grid refinement technique is adopted through the intro- duction of two nested blocks in the computational domain. The implemented nested-block finite-volume based Carte- sian-grid method is noted to facilitate effective/accurate simulation of the presently investigated unsteady viscous incompressible flows past multiple immersed boundaries. The procedure adopted here allows systematic simulation of flows past the cylinder-pair, and preserves global sec- ond-order accuracy [15]. A sketch for the computational domain with implemented boundary conditions and a side-by-side arrangement of cylinder-pair is provided in Figure 1. Various domain-lengths used for simulations under the present study are defined as: L1 = 5D, L2 = 50D, L3 = 12D, L4 = 4D, L5 = 8D, and L6 = 5.5D, facilitating generation of a physical domain of size 55D × 24D, con- sisting ad (Grid 2) area 12D × 11D. Upon taking 0.1 yD the outer Grid1 (the coarse grid), and 0.05 for yD for the inner Grid 2, the total grid size became 168,000, with Grid 1 = 120,000, an ted body force in the Na- vier-Stokes equation, i.e., d Grid 2 = 48,000. The simple concept of immersed boundary (IB) method adopted here helps to simulate effectively the wake evo- lutions past the cylinders. The virtual presence of the cylinders within the flow domain is facilitated by intro- ducing a locally active distribu 1 () uuup uf, tRe in which the distributed body force is defined as (( )1/)fuupReu , and ϕ represents the volume-fraction of the solid body within a computational cell. For a cell entirely occupied by the cylinders, ϕ = 1 is used; and for a cell fully occupied by fluid, ϕ = 0 is taken. However, for an interface-cell, partially occupied by a cylinder and partially by fluid, 0 < ϕ < 1 is devoted. Thereafter, the governing equations are solved everywhere in the computational domain, including cells which are ccupied by the elliptic cylinders. o L 6 L D L 5 L 2 L 1 L 3 Grid 1 Grid 2 u/ y=v=0 u/ y=v=0 u=1, v=0 u/x = 0 v/x = 0 L 3 L 6 L 4 Figure 1. Schematic plot of the flow domain. Copyright © 2013 SciRes. JMP 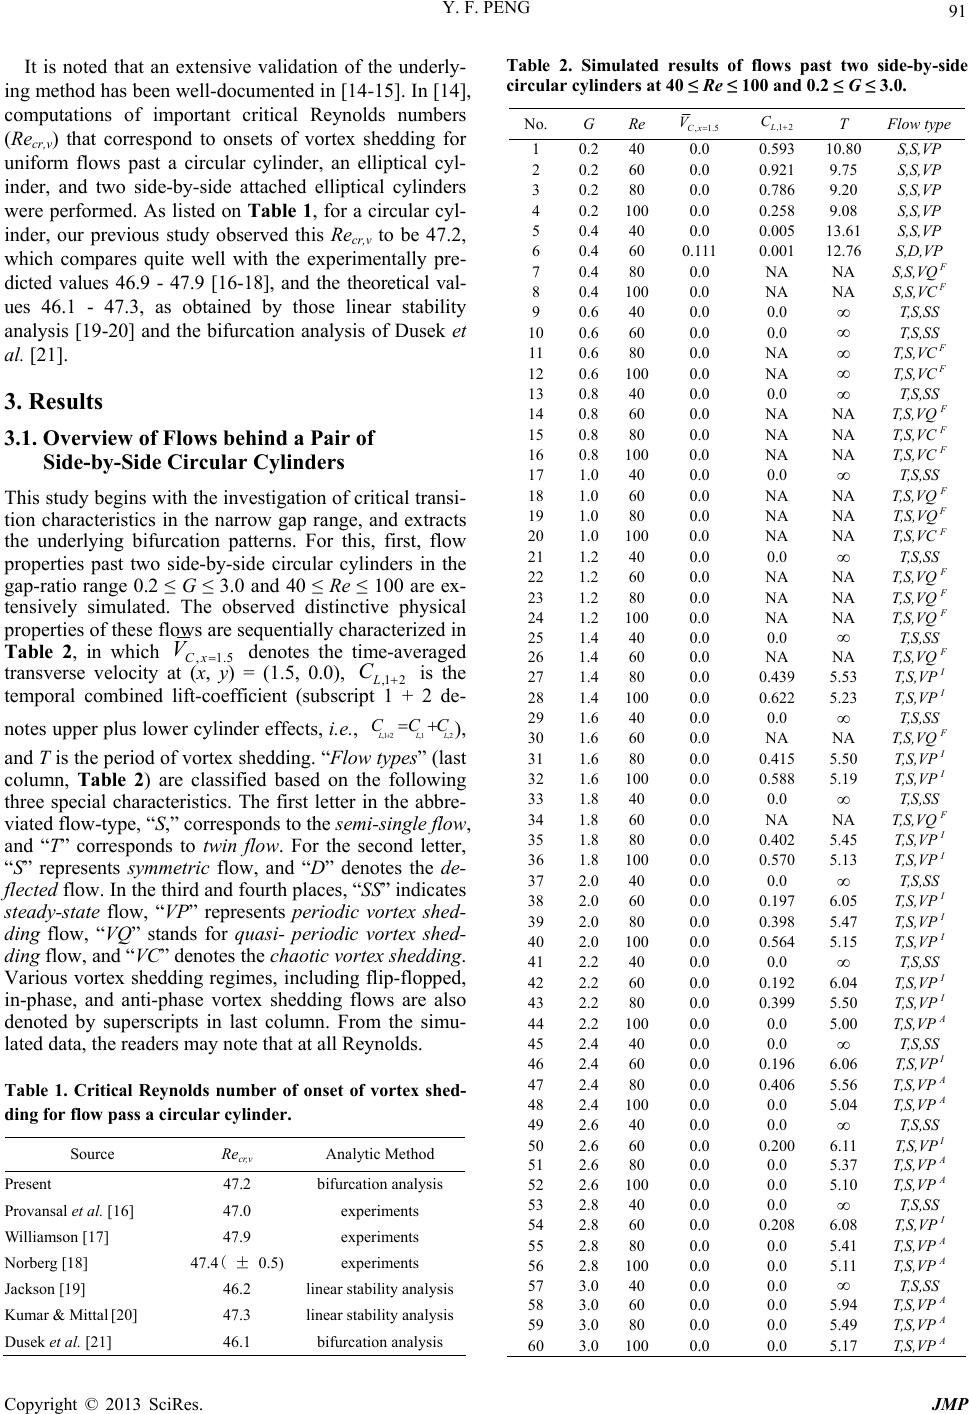 Y. F. PENG 91 It is noted that an extensive validation of the underly- ing method has been well-documented in [14-15]. In [14], computations of important critical Reynolds numbers (Recr,v) that correspond to onsets of vortex shedding for uniform flows past a circular cylinder, an elliptical cyl- inder, and two side-by-side attached elliptical cylinders were performed. As listed on Table 1, for a circular cyl- inder, our previous study observed this Recr,v to be 47.2, which compares quite well with the experimentally pre- dicted values 46.9 - 47.9 [16-18], and the theoretical val- ues 46.1 - 47.3, as obtained by those linear stability analysis [19-20] and the bifurcation analysis of Dusek et al. [21]. 3.1. Overview of Flows behind a Pair of are 3. Results Side-by-Side Circular Cylinders This study begins with the investigation of critical transi- tion characteristics in the narrow gap range, and extracts the underlying bifurcation patterns. For this, first, flow properties past two side-by-side circular cylinders in the gap-ratio range 0.2 ≤ G ≤ 3.0 and 40 ≤ Re ≤ 100 are ex- tensively simulated. The observed distinctive physical properties of these flows sequentially characterized in Table 2, in which ,1.5Cx V denotes the teraged transverse velocity at (x, y) = (1.5, 0.0), ,1 2L C ime-av is the temporal combined lift-coefficient (subscripe- t 1 + 2 d mu- ted data, the readers may note that at all Reynolds. f vortex shed- ding for flow pass a circular cylinder. Source notes upper plus lower cylinder effects, i.e., ,12,1,2LLL CCC ), and T is the period of vortex shedding. “Flow types” (last column, Table 2) are classified based on the following three special characteristics. The first letter in the abbre- viated flow-type, “S,” corresponds to the semi-single flow, and “T” corresponds to twin flow. For the second letter, “S” represents symmetric flow, and “D” denotes the de- flected flow. In the third and fourth places, “SS” indicates steady-state flow, “VP” represents periodic vortex shed- ding flow, “VQ” stands for quasi- periodic vortex shed- ding flow, and “VC” denotes the chaotic vortex sh edd ing. Various vortex shedding regimes, including flip-flopped, in-phase, and anti-phase vortex shedding flows are also denoted by superscripts in last column. From the si la Table 1. Critical Reynolds number of onset o Recr,v Analytic Method Present 47.2 bifis urcation analys Provansal et al. [16] 7] 47.45) 0] li 47.0 experiments Williamson [147.9 experiments Norberg [18] ( ± 0. experiments Jackson [19] 46.2 linear stability analysis Kumar & Mittal [247.3 near stability analysis Dusek et al. [21] 46.1 bifurcation analysis Table 2. Simulated results of flows past two side-by-side circular cylinders at 40 ≤ Re ≤ 100 and 0.2 ≤ G ≤ 3.0. No. G Re,1.5Cx V F ,1 2L C T low type 1 0.2400.0 0.593 10.80 S,S,VP 2 0.2600.0 0.921 9.75 S,S,VP 3 0.2800.0 0.786 9.20 S,S,VP 4 0.21000.0 0.258 9.08 S,S,VP 5 0.4400.0 0.005 13.61 S,S,VP 6 0.4600 NA S T NA T, NA T, NA T, 0 5.23 0 5.19 0 5.13 0 5.15 0 5.00 T 0 5.04 T 0 5.10 T 0 5.1 T 60 3.01000.0 0.0 5.17 T,S,VP A .1110.00112.76 S,D,VP 7 0.4800.0 NA NA S,S,VQ F 8 0.41000.0 NA ,S,VC F 9 0.6400.0 0.0 T,S,SS 10 0.6600.0 0.0 T,S,SS 11 0.6800.0 NA T, S, VC F 12 0.61000.0 NA ,S,VC F 13 0.8400.0 0.0 T,S,SS 14 0.8600.0 NA NA T,S,VQ F 15 0.8800.0 NA NA T,S,VC F 16 0.81000.0 NA S,VC F 17 1.0400.0 0.0 T,S,SS 18 1.0600.0 NA NA T,S,VQ F 19 1.0800.0 NA NA T,S ,VQ F 20 1.01000.0 NA S,VC F 21 1.2400.0 0.0 T,S,SS 22 1.2600.0 NA NA T,S,VQ F 23 1.2800.0 NA NA T,S,VQ F 24 1.21000.0 NA S,VQ F 25 1.4400.0 0.0 T,S,SS 26 1.4600.0 NA NA T,S,VQ F 27 1.4800.0 0.439 5.53 T,S,VP I 28 1.41000.0 .622T,S,VP I 29 1.6400.0 0.0 T,S,SS 30 1.6600.0 NA NA T,S,VQ F 31 1.6800.0 0.415 5.50 T,S,VP I 32 1.61000.0 .588T,S,VP I 33 1.8400.0 0.0 T,S,SS 34 1.8600.0 NA NA T,S,VQ F 35 1.8800.0 0.402 5.45 T,S,VP I 36 1.81000.0 .570T,S,VP I 37 2.0400.0 0.0 T,S,SS 38 2.0600.0 0.197 6.05 T,S,VP I 39 2.0800.0 0.398 5.47 T,S,VP I 40 2.01000.0 .564T,S,VP I 41 2.2400.0 0.0 T,S,SS 42 2.2600.0 0.192 6.04 T,S,VP I 43 2.2800.0 .3995.50 T,S,VP I 44 2.21000.0 0.0 ,S,VP A 45 2.4400.0 0.0 T,S,SS 46 2.4600.0 0.196 6.06 T,S,V P I 47 2.4800.0 .4065.56 T,S,VP A 48 2.41000.0 0.0 ,S,VP A 49 2.6400.0 0.0 T,S,SS 50 2.6600.0 .2006.11 T,S ,V P I 51 2.6800.0 0.0 5.37 T,S,VP A 52 2.61000.0 0.0 ,S,VP A 53 2.8400.0 0.0 T,S,SS 54 2.8600.0 .2086.08 T,S,VP I 55 2.8800.0 0.0 5.41 T,S,VP A 56 2.81000.0 0.0 1 ,S,VP A 57 3.0400.0 0.0 T,S,SS 58 3.0600.0 0.0 5.94 T,S,VP A 59 3.0800.0 0.0 5.49 T,S,VP A Copyright © 2013 SciRes. JMP  Y. F. PENG 92 numbers (Re ≥ 40) the single vortex shedding street is reached in the range G ≤ 0.4. However, for larger G (G ≥ 0.6), the approach to the vortex shedding flow remained dependent on Re. The flip-flopped vortex-shed-ding oc- curred in the gap-ratio range 0.4 ≤ G ≤ 1.8 with Re ≥ 60. In-phase vortex shedding is detected at 0.4 ≤ G ≤ 1.8, and anti-phase vortex shedding is founded at large G (G ≥ 2.2). Notably, while Table 2 presents the explicit physi- cal details of various flows, for the sake of facilitating immediate comprehension of a trend, the parameter space diagram is suitably summarized in Figure 2. As shown in Figure 2, it is clear that flows are semi-single at G < 0.5. At intermediate Gap ratios the two side-by-side cylinders is known to exhibit a deflected or biased flow patterns, which are bi-stable in nature. The deflected jets through circular gap are further affected by the shedding vortices at higher Re and flows become flip-flopped consequently. The range of Gap ratios where the flip-flopped flow pattern is observed extends from approximately Gap ratios between 0.4 - 1.8 depending on the Reynolds number. At higher Gap ratios, i.e., the cyl- inders are spaced sufficiently far apart, the pair of cylin- ders may behave as two independent bluff bodies. Prox- imity interference effects, however, lead to various modes of synchronization, anti-phase and in-phase, in the vortex formation and shedding processes and the result- ing parallel vortex streets. For example, in-phase and anti-phase vortex shedding flows at Re = 100 are clearly revealed at G = 2.0 and G = 3.0, respectively. 3.2. Hysteresis Scenario of In-phase and Anti-phase Synchronized Forms To investigated the transition of in-phase and anti-phase synchronized forms in flows past a pair of side-by-side circular cylinders, two sets of computations including anti-phase and in-phase branches are carried out. The anti-phase branch started from the anti-phase vortex 20 30 40 50 60 70 80 90100110120 Re 0.0 0.2 0.4 0.6 0.8 1.0 1.2 1.4 1.6 1.8 2.0 2.2 2.4 2.6 2.8 3.0 3.2 3.4 3.6 SSSS SSSSSSSSS SSS S S S SS S S S S S S S DDDDDD D FFF FFFF FF FFF FFF FFF FFFF F F A AA AA AA AAA A A A A A A A A A A Twin street Semi-single street S: symmetric flowsD: deflected flowsF: flip-flopped flows I: in-phase flowsA: anti-phase flows : steady flows : periodic flows : quasi-periodic flows : chaotic flows Figure 2. Simulated different wake patterns observed be- hind two side-by-side circular cylinders. shedding flow at G = 3.0 and Re = 100 and are calculated by progressively decreasing G in very small steps. In the meanwhile, the in-phase branch started from the in-phase vortex shedding flow at G = 2.0 and Re = 100 and are calculated by progressively increasing G in small steps. The observed distinctive physical properties of these flows are sequentially characterized in Table 3. It is noted that in anti-phase branch, the solution at a higher G is used as the initial condition for the next lower G. Similarly, in in-phase branch, the solution at a lower G is used as the initial condition for the next higher G. The flow past cylinder-pair at constant Reynolds num- ber (Re = 100) retains anti-phase vortex shedding syn- chronized forms at high gap ratio (), as indicated by our extracted data on Table 3(a). Once G is decreased to G = 2.06, the anti-phase vortex shedding flow transits to the in-phase synchronized vortex shed- ding form. For clarity, the existence of the anti-phase vortex shedding flow pattern at Re = 100, and G = 2.32 is exhibited in Figure 3. It reveals clearly the anti-phase vortex shedding behavior of the simulated flow in the sub-domain x = [−5, 50], y = [−9, 9]. The continuation of zero central-line velocity (Figure 3(d)), and perfectly anti-phase synchronized growth of the lift (CL,1, CL,2) coefficients (Figures 3(b) and (c)) ensure the inherent anti-phase characteristic of vortex shedding (Figure 3(a)) in the wake. Note that, unlike for in-phase vortex shed- ding flow (Figure 4), the equal but opposite natured variations of CL,1 and CL,2 in the present case contribute to the continued vanishing of CL,1+2 (Figure 3(d)) during the entire time-evolution. 2.08 3.0G Upon maintaining anti-phase synchronized vortex shed- ding forms with the past findings related to side-by-side cylinder-pair (Re = 100, ), once the gap- ratio was subsequently increased (from 2.08 3.0G 2.0G ), the in-phase synchronized vortex shedding were encountered behind the cylinder-pair (Re = 100, ). The distinguishable physical characteristics associated with the in-phase vortex shedding flows past the cylinder-pair at Re = 100 and again G = 2.32 is extracted in Figure 4. It can be noted from the figure that the gap-flow quickly lost stability; however, the shedding vortices appeared clearly in-phase synchronized at least up to x ≤ 12. Thereafter, instability is seen to quickly grow, leading to the development of a combined binary vortex street within 12 < x <26, and beyond that there occurred an irregular flow pattern over a conversion point. Physical details of this in-phase flow in terms of enhanced CL,1+2, and significantly modulated transient evolution (in-phase) of individual lift (CL,1 and CL,2) coefficients are extracted in Figures 4(d), (b) and (c). 2.0 2.58G 3.3. Hysteresis Loop From the simulated data on Table 3, the reader may note that at constant Reynolds number (Re = 100), the anti- Copyright © 2013 SciRes. JMP  Y. F. PENG 93 phase branch ranges between , and the in-phase branch ranges between . In the other word, the anti-phase and in-phase synchronized forms behind a pair of circular cylinders (Re = 100) can co-exist at . The co-existences of the anti-phase and in-phase vortex shedding flow patterns (at Re = 100 and G = 2.32) have been shown in Figures 3 and 4, respectively. Figures 3(a) and 4(a) reveal the anti-phase and in-phase synchronized vortex shedding forms, respectively, by iso-vorticity plots of the flows. The persistence of symmetric flow nature (having zero time mean central-line transverse velocity and lift-coefficient) in both anti-phase and in-phase vortex shedding flows are clearly reflected by the time histories of ,1 2L 2.08 3.00G 2.0 2.58G 2.08 2.58G C (Figures 3(d) and 4(d)). However, an enlarged view of individual lift- coefficients (, ) for the upper and the lower ,1L C,2L C Table 3. (a). Numerical results of flow past a pair of side- by-side circular cylinders by decreasing G slowly (Re = 100). * denotes the computed case where transition is happen; (b) Numerical results of flow past a pair of side-by-side circular cylinders by increasing G slowly (Re = 100). * denotes the computed case where transition is happen. (a) No. G Re ,1.5Cx V ,12L C T Flow type 1 3.00 100 0.0 0.0 5.54 T,S,VP A 2 2.60 100 0.0 0.0 5.13 T,S,VP A 3 2.56 100 0.0 0.0 5.13 T,S,VP A 4 2.54 100 0.0 0.0 5.13 T,S,VP A 5 2.52 100 0.0 0.0 5.13 T,S,VP A 6 2.50 100 0.0 0.0 5.12 T,S,VP A 7 2.48 100 0.0 0.0 5.12 T,S,VP A 8 2.46 100 0.0 0.0 5.11 T,S,VP A 9 2.44 100 0.0 0.0 5.11 T,S,VP A 10 2.42 100 0.0 0.0 5.09 T,S,VP A 11 2.40 100 0.0 0.0 5.06 T,S,VP A 12 2.38 100 0.0 0.0 5.09 T,S,VP A 13 2.36 100 0.0 0.0 5.09 T,S,VP A 14 2.34 100 0.0 0.0 5.10 T,S,VP A 15 2.32 100 0.0 0.0 5.08 T,S,VP A 16 2.30 100 0.0 0.0 5.04 T,S,VP A 17 2.28 100 0.0 0.0 5.08 T,S,VP A 18 2.26 100 0.0 0.0 5.06 T,S,VP A 19 2.24 100 0.0 0.0 5.09 T,S,VP A 20 2.22 100 0.0 0.0 5.04 T,S,VP A 21 2.20 100 0.0 0.0 5.03 T,S,VP A 22 2.18 100 0.0 0.0 5.05 T,S,VP A 23 2.16 100 0.0 0.0 5.04 T,S,VP A 24 2.14 100 0.0 0.0 5.08 T,S,VP A 25 2.12 100 0.0 0.0 5.04 T,S,VP A 26 2.10 100 0.0 0.0 5.02 T,S,VP A 27 2.08 100 0.0 0.003 5.00 T,S,VP A 28* 2.06 100 0.0 0.659 5.21 T,S,VP I 29 2.04 100 0.0 0.665 5.21 T,S,VP I (b) No. G Re ,1.5Cx V ,12L C T Flow type 30 2.02100 0.0 0.665 5.18 T,S,VP I 31 2.04100 0.0 0.665 5.21 T,S,VP I 32 2.06100 0.0 0.659 5.21 T,S,VP I 33 2.08100 0.0 0.651 5.19 T,S,VP I 34 2.10100 0.0 0.563 5.15 T,S,VP I 35 2.12100 0.0 0.664 5.20 T,S,VP I 36 2.14100 0.0 0.664 5.22 T,S,VP I 37 2.16100 0.0 0.659 5.21 T,S,VP I 38 2.18100 0.0 0.651 5.19 T,S,VP I 39 2.20100 0.0 0.564 5.15 T,S,VP I 40 2.22100 0.0 0.664 5.20 T,S,VP I 41 2.24100 0.0 0.665 5.19 T,S,VP I 42 2.26100 0.0 0.660 5.20 T,S,VP I 43 2.28100 0.0 0.653 5.20 T,S,VP I 44 2.30100 0.0 0.566 5.15 T,S,VP I 45 2.32100 0.0 0.665 5.20 T,S,VP I 46 2.34100 0.0 0.666 5.20 T,S,VP I 47 2.36100 0.0 0.662 5.20 T,S,VP I 48 2.38100 0.0 0.655 5.20 T,S,VP I 49 2.40100 0.0 0.569 5.16 T,S,VP I 50 2.42100 0.0 0.667 5.20 T,S,VP I 51 2.44100 0.0 0.669 5.20 T,S,VP I 52 2.46100 0.0 0.665 5.20 T,S,VP I 53 2.48100 0.0 0.658 5.20 T,S,VP I 54 2.50100 0.0 0.572 5.13 T,S,VP I 55 2.52100 0.0 0.670 5.20 T,S,VP I 56 2.54100 0.0 0.672 5.20 T,S,VP I 57 2.56100 0.0 0.668 5.20 T,S,VP I 58 2.58100 0.0 0.662 5.20 T,S,VP I 59* 2.60100 0.0 0.0 5.13 T,S,VP A 0 10203040 -9 -6 -3 0 3 6 9 y G = 2.32, Re = 100 (a) -0.40 0.00 0.40 0.80 CL,1 (b) -0.80 -0.40 0.00 0.40 CL,2 (c) 7005 7020 7035 7050 t -0.15 -0.10 -0.05 0.00 0.05 0.10 0.15 CL,1+2 (d) Figure 3. The simulated anti-phase flow at G = 2.32 and Re = 100. (a) Observed anti-phase flow pattern. Time-histories of: (b) CL,1(t); and (c) CL,2(t). (d) Vanishing of the combined lift- coefficient CL,1+2. Copyright © 2013 SciRes. JMP  Y. F. PENG 94 0 10203040 -9 -6 -3 0 3 6 9 y G = 2.32, Re = 100 (a) 11440 11456 11472 11488 t -0.80 -0.40 0.00 0.40 0.80 C L,1+2 (d) -0.40 -0.20 0.00 0.20 0.40 0.60 C L,1 (b) -0.60 -0.40 -0.20 0.00 0.20 0.40 C L,2 (c) Figure 4. The simulated periodic in-phase flow at G = 2.32 and Re = 100. (a) In-phase vortex shedding behavior. Time-histories of: (b) CL,1(t); and (c) CL,2(t). (d) Enhance- ment of the combined lift-coefficient CL,1+2. 1.8 2.0 2.2 2.4 2.6 2.8 3.0 G -0.2 0.0 0.2 0.4 0.6 0.8 1.0 1.2 C L,1+2 : byincreasingG gradually : by decreasing G gradually the in-phase branch the anti-phase branch Figure 5. The hysteresis region with G of in-phase and anti- hase synchronized vortex shedding forms for flows past a pair of circular cylinders at Re = 100. cylinders (Figures 3(b) and (c)/Figures 4(b) and (c)) reveals occurrence of anti-phase/in-phase vortex shed- ding vortices of the upper and lower vortex streets. Readers may note that the corresponding lift-amplitudes (,12 ) in anti-phase vortex shedding flows become neutralized as shown in Figure 3(d), on the contrary, the corresponding lift-amplitudes () in in-phase vortex shedding flows become enhanced as shown in Figure 4(d), respectively. Since the value ofstands as a characteristic value of anti-phase/in-phase synchronized vortex shedding forms, it is worthy to show the L C ,1 2L C ,1 2L C ,1 2L C distributions. As shown in Figure 5, the ,1 2L C distri- bution along the anti-phase branch (,1 2 C) combines the in-phase branch ( 0 L ,1 2L C0 ) becomes a hysteresis loop. Particularly, the anti-phase branch starting from G = 3.0 trace along a straight segment, ending at G = 2.08, and then merges to the in-phase branch. While the in- phase branch starting from G = 2.0 trace along a wavy line, ending at G = 2.58, and then merges to the anti-phase branch. 4. Conclusions Numerical results have been presented for the in-phase and anti-phase vortex shedding synchronized forms of flows behind a pair of side-by-side circular cylinders. Flows are restricted in low-Reynolds-number (Re 100) laminar regime for various small/middle gap ratio (0.23.0G ). The computations have been carried out in two-dimensional, using a high resolution numerical method based on a nested Cartesian grid formulation, in combination with an effective immersed boundary method and a two-step fractional-step procedure. Hysteresis phenomenon of the in-phase/anti-phase vortex shedding synchronized forms of flows has been studied in detail. For flows behind a pair of side-by-side circular cylinders at Re = 100, the hysteresis loop with width ranges between is clearly found. 2.08 2.58G 5. Acknowledgements This work was supported in part by the National Science Council of the Republic of China (Taiwan) under Con- tract No. NSC 101-2221-E-260-038-. REFERENCES [1] H. M. Spivac, “Vortex Frequency and Flow Pattern in the Wake of Two Parallel Cylinders at Varied Spacing Nor- mal to An Airstream,” Journal of the Aeronautical Sci- ences, Vol. 13, 1946, pp. 289-301. [2] P. W. Bearman and A. J. Wadcock, “The Interference between A Pair of Circular Cylinders Normal to A Stream,” Journal of Fluid Mechanics, Vol. 61. No. 3, 1973, pp. 499-511. doi:10.1017/S0022112073000832 [3] M. M. Zdravkovich, “Review of Flow Interference Be- tween Two Circular Cylinders in Various Arrangements,” ASME, Vol. 99, No. 4, 1977, pp. 618-633. doi:10.1115/1.3448871 [4] C. H. K. Williamson, “Evolution of a Single Wake behind A Pair of Bluff Bodies,” Journal of Fluid Mechanics, Vol. 159, 1985, pp. 1-18. doi:10.1017/S002211208500307X [5] H. J. Kim and P. A. Durbin, “Investigation of the Flow between a Pair of Circular Cylinders in the Flopping Re- gime,” Journal of Fluid Mechanics, Vol. 196, 1988, pp. 431-448. doi:10.1017/S0022112088002769 [6] D. Sumner, S. S. T. Wong, S. J. Price and M. P. Päidous- sis, “Fluid Behavior of Side-by-side Circular Cylinders in Steady Cross-flow,” Journal of Fluids and Structures, Vol. 13. No. 3, 1999, pp. 309-339. doi:10.1006/jfls.1999.0205 Copyright © 2013 SciRes. JMP  Y. F. PENG Copyright © 2013 SciRes. JMP 95 [7] Y. Zhou, H. J. Zhang and M. W. Yiu, “The Turbulent Wake of Two Side-by-side Circular Cylinders,” Journal of Fluid Mechanics,Vol. 458, 2002, pp. 303-332. doi:10.1017/S0022112002007887 [8] S. J. Xu, Y. Zhou and R. M. C. So, “Reynolds Number Effects on the Flow Structure behind Two Side-by-side Cylinders,” Physics of Fluids, Vol. 15. No. 5, 2003, pp. 1214-1219. doi:10.1063/1.1561614 [9] S. Kang, “Characteristics of Flow over Two Circular Cylinders in A Side-by-side Arrangement at Low Rey- nolds Numbers,” Physics of Fluids, Vol. 15, 2003. [10] S. Kumar, B. Gonzalez and O. Probst, “Flow Past Two Rotating Cylinders,” Physics of Fluids, Vol. 23, No. 1, 2011, 01402. doi:10.1063/1.3528260 [11] Md Mahbub Alam, Y. Zhou, and X. W. Wang, “The Wake of Two Side-by-side Square Cylinders,” Journal of Fluid Mechanics, Vol. 669, 2011, pp. 432-471. doi:10.1017/S0022112010005288 [12] D. Sumner, “Two Circular Cylinders in Cross-flow: A Review,” Journal of Fluids and Structures, Vol. 26. No. 6, 2010, pp. 849-899. doi:10.1016/j.jfluidstructs.2010.07.001 [13] J. Mizushima and Y. Ino, “Stability of Flows Past A Pair of Circular Cylinders in A Side-by-side Arrangement,” Journal of Fluid Mechanics, Vol. 595, 2008, pp. 491-507. doi:10.1017/S0022112007009433 [14] Y. F. Peng, A. Sau, R. R. Hwang, W. C. Yang and C. M. Hsieh, “Criticality of Flow Transition behind Two Side-by-side Elliptic Cylinders,” Physics of Fluids, Vol. 24. No. 3, 2012, 034102. doi:10.1063/1.3687450 [15] Y. F. Peng, R. Mittal, A. Sau and R. Hwang, “Ested Car- tesian Grid Method in Incompressible Viscous Fluid Flow,”Journal of Computational Physics, Vol. 229, No.19, 2010, pp. 7072-7101. doi:10.1016/j.jcp.2010.05.041 [16] M. Provansal, C. Mathis and L. Boyer, “Be’nard-von Ka’rma’n Instability: Transient and Forced Regimes,” Journal of Fluid Mechanics, Vol. 182, 1987, pp. 1-22. doi:10.1017/S0022112087002222 [17] C. H. K. Williamson, “Oblique and Parallel Modes of Vortex Shedding in the Wake of a Circular Cylinder at Low Reynolds Numbers,” Journal of Fluid Mechanics, Vol. 206, 1989, pp. 579-627. doi:10.1017/S0022112089002429 [18] C. Norberg, “An Experimental Investigation of the Flow around a Circular Cylinder: Influence of Aspect Ratio,” Journal of Fluid Mechanics, Vol. 258, 1994, pp. 287-316. doi:10.1017/S0022112094003332 [19] C. P. Jackson, “A Finite-element Study of the Onset of Vortex Shedding in Flow past Variously Shaped Bodies,” J ournal of Fluid Mechanics, Vol. 182, 1987, pp. 23-45. doi:10.1017/S0022112087002234 [20] B, Kumar and S. Mittal, “Effect of Blockage on Critical Parameters for Flow past A Circular Cylinder,” Interna- tional Journal for Numerical Methods in Fluids, Vol. 50. No. 8, 2006, pp. 987-1001. doi:10.1002/fld.1098 [21] J. Dusek, P. Le Gal and P. Fraunie, “A Numerical and Theoretical Study of the First Hopf Bifurcation in A Cyl- inder Wake,” Journal of Fluid Mechanics, Vol. 264, 1994, pp. 59-80. doi:10.1017/S0022112094000583
|