Paper Menu >>
Journal Menu >>
 J. Service Science & Management, 2010, 3, 501-511 doi:10.4236/jssm.2010.34057 Published Online December 2010 (http://www.SciRP.org/journal/jssm) Copyright © 2010 SciRes. JSSM 501 Cross-Border Bean Market Performance in Western Kenya and Eastern Uganda Lianda Wanyonyi Mauyo 1, Jonas N. Chianu 2, Bernard Kibet Nassiuma 3, Richard Onyango Musebe 4 1Masinde Muliro University of Science and Technology, Eldoret, Kenya; 2Tropical Soil Biology and Fertility institute of CIAT (TSBF-CIAT), Nairobi, Kenya; 3Department of Quantitative Skills and Entrepreneurship Studies, Moi University, Eldoret, Kenya; 4Department of Development Studies, Moi University, Eldoret, Kenya. Email: lmauyo@yahoo.com Received August 12th, 2010; revised September 20th, 2010; accepted October 28th, 2010. ABSTRACT Common bean (Phaseolus vulgaris) is an important grain legume in East Africa, providing food and income to rural household s. Smallholder farmers in Kenya and Uganda have widely adopted improved varieties. The de mand for com- mon bean in Kenya outstrips domestic supply – hence the need for imports. There is significant border trade on com- mon bean between Kenya and Uganda. Th is study assesses the efficiency of this trade and evaluates th e performance of common bean marketin g as well as the associa ted tran sport system. Purp osive, multistage and systematic random sam- pling methods were used to select the 210 respondents for the study. SPSS was used for data analysis. Results indicate huge inefficiency in common bean marketing in Kenya and Uganda due to poor road infrastructure and high transac- tion costs (mostly due to transport costs). Primary market traders incurred a significantly higher cost than terminal market traders. Generally, Ugandan traders operated at relatively higher efficiency than Kenyan traders. However, all the traders made profits far in excess of their common bean transfer costs. The study recommends regional market, in- frastructural, and institutional development as well as the abolition of illegal fees in order to improve bean market effi- ciency in the study area and similar environments. Keywords: Bean, Cross-border Marketing, Marketing Costs, Market Performance, Government Levies 1. Introduction Common bean (Phaseolus vulgaris) is a major food crop to people of all household income categories in many parts of sub-Saharan Africa, especially in Eastern Africa [1]. It is a major source of dietary protein and household cash income to the poor and small-scale farmers in East- ern and Southern Africa [2]. In Kenya, common bean is the most important pulse and second only to maize (Zea mays) as a food crop [3]. National annual demand for common bean in Kenya has been estimated at about 500,000 metric tons, as compared to annual domestic production, estimated at about 125,000 metric tons (or about 25% of domestic demand) [3]. The demand for common bean in Kenya is much more than local supply, which is then often supplemented with the imports, mostly from Uganda and Tanzania [2]. The total area cultivated to common bean in Kenya was estimated at 500,000 ha, leading to actual yield of ~250 kg ha-1, most often under intercropping or mixed cropping systems [3]. In pure stands (although not a common practice), yields of as high as 700 kg ha-1 have been reported under farmer management conditions [3]. This is still low when com- pared with a yield potential of up to 5000 kg ha-1 [4]. Such high yields have already been achieved in Mexico under field conditions [5]. Another estimate of Kenya’s common bean deficit put it at about 200,000 metric tons [6]. The average annual official imports are 1,500 metric tons, while the annual imports not recorded by the cus- toms authorities were estimated at about 9,300 metric tons [7]. Th is has resu lted in a sig nificant bord er trade on common bea n bet we en Kenya and Uga n da [ 1] . The consumption of common bean in Eastern and Southern Africa exceeds 50 kg person-1 year-1, reaching 66 kg person-1 year-1 in parts of Kisii district of Kenya [1]. Common bean contributes about 30% of the dietary energy in Eastern and Southern Africa [8]. In Uganda, common bean is a popular and major source of food se- curity. It is readily available for both urban and the rural populations. The consumption of common bean in Uganda was estimated at ~29 kg capita-1 annum-1 [9].  Cross-Border Bean Market Performance in Western Kenya and Eastern Uganda 502 More recent studies, however, show that per capita con- sumption of common bean in Nabongo area of Uganda was about 58 kg capita-1 annum-1 [10]. Common bean provides about 25% of total calories and about 45% of the proteins in the diet of many Ugandans [11]. Besides, it is an important source of income (from domestic de- mand and exports) to Uganda farm households [11]. In 1992, common bean ranked third in Uganda’s crop ex- port volume after coffee and cotton and fourth in the country’s crop export value after coffee, cotton, and to- bacco [2]. The poor rural road infrastructure results in inefficient common bean marketing system, hindering access to markets by the operators in the bean value chain in East- ern Africa. An efficient marketing system is an important means of raising the incomes of farm families and an important way of providing the dietary protein needs of the people of East Africa. Besides, such a system facili- tates efficient allocation of production and consumption resources. Higher productivity is essential for th e genera- tion of surpluses for marketing within and across Eastern Africa. Hence the need to examine the market perform- ance of common bean and to assess the transport status in the marketing of common bean in the border districts of Western Kenya and Eastern Uganda. 2. Methodology 2.1. The Study Area This study was carried out in Bungoma and Busia dis- tricts of western Kenya and in Mbale and Kapchorwa districts of eastern Uganda. Bungoma district is one of the eight districts in the Western province of Kenya. In this study, the administrative boundaries of the lager Bungoma were used. Mixed farming system (crop and livestock) is the common practice in Bungoma district. Bungoma district soils are suitable for various types of crops including maize, finger millet, sorghum, upland rice, sweet potatoes, cassava, groundnuts, sesame, beans, coffee, sugarcane, cotton, sunflower and tobacco. Mean annual rainfall varies between 1250 mm to 1800 mm. Bungoma has bimodal rainfall distribution. However, most farming activities occur during the long rains (peaking in April–May each year). Seasonal distribution of rainfall is 500-1000 mm during the long rainy season and 430-800 mm during the short rainy season (often with 60-70% reliability). Mean annual temperatures in Bungoma district varies from 21 to 25oC. Bungoma dis- trict has good road and railway networks. These are im- portant for farm produce transportation and marketing [12]. Like Bungoma, Busia district is one of the eight districts that form the Western province of Kenya. The administrative boundaries of the larger Busia district (in- cluding the present Teso district) were used. Again like in Bungoma district, farmers in Busia district commonly practice mixed farming. The district has 924,200 hectares (924 sq km) of agricultural. However, only 40,000 hec- tares (or ~4.3%) are under crop production. The rest are fallow lands (including bushes), swamps or bare land. Common farm sizes in Busia district range from 2 to 10 hectares. Like Bungoma district, Busia district has a bi- modal rainfall distribution (long rains: March-June; short rains: August-October). The mean annual rainfall in Busia district is 1500 mm with most parts of the district receiving between 1270 mm and 1790 mm. Annual mean maximum temperature ranges from 26 to 30o C while the annual mean minimum temperature ranges from 14 to 22oC. The food crops commonly grown on small scale farms in Busia district include maize, cassava, sorghum, finger millet, common bean, groundnuts, and rice. The major cash crops grown in Busia district are sugarcane, cotton, tobacco, and coffee. Like Bungoma district, Busia district has good road networks for produc t transportation as well as several markets where common bean are mar- keted [13]. Mbale district, formerly known as Bugisu district, is in Uganda. It borders three Uganda districts (Kapchorwa in the Northeast, Tororo in the Southwest, and Kumi in the Northwest) and the Republic of Kenya (Western Kenya) in the East. Sironko district in Uganda was carved out from Mbale district, but for the purpose of this study, the administrative boundaries of the former larger Mbale (including Sironko) were used to define Mbale district [14]. Land ownership here is largely based on customary tenure system. Agriculture in Mbale dis- trict is mostly subsistence because of land shortage [14]. The altitude ranges from 1,299 m to 1,524 m above sea level with sub-tropical type of climate. Mbale district receives an average of 1,191 mm of rainfall per annum. Economic activities in Mbale district are mainly agricul- ture with emphasis on: food crops (common bean, maize, groundnut, sweet potatoes, cassava, bananas, soyabeans, sorghum, yams, and rice on a low scale), cash crops (coffee and cotton), and vegetables (tomatoes, onions, and cabbages). The district has enormous potential for tourism due to the existence of Mt. Elgon National park, Mt. Elgon-Sipi falls and the mountainous landscape. The highland terrain hinders modernisation of agriculture. Apart from hilly areas (where transportation is a problem during the rainy season), Mbale district has good road networks. It als has several markets for agricultural pro- duce marketing [14]. Kapchorwa district is in Uganda and borders three Ugandan districts (Mbale in the south, Kumi in the west, and Moroto in the north) and Republic of Kenya (West Kenya) in the east [14]. Most farmers here practice mixed farming. Land tenure is customary and land has been greatly fragmented. Kapchorwa dis- Copyright © 2010 SciRes. JSSM  Cross-Border Bean Market Performance in Western Kenya and Eastern Uganda503 trict soils are suitable for production of most crops in- cluding food crops (maize, common bean, wheat, sun- flower, groundnuts, yams, field peas, cassava, Irish pota- toes and finger-millet), cash crops (coffee, cotton and wheat), and fruits and vegetables (cabbages, tomatoes, passion fruits and onions). However, agriculture is prac- ticed on a small scale without the use of tractors. Kap- chorwa district is mountainous with poor road and trans- port networks, making the district inaccessible, espe- cially during rainy seasons [14]. 2.2. Data Collection, Sources and Analysis Primary data collection, from 104 common bean farmers and 106 common bean traders, using structured ques- tionnaires took place between March and June 2002. Secondary data were also used. Some of the key vari- ables covered in the questionnaire for common bean farmers include: gender, age, education level, family size, land size, farm enterprises, acreage planted, source of technical information, amount harvested, amount sold, amount consumed place of sale and mode of transport. With respect to the questionnaire for common bean trad- ers, the variables covered include: gender, age, education level of trader, type of market, type of marketing agent, source of bean supply, quantity bought/sold, price per unit, mode of transport, transport cost and market infor- mation. Data analyses were carried out using the Statis- tical Package for Social Sciences [15] and Microsoft Ex- cel computer programs. 2.3. Sampling of Respondents While the study districts were selected purposively, the surveyed common bean farmers were selected using a multistage random sampling method. Systematic random sampling procedure was used to select common bean traders. Major wholesale and retail markets in the study area were identified and selected. Retail traders and wholesalers were identified using the volume of common bean they trade on per unit time. In every market the first respondent was picked arbitrarily then the next respon- dent was picked by ski p ping one. 2.4. Status of the Border Points Examined in the Study Lwakhakha: Although the Lwakhakha border point ac- counts for ~4% of the volume of the cross border export of common bean from Uganda to Kenya, it is a well- established border point. However, the road to the border point is poor, leading to generally low cargo traffic, a situation that often worsens during the rainy season. Th is border point also has a river barrier that often overflows its banks during the rainy season, further rendering the route impassable during such periods. Compared with the Lwakhakha border point, the Malaba border point is relatively busy, handling a sizeable amount of exports (including common bean) from Uganda to Kenya. This border also has a river barrier. Despite this, however, the level of trade (especially informal trade) at this point is quite significant. Busia border point has no physical bar- rier. The only forms of barrier are the local councils (LCs) that have instituted local taxes at the unofficial crossing points on the Ugandan side. Even though it is the least developed of the three border points, it happens to be the busiest, handling large volumes of exports of common bean (and probably other commodities) from Uganda to Kenya. 3. Results and Discussion 3.1. Formal Export Procedures Uganda side: The Ministry of Agriculture, Animal In- dustry and Fisheries (MAAIF), Kampala, Uganda is the government machinery that controls the import and ex- port of plant materials in Uganda. For any trader to ex- port common bean and other plant materials from Uganda into Kenya, MAAIF requires 1) Plant import permit from importing country (Kenya); 2) Phytosanitary certificate (the fee of which was Ushs1 2000 or Kshs2 85 per consignment); and 3) Letter of request for exporta- tion (indicating the importer, the exporter and their busi- ness addresses). For the Kenya side, the Kenya plant Health Inspectorate Service (KEPHIS) is the Kenyan government agency that regulates plant imports and ex- ports. For common bean imports to be formally allowed into Kenya or out of it, KEPHIS requires phytosanitary certificate (involving some fee) to confirm that the con- signment has been inspected in Uganda and is free of pests and diseases. The other fees include: 1) Import Duty Fee (IDF) paid to customs (Kshs 5,000 per con- signment), 2) Horticultural Development Authority (HCDA) levy (at the rate of Kshs 1 kg-1 of product; charged on common beans, oranges, bananas and onions), and 3) Import duty (at 3.5% of value of produce or agri- cultural commodity). Countries, which are members of the Common Market for Eastern and Southern Africa (COMESA), pay 90% less than the rate applied to import goods from non–COMESA countries. However, at the end of this survey it was established that the levies by HCDA have since been withdrawn. 3.2. Volume of Cross-Border Common Bean Trade The trend in cross-border formal and informal exports of common bean from Uganda to Kenya between 1990 and 1998 is presented in Table 1. Formal export of common 1Ushs means Uganda Shillings ;2Ks h s means Kenya Shillings Copyright © 2010 SciRes. JSSM  Cross-Border Bean Market Performance in Western Kenya and Eastern Uganda Copyright © 2010 SciRes. JSSM 504 bean (Uganda to Kenya) increased from 1990 to 1991, decreased from 1992 to 1993, increased in 1994, de- creased in 1995, and increased again from 1996 to 1998. The fluctuation of formal exports to Kenya was partly due to Uganda government’s stringent policy of impos- ing lengthy documentation procedures and customs duty on common bean exports. This scenario discouraged formal cross-border bean trade and lead to most common bean traders evading formal export procedures and cus- toms duty. With respect to the informal common bean export, it steadily increased between 1990 and 1992, de- creased in 1993, increased in 1994, decreased in 1995, increased in 1996, and slightly decreased in 1997 and again in 1998. During the time when formal common bean exports were increasing from 1996 to 1998, infor- mal common bean exports were declining. The explana- tion to this scenario is that the formal bean exports in- crease was attributed to improved trade relations, the strengthening o f the East African Common market at the time and the lifting of export ban to Kenya. Overall, the total annual export of common bean from Uganda to Kenya ranged fro m a low value of 5,341 MT (in 1995) to a high value of 36,678 MT (1992) with a mean of ~14,878 MT across years (1990 to 1998). For the formal export of common bean, the figure ranged from a low value of 678 MT (in 1993) to 3,343 MT (1994) with a mean of ~2,142 MT. For the informal export of common bean, the figure ranged from 4,663 MT (in 1995) to 34,955 MT (1992) with a mean of ~12,791 MT. Across the years while the average formal export volume of common bean (Uganda to Kenya) accounted for ~15% of the total common bean export, the informal export vol- ume accounted for ~84% of the total. Based on 1999 estimate, of the three border points examined, Busia ranked top in volume of common bean cross border ex- port (formal and informal) route (accounting for ~70%), followed by Malaba (~26%) and Lwakhakha (~4%) [16]. The result presented in Table 2, and based on the work of Foodnet examining formal and informal common bean export from Uganda to Kenya from four border points (including Suam) [17], further supports the supremacy of the common bean export transactions through the Busia border point compared to the other three border points. However, this 2000 data show that formal export ac- counted for about 55.4% of the total export of common bean from Uganda to Kenya. The situation reverted again in 2001 with infor mal export accounting for ~72% of the total common bean export volume from Uganda to Kenya [17]. The informal trade thrives due in part to the physical nature of the border points, the reluctance on the part of customs officials to record “small” transactions, the lengthy documentation procedures and the reluctance of the traders to pay “high” clearance fees. The commonly higher estimates of the informal volume of cross-border trade on common bean compared with the formal volume is an indication of serious leakage that significantly con- tributes to incorrect Gross Domestic product (GDP) val- ues in Uganda and Kenya, especially the former. Strengthening of the East African co-operation initiatives will help to forestall this anomaly. 3.3. Marketing Margins In Uganda, we delineated four players (middlemen, Table 1. Trend in cross-border export of common bean: Uganda to Kenya (1990-1998). Year Formal (Mt) % of total Informal (Mt) % of total Total (Mt) 1990 2,132 24.4 6,593 75.6 8,725 1991 2,855 13.6 18,165 86.4 21,022 1992 1,723 4.7 34,955 95.3 36,678 1993 767 8.6 8,112 91.4 8,879 1994 3,343 23.9 10,659 76.1 14,002 1995 678 2.7 4,663 87.3 5,341 1996 2,442 17.7 11,372 82.3 13,314 1997 2,592 19.6 10,658 80.4 13,250 1998 2,743 21.6 9,944 78.4 12,687 Total 19,275 136.8 115,121 753.2 133,898 Mean 2,142 15.2 12,791 83.7 14,878 Source: Agribusiness Development Center (AD C)/IDEA project, 2000 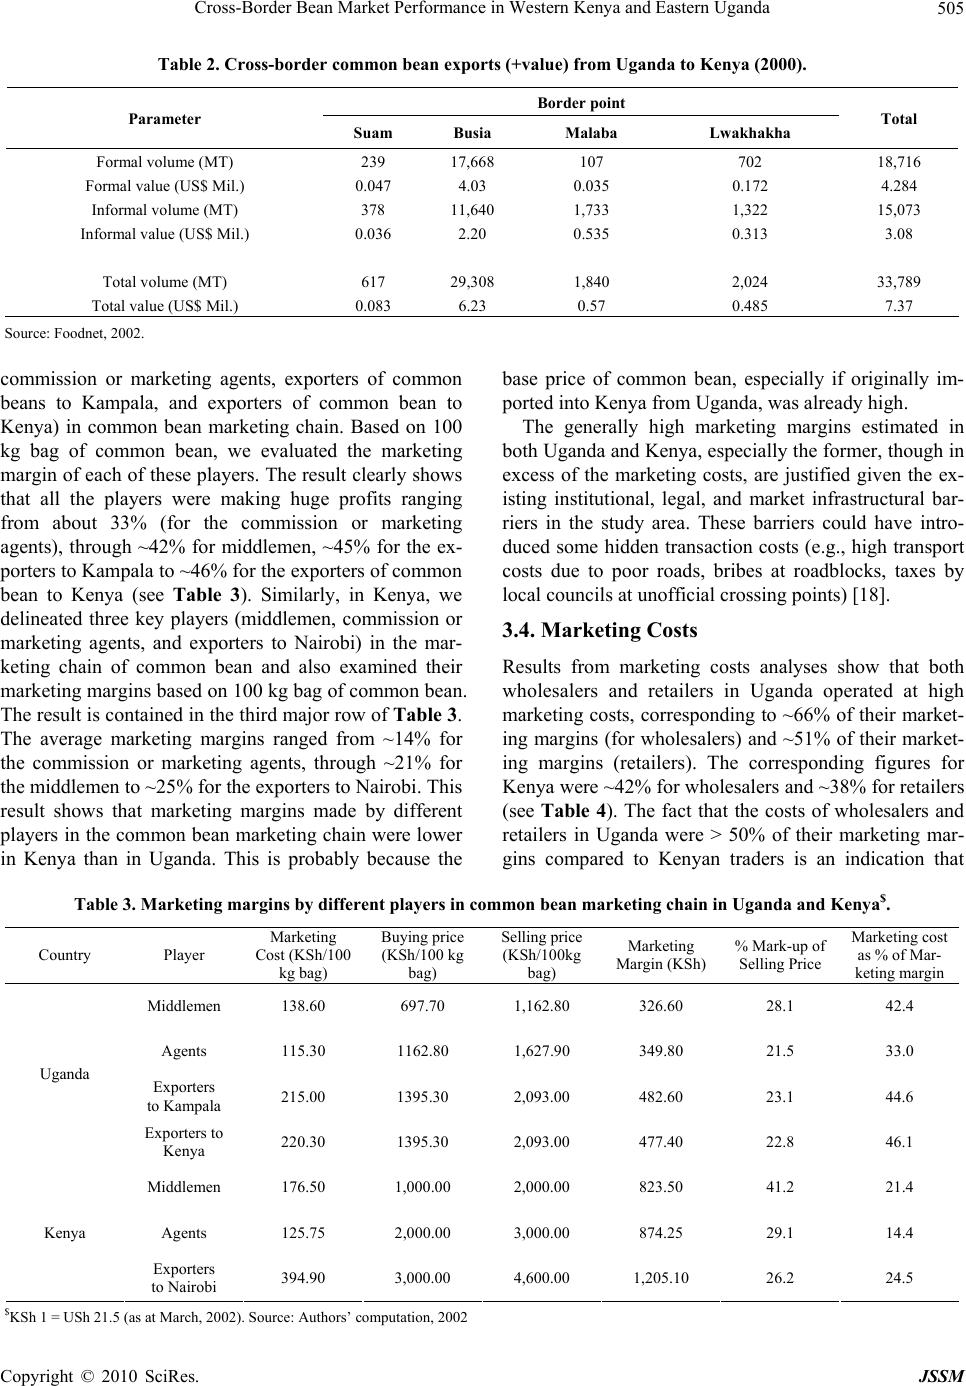 Cross-Border Bean Market Performance in Western Kenya and Eastern Uganda505 Table 2. Cross-border common bean exports (+value) from Uganda to Kenya (2000). Border point Parameter Suam Busia Malaba Lwakhakha Total Formal volume (MT) 239 17,668 107 702 18,716 Formal value (US$ Mil.) 0.047 4.03 0.035 0.172 4.284 Informal volume (MT) 378 11,640 1,733 1,322 15,073 Informal value (US$ Mil.) 0.036 2.20 0.535 0.313 3.08 Total volume (MT) 617 29,308 1,840 2,024 33,789 Total value (US$ Mil.) 0.083 6.23 0.57 0.48 5 7.37 Source: Foodnet, 2002. commission or marketing agents, exporters of common beans to Kampala, and exporters of common bean to Kenya) in common bean marketing chain. Based on 100 kg bag of common bean, we evaluated the marketing margin of each of these players. The result clearly shows that all the players were making huge profits ranging from about 33% (for the commission or marketing agents), through ~42% for middlemen, ~45% for the ex- porters to Kampala to ~46% for the exporters of common bean to Kenya (see Table 3). Similarly, in Kenya, we delineated three key players (middlemen, commission or marketing agents, and exporters to Nairobi) in the mar- keting chain of common bean and also examined their marketing margins based on 100 kg bag of common bean. The result is contained in the third major row of Tab le 3 . The average marketing margins ranged from ~14% for the commission or marketing agents, through ~21% for the middlemen to ~25% for the exporters to Nairobi. This result shows that marketing margins made by different players in the common bean marketing chain were lower in Kenya than in Uganda. This is probably because the base price of common bean, especially if originally im- ported into Kenya from Uganda, was already high. The generally high marketing margins estimated in both Uganda and Kenya, especially the former, though in excess of the marketing costs, are justified given the ex- isting institutional, legal, and market infrastructural bar- riers in the study area. These barriers could have intro- duced some hidden transaction costs (e.g., high transport costs due to poor roads, bribes at roadblocks, taxes by local councils at unofficial crossing points) [18]. 3.4. Marketing Costs Results from marketing costs analyses show that both wholesalers and retailers in Uganda operated at high marketing costs, corresponding to ~66% of their market- ing margins (for wholesalers) and ~51% of their market- ing margins (retailers). The corresponding figures for Kenya were ~42% for wholesalers and ~38% for retailers (see Table 4). The fact that the costs of wholesalers and retailers in Uganda were > 50% of their marketing mar- gins compared to Kenyan traders is an indication that Table 3. Marketing margins by different players in common bean marketing chain in Uganda and Kenya$. Country Player Marketing Cost (KSh/100 kg bag) Buying price (KSh/100 kg bag) Selling price (KSh/100kg bag) Marketing Margin (KSh)% Mark-up of Selling Price Marketing cost as % of Mar- keting margin Middlemen 138.60 697.70 1,162.80 326.60 28.1 42.4 Agents 115.30 1162.80 1,627.90 349.80 21.5 33.0 Exporters to Kampala 215.00 1395.30 2,093.00 482.60 23.1 44.6 Uganda Exporters to Kenya 220.30 1395.30 2,093.00 477.40 22.8 46.1 Middlemen 176.50 1,000.00 2,000.00 823.50 41.2 21.4 Agents 125.75 2,000.00 3,000.00 874.25 29.1 14.4 Kenya Exporters to Nairobi 394.90 3,000.00 4,600.00 1,205.10 26.2 24.5 $KSh 1 = USh 21.5 (as at M arch, 2002). Source: Authors’ com putation, 2002 Copyright © 2010 SciRes. JSSM 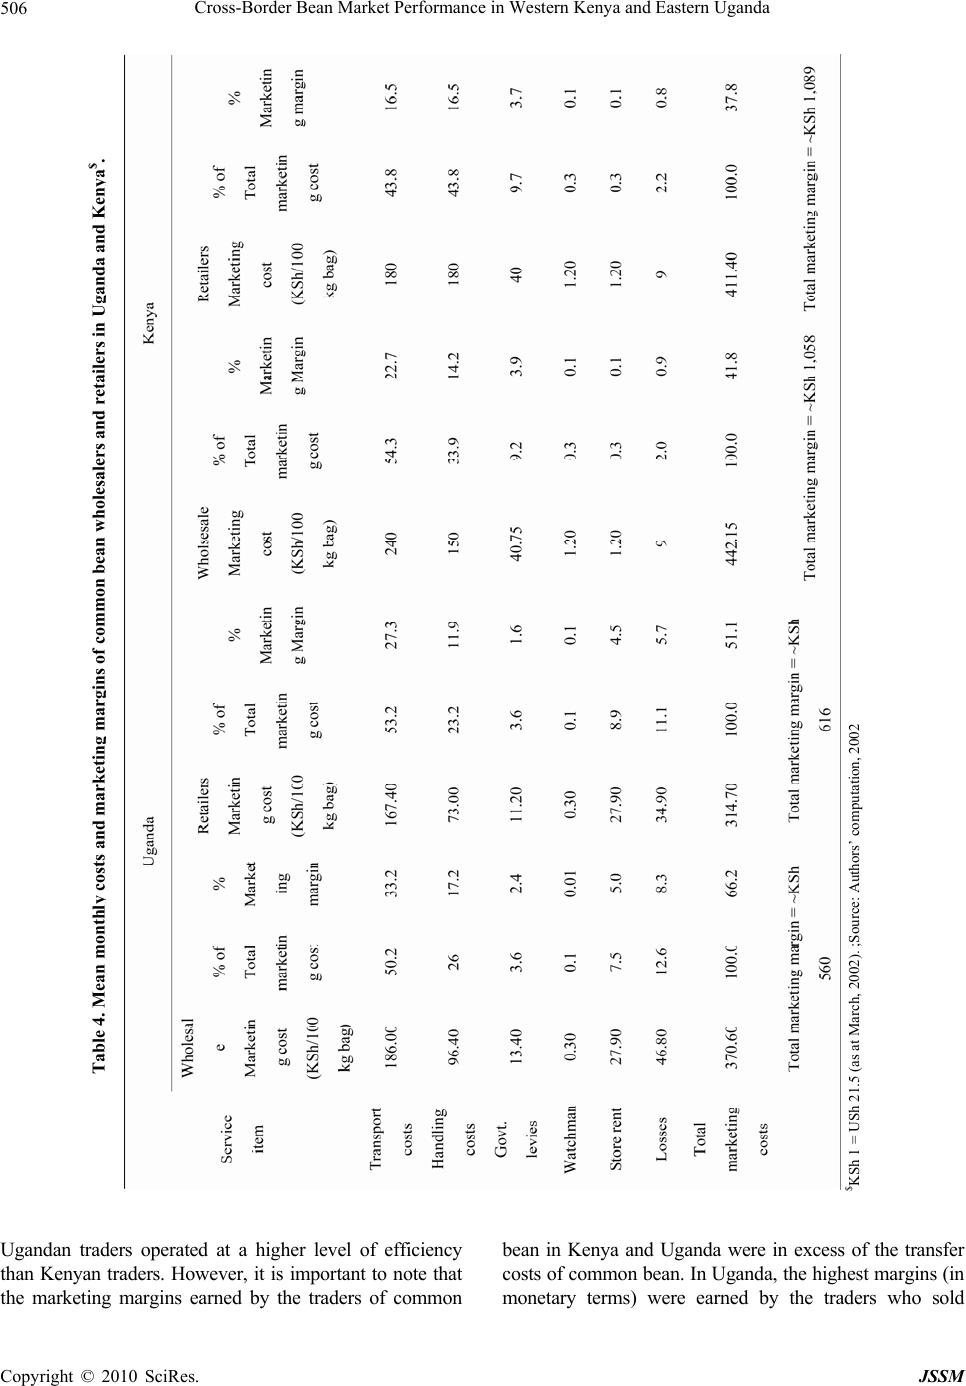 Cross-Border Bean Market Performance in Western Kenya and Eastern Uganda 506 Table 4. Mean monthl y costs and marketin g mar g ins of common bean wholesalers and retailers in U g anda and Ken y a$. $KSh 1 = USh 21.5 (as at Mar ch, 2002). ; Source: Authors’ compu ta tion, 2002 Ugandan traders operated at a higher level of efficiency than Kenyan traders. However, it is important to note that the marketing margins earned by the traders of common bean in Kenya and Uganda were in excess of the transfer costs of common bean. In Uganda, the highest margins (in monetary terms) were earned by the traders who sold Copyright © 2010 SciRes. JSSM 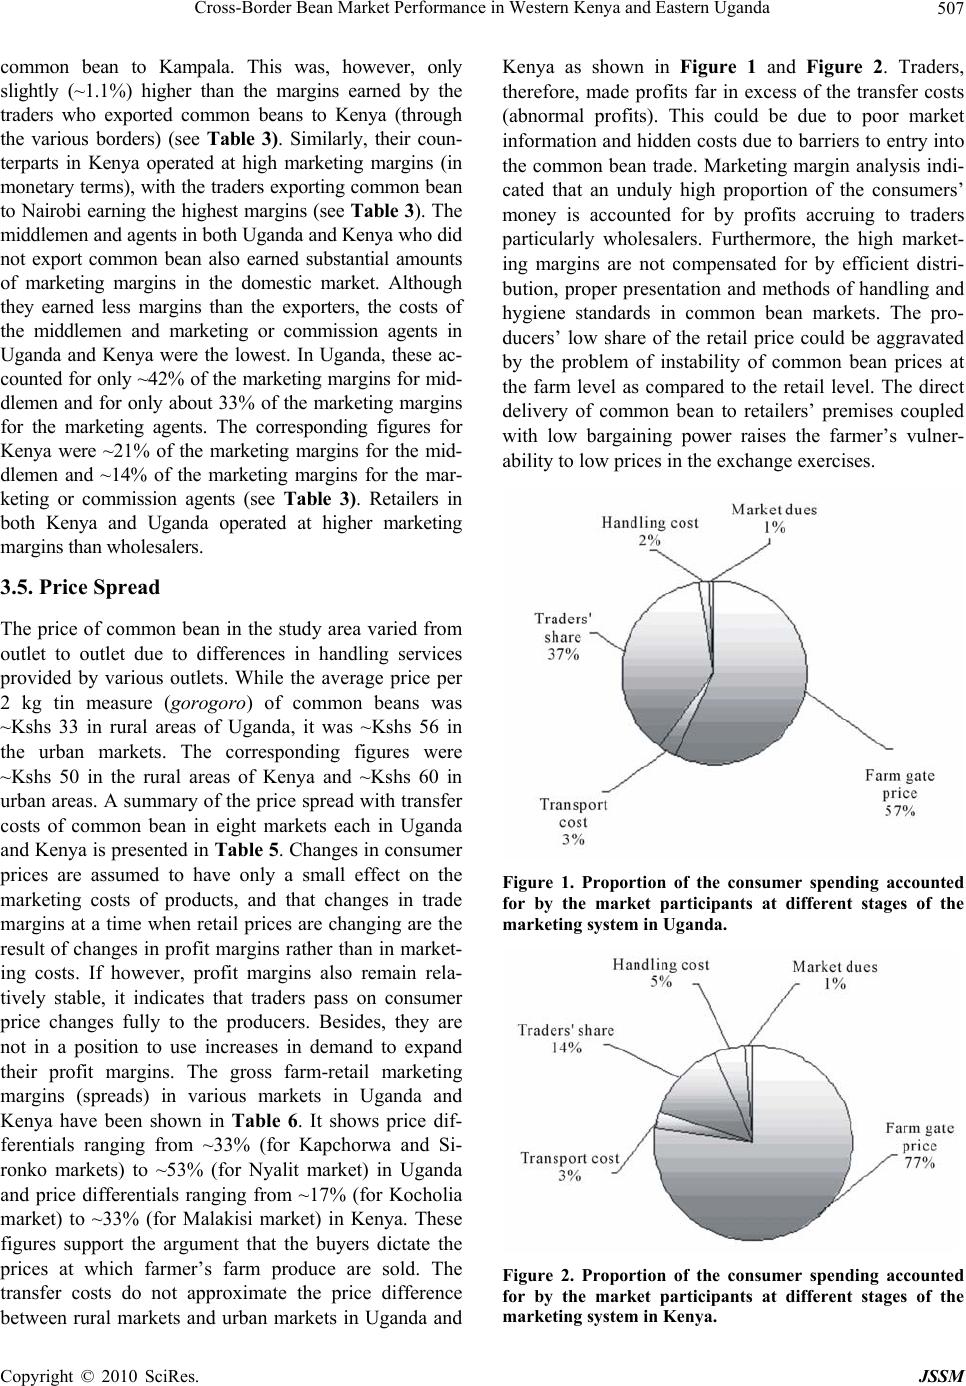 Cross-Border Bean Market Performance in Western Kenya and Eastern Uganda507 common bean to Kampala. This was, however, only slightly (~1.1%) higher than the margins earned by the traders who exported common beans to Kenya (through the various borders) (see Table 3). Similarly, their coun- terparts in Kenya operated at high marketing margins (in monetary terms), with the traders exporting common bean to Nairobi earning the highest margins (see Table 3). The middlemen and agents in both Uganda and Kenya who did not export common bean also earned substantial amounts of marketing margins in the domestic market. Although they earned less margins than the exporters, the costs of the middlemen and marketing or commission agents in Uganda and Kenya were the lowest. In Uganda, these ac- counted for only ~42% of the marketing margins for mid- dlemen and for only about 33% of the marketing margins for the marketing agents. The corresponding figures for Kenya were ~21% of the marketing margins for the mid- dlemen and ~14% of the marketing margins for the mar- keting or commission agents (see Table 3). Retailers in both Kenya and Uganda operated at higher marketing margins than wholesalers. 3.5. Price Spread The price of common bean in the study area varied from outlet to outlet due to differences in handling services provided by various outlets. While the average price per 2 kg tin measure (gorogoro) of common beans was ~Kshs 33 in rural areas of Uganda, it was ~Kshs 56 in the urban markets. The corresponding figures were ~Kshs 50 in the rural areas of Kenya and ~Kshs 60 in urban areas. A summary of the price spread with transfer costs of common bean in eight markets each in Uganda and Kenya is presented in Table 5. Changes in consumer prices are assumed to have only a small effect on the marketing costs of products, and that changes in trade margins at a time when retail prices are changing are the result of changes in profit margins rather than in market- ing costs. If however, profit margins also remain rela- tively stable, it indicates that traders pass on consumer price changes fully to the producers. Besides, they are not in a position to use increases in demand to expand their profit margins. The gross farm-retail marketing margins (spreads) in various markets in Uganda and Kenya have been shown in Table 6. It shows price dif- ferentials ranging from ~33% (for Kapchorwa and Si- ronko markets) to ~53% (for Nyalit market) in Uganda and price differentials ranging from ~17% (for Kocholia market) to ~33% (for Malakisi market) in Kenya. These figures support the argument that the buyers dictate the prices at which farmer’s farm produce are sold. The transfer costs do not approximate the price difference between rural markets and urban markets in Uganda and Kenya as shown in Figure 1 and Figure 2. Traders, therefore, made profits far in excess of the transfer costs (abnormal profits). This could be due to poor market information and hidden costs due to barriers to entry into the common bean trade. Marketing margin analysis indi- cated that an unduly high proportion of the consumers’ money is accounted for by profits accruing to traders particularly wholesalers. Furthermore, the high market- ing margins are not compensated for by efficient distri- bution, proper presentation and methods of handling and hygiene standards in common bean markets. The pro- ducers’ low share of the retail price could be aggravated by the problem of instability of common bean prices at the farm level as compared to the retail level. The direct delivery of common bean to retailers’ premises coupled with low bargaining power raises the farmer’s vulner- ability to low prices in the exchange exercises. Figure 1. Proportion of the consumer spending accounted for by the market participants at different stages of the marketing system in Uganda. Figure 2. Proportion of the consumer spending accounted for by the market participants at different stages of the arketing system in Kenya. m Copyright © 2010 SciRes. JSSM 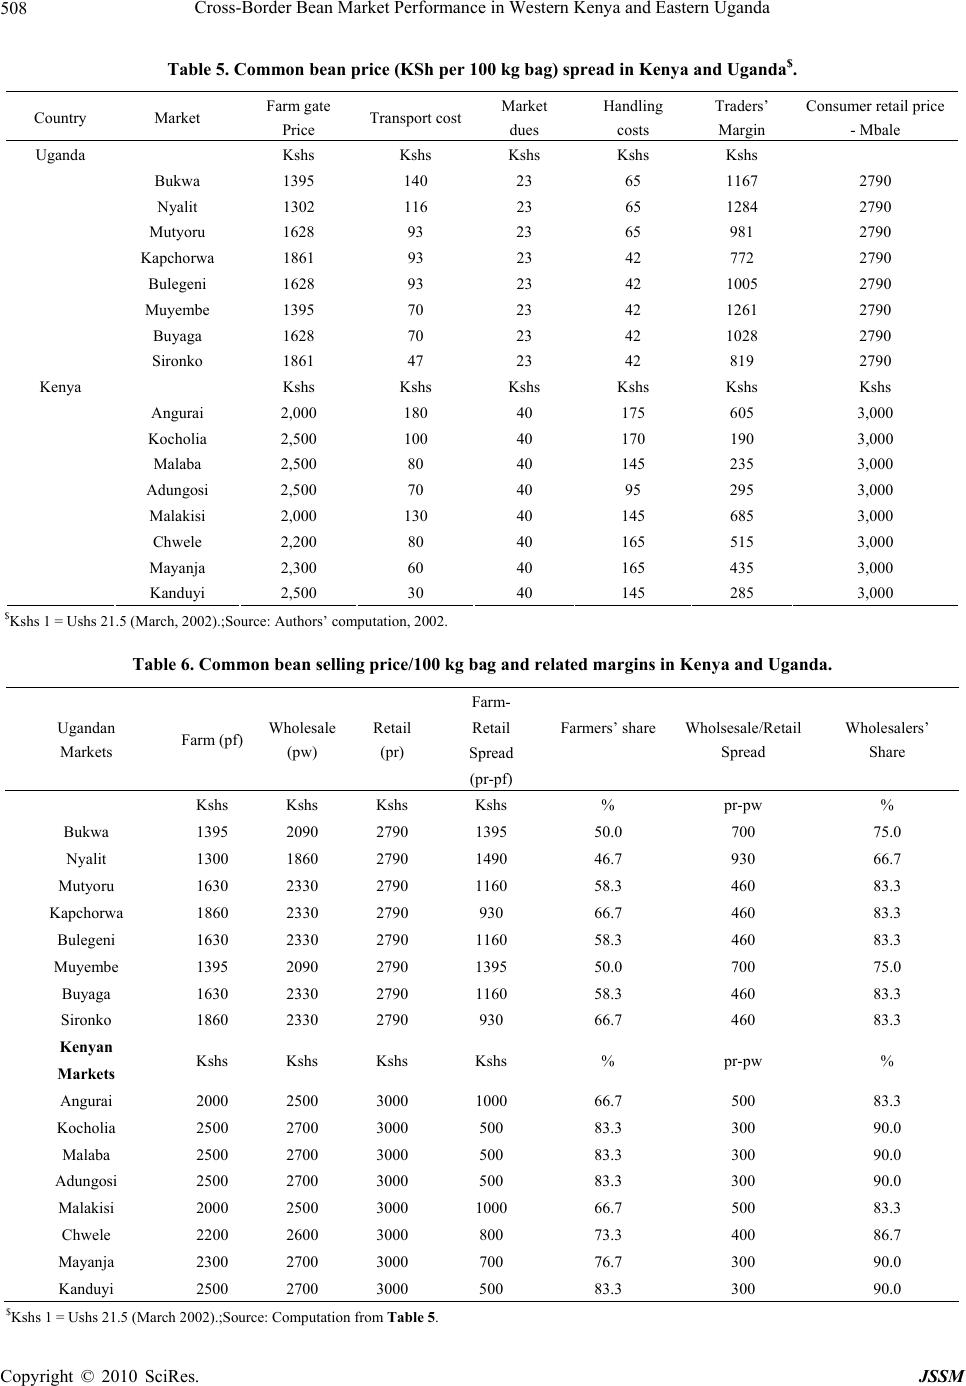 Cross-Border Bean Market Performance in Western Kenya and Eastern Uganda Copyright © 2010 SciRes. JSSM 508 Table 5. Common bean price (KSh per 100 kg bag) spread in Kenya and Uganda$. Country Market Farm gate Price Transport costMarket dues Handling costs Traders’ Margin Consumer retail price - Mbale Uganda Kshs Kshs Kshs Kshs Kshs Bukwa 1395 140 23 65 1167 2790 Nyalit 1302 116 23 65 1284 2790 Mutyoru 1628 93 23 65 981 2790 Kapchorwa 1861 93 23 42 772 2790 Bulegeni 1628 93 23 42 1005 2790 Muyembe 1395 70 23 42 1261 2790 Buyaga 1628 70 23 42 1028 2790 Sironko 1861 47 23 42 819 2790 Kenya Kshs Kshs Kshs Kshs Kshs Kshs Angurai 2,000 180 40 175 605 3,000 Kocholia 2,500 100 40 170 190 3,000 Malaba 2,500 80 40 145 235 3,000 Adungosi 2,500 70 40 95 295 3,000 Malakisi 2,000 130 40 145 685 3,000 Chwele 2,200 80 40 165 515 3,000 Mayanja 2,300 60 40 165 435 3,000 Kanduyi 2,500 30 40 145 285 3,000 $Kshs 1 = Us hs 2 1.5 (Mar ch, 2002).;S o urce: Authors’ computation, 2002. Table 6. Common bean selling price/100 kg bag and related margins in Kenya and Uganda. Farm- Retail Spread Ugandan Markets Farm (pf)Wholesale (pw) Retail (pr) (pr-pf) Farmers’ share Wholsesale/Retail Spread Wholesalers’ Share Kshs Kshs Kshs Kshs % pr-pw % Bukwa 1395 2090 2790 1395 50.0 700 75.0 Nyalit 1300 1860 2790 1490 46.7 930 66.7 Mutyoru 1630 2330 2790 1160 58.3 460 83.3 Kapchorwa 1860 2330 2790 930 66.7 460 83.3 Bulegeni 1630 2330 2790 1160 58.3 460 83.3 Muyembe 1395 2090 2790 1395 50.0 700 75.0 Buyaga 1630 2330 2790 1160 58.3 460 83.3 Sironko 1860 2330 2790 930 66.7 460 83.3 Kenyan Markets Kshs Kshs Kshs Kshs % pr-pw % Angurai 2000 2500 3000 1000 66.7 500 83.3 Kocholia 2500 2700 3000 500 83.3 300 90.0 Malaba 2500 2700 3000 500 83.3 300 90.0 Adungosi 2500 2700 3000 500 83.3 300 90.0 Malakisi 2000 2500 3000 1000 66.7 500 83.3 Chwele 2200 2600 3000 800 73.3 400 86.7 Mayanja 2300 2700 3000 700 76.7 300 90.0 Kanduyi 2500 2700 3000 500 83.3 300 90.0 $Kshs 1 = Ushs 21.5 (March 2002).;Source: Computation from Table 5.  Cross-Border Bean Market Performance in Western Kenya and Eastern Uganda509 Table 7. Common bean marketing costs in primary markets (Ksh/100 kg bag). Cost Item Kapchorwa (Kshs)Mbale (Kshs) Busia (Kshs) Bungoma (Kshs) Bagging materials 4.20 3.00 6.00 6.00 Labour costs - 18.60 37.20 37.20 Weighing costs - 2.30 - - Transport (farm gate to primary market) 23.30 83.70 83.70 83.70 Market dues/local tax 4.65 13.95 37.20 37.20 TOTAL 32.20 121.55 164.10 164.10 $Kshs 1 = Us hs 2 1.5 (Mar ch 2002).; Source: Author’s Computation, 2002. Table 8. Common bean marketing Costs in secondary markets (Ksh/100 kg bag). Cost Item Kapchorwa (Ksh) Mbale (Ksh) Busia (Ksh) Bungoma (Ksh) Bagging materials 5.10 5.35 28.40 28.40 Weighing cost 1.20 4.70 - - Labour costs 23.30 18.60 37.20 37.20 Storage costs 2.80 - 1.40 1.40 Transport (rura l t o urban market) 69.80 46.50 46.50 46.50 Losses 20.90 - - - Trading License 0.40 0.40 0.70 0.70 Security - - 2.80 2.80 Local tax - - - - TOTAL 123.50 75.55 117.00 117.00 $Kshs 1 = Us hs 2 1.5 (Mar ch 2002).; Source: Author’s Computation, 2002. 3.6. Government Levies Government levies exist in form of taxes that the traders pay as market dues and trading license. In Uganda, on the average, primary market traders incurred more ex- penses in government levies (in form of trade license) than terminal traders (see Tables 7 an d 8). In rural areas of both Uganda and Kenya, while primary market traders were paying market fees based on the quantities offered for sale, the urban market traders were paying a daily uniform fixed market fee, not based on sales stock (Ta- bles 7 and 8). The source of these disparities can be traced to different methods used by government agencies in different areas use to collect these revenues. This method was particularly undesirable to primary market traders as it has the effect of raising their unit costs. 3.7. Transportation of Common Bean: Farm to Market Farmsteads located in areas with limited access to com- mercial motor vehicles could hardly market their com- mon beans. Incidentally, most of the areas producing common bean in significant quantities were not along tarmac roads. Besides, the distance from such high common bean producing areas to the terminal markets (where most produce was sold) ranged from 0.2 km to 82 km. Bicycles were the most important means of trans- porting common bean from farm gate to rural markets or to the stores of the commission or market agents. With respect to transporting common bean from rural to urban markets, pick-up vans were most commonly used, espe- cially when medium quantities were involved. Lorries were often used to transport large quantities of common bean to the final destinations, especially when these are located outside the district of origin of the consignments or outside the country. Our estimate shows that ~58% of the surveyed common bean traders in Kenya and Uganda transported their common bean stock to distances of 15 to 800 km. About 49% of these traders used motor vehi- cles for this. At the retail level head load, wheelbarrows, and donkeys were widely used in transporting common bean in Kenya and Uganda, especially where the dis- tances involved were short. In Uganda the cost of transporting a 100 kg bag of common bean by wholesalers accounted for about 50% Copyright © 2010 SciRes. JSSM  Cross-Border Bean Market Performance in Western Kenya and Eastern Uganda 510 of the total marketing costs. The corresponding figure for Kenya was about 54%. The retailers’ average transport cost in Uganda accounted for ~53% of the total market- ing cost. The corresponding figure for Kenya was ~44% (Table 4). As expected, common bean traders noted that the problems of high cost of transport were more during rainy seasons (due to poor road conditions) compared with during the dry seasons. The high cost of transport experienced by common bean traders in both Uganda and Kenya reflects the poor road infrastructure in most parts of East Africa. The same poor road infrastructure fore- stalls effective competition amongst agricultural com- modity transport providers. Transport charges were mainly based on distance traveled and mode of transport. 4. Conclusions The marketing margins earned by traders in Kenya and Uganda, though in excess of transfer costs were justified. This is because of th e high transport costs they incur as a result of the poor road infrastructure and weak trade in- stitutions. Low lev els of efficiency, contributed to largely by high transport costs, exist in the study area due to market imperfections. The price differentials between rural and urban markets could be attributed to scarcity of the product in urban areas leading to demand most often exceeding supply. Inefficient pricing mechanisms among spatially separated markets were common in the study area. High price differentials among markets were more than accounted for by transfer costs between markets and could be attributed to poor market information and hid- den costs due to barriers to entry in the bean trade. However, there is potential in cross-border bean trade between Kenya and Uganda that could be exploited through regional co-operation. 5. Recommendations Following the outcome of this study, the following rec- ommendati o ns could be made: 1) Necessary road infrastructure should be created, in- cluding regular maintenance of the existing roads, in common bean producing districts of Kenya and Uganda. This is critical to engender competition among transport providers and bring about the required efficiency in the marketing system of common bean in the two countries. 2) Local authorities should construct cheap market storage facilities which are appropriately located within the open air markets in order to reduce the trader’s han- dling and other marketing costs. This will also generate extra revenues in form of stall hiring charges. 3) Policies to strengthen regional co-operation and eliminate trade obstacles (e.g., non-tariff and in stitutional barriers) must be put in place to reduce the transaction cost in common bean marketing. 6. Acknowledgements The authors wish to sincerely thank ECABREN/CIAT for funding this study. REFERENCES [1] C. S. Wortmann, R. A. Kirkby, C. K. A. Eledu and D. J. Allen, “Atlas of Common Bean (Phaseolus vulgaris L.) Production in Africa,” CIAT, Cali, Colombia (Publication No. 297), 1998. [2] ECABREN, “Towards the Development of Market-Dri- ven Research Framework,” May 2000. [3] GOK, “Government of Kenya Economic Survey 1997,” Central Bureau of Statistics, Nairobi, 1998. [4] R. M. Muasya, “Crop Physiological Analysis of Seed Qu- ality Variation in Common Beans (Phaseolus vulgaris L.),” Ph.D. Thesis, Wageningen University, The Nether- lands, 2001. [5] L. W. Mauyo, J. R. Okalebo, R. A. Kirkby, R. Buruchara, Ugen, M. Mengist, C. T. Anjichi and R. O. Musebe, “Te- chnical Efficiency and Regional Market Integration of Cross-Border Bean Marketing in Western Kenya and Eastern Uganda,” Journal of Business Management, Vol. 1, No. 4, 2007, p. 78. [6] M. O. Odhiambo, “Opportunities, Constraints and Possi- ble Solutions to Improve the Access of Uganda Maize and Beans to the Kenyan Market,” International Science and Technology Institute, in Association with High Value Hortculture Plc, Washington D.C. and Uxbridge, 1994. [7] C. Ackello-Ogutu and P. Echessah, “Unrecorded Cross- Border Trade between Kenya and Uganda: Implications for Food Security,” Technical Paper, No. 59, USA- ID Washington D.C, 1997. [8] M. Wandel and G. Holmboe-Ottesen, “Food Availability and Nutrition in Seasonal Perspective: A Study from Re- gion in Tanzania,” HUM Eco, No. 20, 1992, pp. 89-107. [9] R. A. Kirkby, Proceedings of Workshop on Bean Re- search in Eastern Africa, Mukono, Uganda, 22nd-25th June 1987, CIAT African Workshop Series, No. 2, 1987. [10] S. David, “Beans in the Farming System and Domestic Economy of Uganda. A Tale of Two Parishes,” Network on Bean Research in Africa, Occasional Publications Se- ries, No. 28, CIAT, Kampala, 1999. [11] NARO, Annual Report, Entebbe, Uganda, 2000. [12] GOK, Bungoma District Development Plan, Government Printers, Nairobi, 1997(a). [13] GOK, Busia District Development Plan, Government Printers, Nairobi, 1997(b). [14] O. R. Mugisha, “Uganda Districts, Information Hand- book,” Fountain Publishers, Kampala, Uganda, 1998. [15] SPSS (Statistical Package for Social Sciences), Statistical Package for Social Sciences Release 11.0, Prentice Hall, Chicago, 2002. Copyright © 2010 SciRes. JSSM  Cross-Border Bean Market Performance in Western Kenya and Eastern Uganda Copyright © 2010 SciRes. JSSM 511 [16] ADC/IDEA Project, “Monthly Bean Prices 2001- 2002,” Kampala. Baert, T. G. “Country Report-Great Lakes: Burundi,” In: J. B. Smithson, Proceedings of a Workshop on Bean Varietal Improvement in Africa, Maseru, Leso- tho 30th January-2nd February 1989, CIAT African Wor- kshop Series, No. 4, 1989, p. 137. [17] Foodnet, “Cross-border Statistics, 2001-2002,” Kampala. [18] L. W. Mauyo, J. R. Okalebo, R. A. Kirkby, R. Buruchara, M. Ugen and R. O. Musebe, “Legal and Institutional Con- straints to Kenya-Uganda Cross-Border Bean Marketing,” African Journal of Agricultural Research, Vol. 2, No. 11, 2007, p. 582. |