Paper Menu >>
Journal Menu >>
 Journal of Environmental Protection, 2010, 1, 448-455 doi:10.4236/jep.2010.14052 Published Online December 2010 (http://www.SciRP.org/journal/jep) Copyright © 2010 SciRes. JEP Spatial Variation of Vegetation Moisture Mapping Using Advanced Spaceborne Thermal Emission & Reflection Radiometer (ASTER) Data Vivek Kumar Singh1, Rajat Satpathy2, Reshma Parveen1, Ayyem Perumal Thillai Jeyaseelan1 1Jharkhand Space Application Center, Ranchi, Department of Information Technology, Government of Jharkhand, Ranchi, India; 2Department of Remote Sensing & GIS, Vidyasagar University, Midnapore, India. Email: vivekearth@gmail.com Received August 20th, 2010; revised September 29th, 2010; accepted October 2nd, 2010. ABSTRACT Drought is a recurrent phenomenon in Jharkhand. It affects the livelihoods of the majority of its people, particularly tribals and dalits living in rural areas. Twelve of the 24 districts of the state, covering 43% of the total land area, are covered under the Drought Prone Areas Programme (DPAP). Hunger and starvation deaths are reported almost every year. Vegetation moisture content is one of the key parameters in drought monitoring, agricultural modelling and forest health mapping. In this paper the three different approaches is described using Advanced Spaceborne Thermal Emis- sion & Reflection Radiometer (ASTER) data for measuring the vegetation moisture content in a part of Palamu Com- missionaire of Jharkhand state, which is prone to severe drought. ASTER thermal data was used to calculate land sur- face temperature using Normalized Differential Vegetation Index (NDVI) emissivity correction method. Reflective bands are used to determine NDVI, Modified Soil Adjustment Vegetation Index (MSAVI) & Normalised Differential Water Index (NDWI). The three different vegetation moisture estimation methods namely MSAVI – LST (land surface temperature) feature space identifica tion, NDWI & Vegetation Dryness Ind ex (VDI) is applied to determine the vegeta - tion moisture level. The results of three methods were classified and final moisture content map was produced. The re- sult was validated using rainfall data of study area. This study indicates that by proper pre-processing of ASTER data, it can be used to estimate the land surface temperature and vegetation moisture content and can be used for drought prediction. Keywords: Vegetation Moisture, ASTER, LST, NDWI, VDI 1. Introduction Periods of persistent abnormally dry weather known as droughts, can produce a serious agricultural, ecological and hydrological imbalance. Drought harshness depends upon the degree of moisture deficiency, duration and the size of the affected area [1]. Remote sensing is now widely used to monitor and predict vegetation character- istics for sustainable development. Imaging spectrometry has great potential for monitoring vegetation type and biophysical characteristics [2]. Vegetation reflectance spectra are often quite informative, containing informa- tion on the vegetation chlorophyll absorption bands in the visible region, the sustained high reflectance in the near infrared band, and the effects of plant water absorp- tion in the middle infrared region. Using that absorption and reflection characteristics of vegetation researchers have defined many vegetation indices for monitoring vegetation parameters. Normal- ized Differential Vegetation Index (NDVI) is used to measure the forest health. It measures the chlorophyll content within the vegetation [3]. Normalized Differen- tial Water Index. (NDWI) was used to measure the moisture content within the vegetation field. The surface temperature re- sponse is a function of v arying vegetation cover and sur- face soil water content. Lambin and Ehrlich (1996) ex- plained the Vegetation Index (VI) and Land Surface Temperature (LST) space in terms of evaporation, tran- spiration and fractional vegetation coverage [4]. Accord- ing to Lambin and Ehrlich (1996), the variations in sur- face brightness temperature are highly correlated with variations in surface water content over base soil [4]. Advanced Spaceborne Thermal Emission & Reflection Radiometer (ASTER) data have a distinct vegetation  Spatial Variation of Vegetation Moisture Mapping Using Advanced Spaceborne Thermal Emission & Reflection Radiometer (ASTER) Data Copyright © 2010 SciRes. JEP 449 absorption and reflection bands. So, it is used to measure the moisture content within the vegetation field of Jharkhand state, which is regularly affected by drought. Almost every year some part of that state is affected by drought. The main objective of this study is to evaluate the potential of ASTER imagery to determine the varia- tion of vegetation moisture within the study area. Mean- while the area suffer drought year after year. So, for identifying the situation of drought, this study was car- ried out. Three approaches are used to estimate the vege- tation moisture levels and then the result is compared with the rainfall status of the study area in the same time. 2. Study Area The present study area is the part of Latehar, Garhwa, Palamu & Gumla district of Jharkhand state (Figure 1). Geographically, the area is located on southern part of the Chotanagpur plateau. Maximum height of the area is about 1120 meter above mean sea level. The area drained by North Koel, Burha River and their tributaries. The area enjoys a tropical climate. The maximum temperature in summ er rise s to abo ve 32℃ and the minimum in winter falls to 03-04℃. The average annual rainfall is about 1600 mm. The latitudinal and longitudinal extent of the study area is as follows – Latitudinal extent –23°15’N-23°50’N and Longitudi nal extent - 83°24’E-83°38’E. 3. Methods 3.1. Data Used Advanced Spaceborne Thermal Emission and Reflection Radiometer (ASTER) Level-1A satellite data (Table 1) is used for this study. The imagery was georectified in UTM, WGS 84, and Zone-45N. Apart from satellite data ASTER DEM, SOI Toposheet on 1:50000 scale and Figure 1. Location of the study area & selected test sites.  Spatial Variation of Vegetation Moisture Mapping Using Advanced Spaceborne Thermal Emission & Reflection Radiometer (ASTER) Data Copyright © 2010 SciRes. JEP 450 Table 1. ASTER satellite data specifications used for the study [5]. Data Product Spectral Bands Spectral range (µm) Spatial Resolution (M) 1 0.5-0.60 15 2 0.63-0.69 15 3N 0.78-0.86 15 Aster L1A VNIR 3B 0.78-0.86 15 4 1.60-1.70 30 5 2.145-2.185 30 6 2.185-2.225 30 7 2.235-2.285 30 8 2.95-2.365 30 Aster L1A SWIR 9 2.360-2.430 30 10 8.125-8.475 90 11 8.475-8.825 90 12 8.925-9.275 90 13 10.25-10.95 90 Aster L1A TIR 14 10.95-11.65 90 other published map and literature were used for the work. The flow chart shown in Figure 2 illustrates the pro- cedures followed to generate the crop moisture map. 3.1.1. Method of LST Calcul ation Thermal atmospheric correction is must to calculate the most accurate temperature using ASTER thermal data. Here, the In-Scene Atmospheric Compensation algorithm (ISAC) [6], is applied to remove atmospheric noises from the thermal bands. The algorithm first determines the wavelength that most often exhibits the maximum brightness temperature. This wavelength is then used as the reference wavelength. Only spectra that have their brightest temperature at this wavelength are used to calculate the atmospheric com- pensation. At this point, for each wavelength, the refer- ence blackbody radiance values are plotted against the measured radiances. A line is fitted to the highest points in these plotted data and the fit is weighted to assign more weight to regions with denser sampling. The com- pensation for this band is then applied as the slope and offset derived from the linear regression of these data with their computed blackbody radiances at the reference wavelength. Upwelling atmospheric radiance and at- mospheric transmission are approximated using the fol- Figure 2. Processing flow for mapping vegetation moisture. lowing method. First, the surface temperature of every pixel is estimated from the data and used to approximate the brightness temperature using the Planck function and assuming an emissivity of 1. Next, a line is fitted (using one of two methods) to a scatter plot of radiance vs. brightness temperature. The atmospheric upwelling and transm ission are then de r ived from the slope and offset of this line. Satellite thermal infrared sensors measure radiances at the top of the atmosphere, from which brightness tem- peratures TB (also known as blackbody temperatures) can be derived by using Plank’s law [7]. 25 1 2 1 bhc TkIn hc B (1) where h is Planck’s constant (6.62 × 10⁻³⁴ J-sec), c – ve- locity of light (2.998 × 10⁸ m sec-1), λ – wavelength of emitted radiance (m), Bλ – blackbody radiance (Wm-2 μm-1). With the known LSE, the emissivity-corrected LST (TS) can be calculated by the Stefan Boltzmann law [8]. 44 s B BTT (2) Therefore, 1 4 1 SB TT (3) where σ is the Stefan Boltzmann constant (5.67 × 10⁻⁸ Wm-2 K-4), B – total amount of radiation emitted (Wm2-),  Spatial Variation of Vegetation Moisture Mapping Using Advanced Spaceborne Thermal Emission & Reflection Radiometer (ASTER) Data Copyright © 2010 SciRes. JEP 451 TS – surface temperature (K), TB – brightness temperature (K), ε – land surface emissivity. In order to determine an actual surface temperature it is necessary to determine the emissivity of the land sur- face features. 3.1.2. NDVI Method for Emissivity Correction Retrieval of LST from multispectral TIR data requires an accurate measurement of emissivity values of the surface [9]. The emissivity of a surface is controlled by such factors as water content, chemical composition, structure, and roughness [10]. For vegetated surfaces, emissivity can vary significantly with plant species, areal density, and growth stage [10]. In the mean time, emissivity is a function of wavelength, commonly referred to as spectral emissivity [11]. Pixels representing the land surface are usually mixed pixels of surfaces-types such as vegetation and soil. The effective emissivity of a pixel can be esti- mated by summing up the contributions from its sur- face-types. Van de Griend and Owe (1993) [12] found a high correlation between measured emissivity and NDVI, which measured from visible and near-infrared spectral reflectance. I RR NDVI I RR (4) They gave the following relation: 1.0094 0.047*ln NDVI (5) But this is only valid for areas with a large patches covered by vegetation or soil. Valor and Caselles (1996) [13] proposed an operational model of determining the effective emissivity that is applicable to areas with sev- eral soil and vegetation types and changing vegetation cover: 1vPvsPv (6) where εv, εs are the emissivity of the full vegetation and bare soil, and Pv is the vegetation cover fraction. εv, εs can be obtained from the Formula (4) where the patches of vegetation and soil are selected so that they are a lot bigger than a pixel. Pv is derived according to Carlson and Ripley (1997) [14 ], from: 2 S vVS NVDI NVDI PNVDI NVDI (7) 3.1.3. Modified Soil Adjustment Vegetation Index (MSAVI) A Modified Soil Adjusted Vegetation Index (MSAVI), proposed by [15] was created using ASTER VNIR image. The following equation was used to calculate the index image: Figure 3. Distribution of land surface temperature calcu- lated from ASTER image. 2 0.50.5 2 N NNr MSAVI (8) where, n is reflectance at Near Infra Red (NIR) (AS- TER Band 3n) band and r is reflectance at Red (R) band (ASTER Band 2). 4. Results & Discussion 4.1. Estimation of Vegetation Moisture 4.1.1. First Approach: VI-LST Triangular Space Method The Vegetation Index (VI) – Land Surface Temperature (LST) Triangular Space Method proposed by Lambin and Ehrlich (1996) was used to map the relative variation of vegetation moisture within Baresanr reserved forest. The MSAVI created from ASTER VNIR image was used as Vegetation Index and Land surface kinetic tempera- ture (in degree centigrade) calculated from ASTER TIR image was used as LST [16]. The MSAVI image and LST image were stacked to create a two layer image that was then was classified using unsupervised classification method. A feature space image was created using the two layer image. The MSAVI image layer was used along X axis and the LST image layer was used along Y axis. The feature space 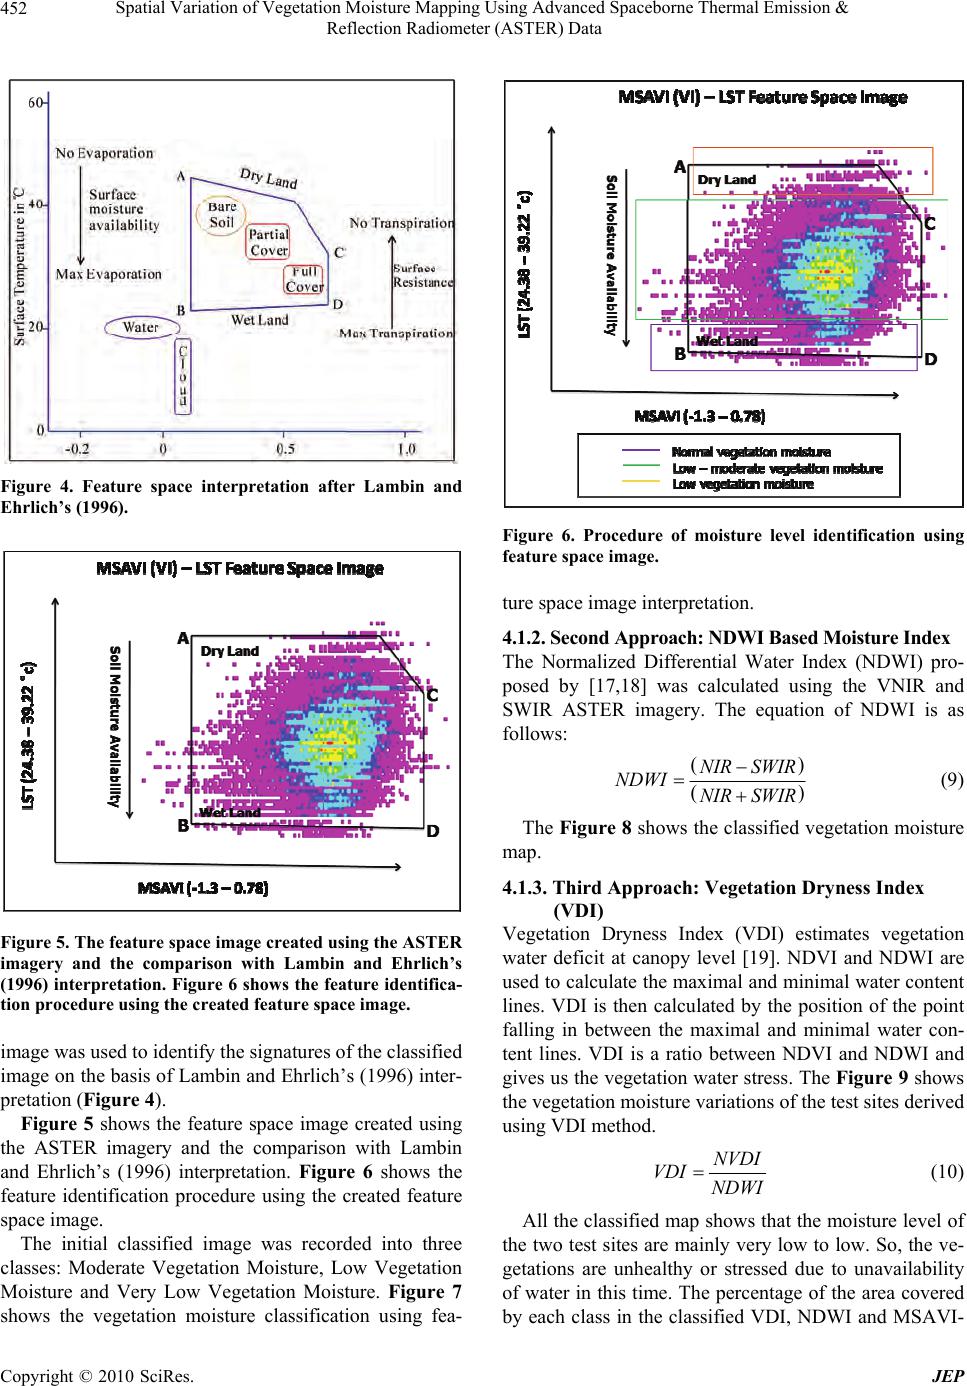 Spatial Variation of Vegetation Moisture Mapping Using Advanced Spaceborne Thermal Emission & Reflection Radiometer (ASTER) Data Copyright © 2010 SciRes. JEP 452 Figure 4. Feature space interpretation after Lambin and Ehrlich’s (1996). Figure 5. The feature space image created using the ASTER imagery and the comparison with Lambin and Ehrlich’s (1996) interpretation. Figure 6 shows the feature identifica- tion procedure using the created feature space image. image was used to identify the signatures of the classified image on the basis of Lambin and Eh rlich’s (1996) inter- pretation (Figure 4). Figure 5 shows the feature space image created using the ASTER imagery and the comparison with Lambin and Ehrlich’s (1996) interpretation. Figure 6 shows the feature identification procedure using the created feature space image. The initial classified image was recorded into three classes: Moderate Vegetation Moisture, Low Vegetation Moisture and Very Low Vegetation Moisture. Figure 7 shows the vegetation moisture classification using fea- Figure 6. Procedure of moisture level identification using feature space image. ture space image interpretation. 4.1.2. Second Approach: NDWI Based Moisture Index The Normalized Differential Water Index (NDWI) pro- posed by [17,18] was calculated using the VNIR and SWIR ASTER imagery. The equation of NDWI is as follows: NIR SWIR NDWI NIRSWIR (9) The Figure 8 shows the classified vegetation moisture map. 4.1.3. Third Approach: Vegetation Dryness Index (VDI) Vegetation Dryness Index (VDI) estimates vegetation water deficit at canopy level [19]. NDVI and NDWI are used to calculate th e maximal and minimal water content lines. VDI is then calculated by the position of the point falling in between the maximal and minimal water con- tent lines. VDI is a ratio between NDVI and NDWI and gives us the vegetation water stress. The Figure 9 shows the vegetation moisture variations of the test sites derived using VDI method. NVDI VDI NDWI (10) All the classified map shows that the moisture level of the two test sites are mainly very low to low. So, the ve- getations are unhealthy or stressed due to unavailability of water in this time. The percentage of the area covered by each class in the classified VDI, NDWI and MSAVI- 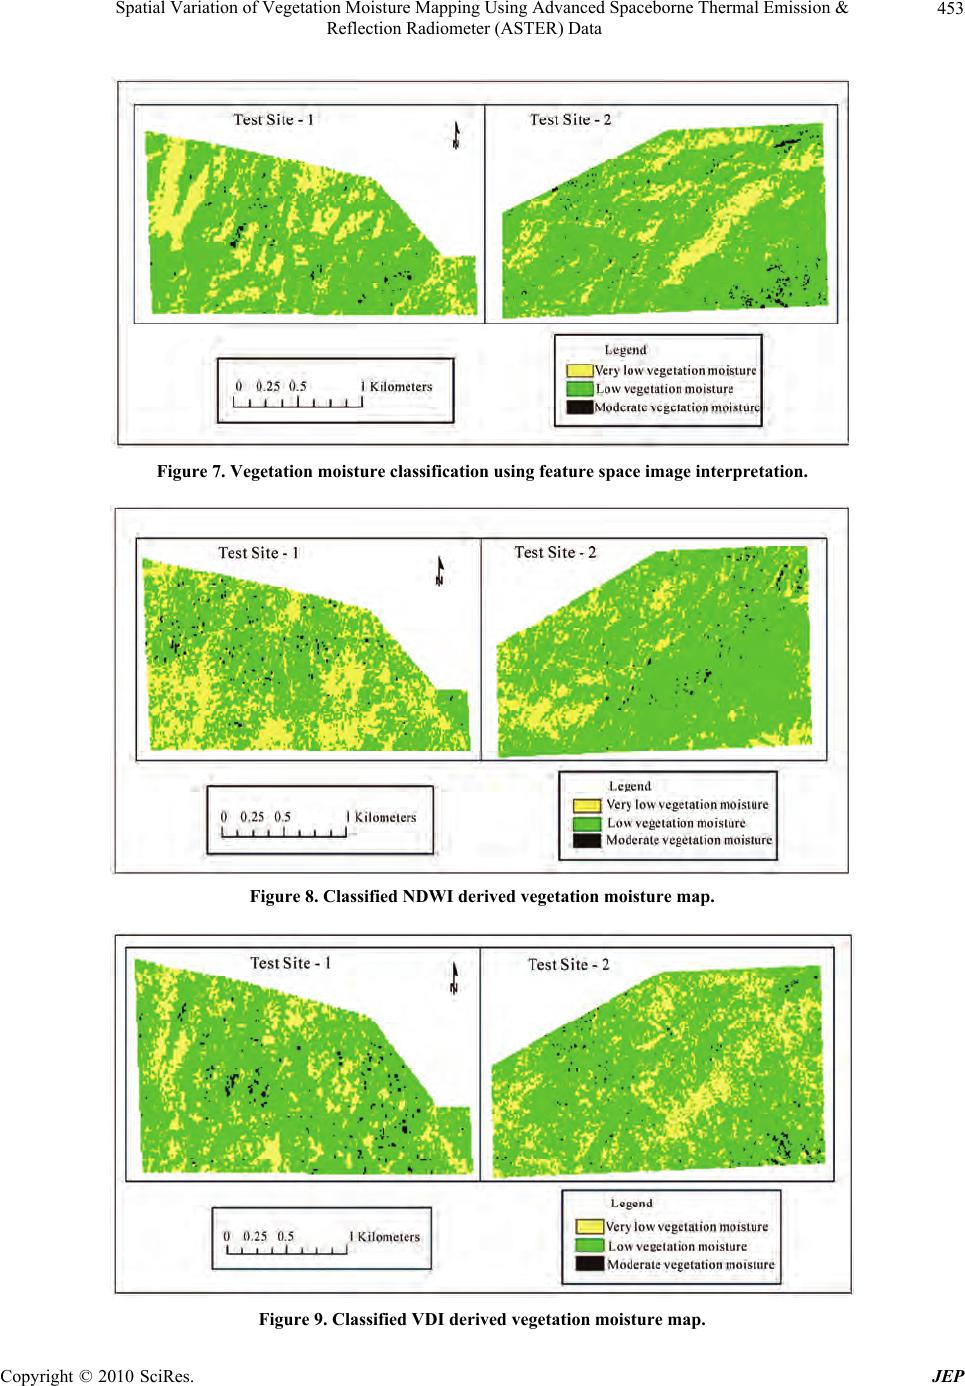 Spatial Variation of Vegetation Moisture Mapping Using Advanced Spaceborne Thermal Emission & Reflection Radiometer (ASTER) Data Copyright © 2010 SciRes. JEP 453 Figure 7. Vegetation moisture classification using feature space image interpretation. Figure 8. Classified NDWI derived vegetation moisture map. Figure 9. Classified VDI derived vegetation moisture map. 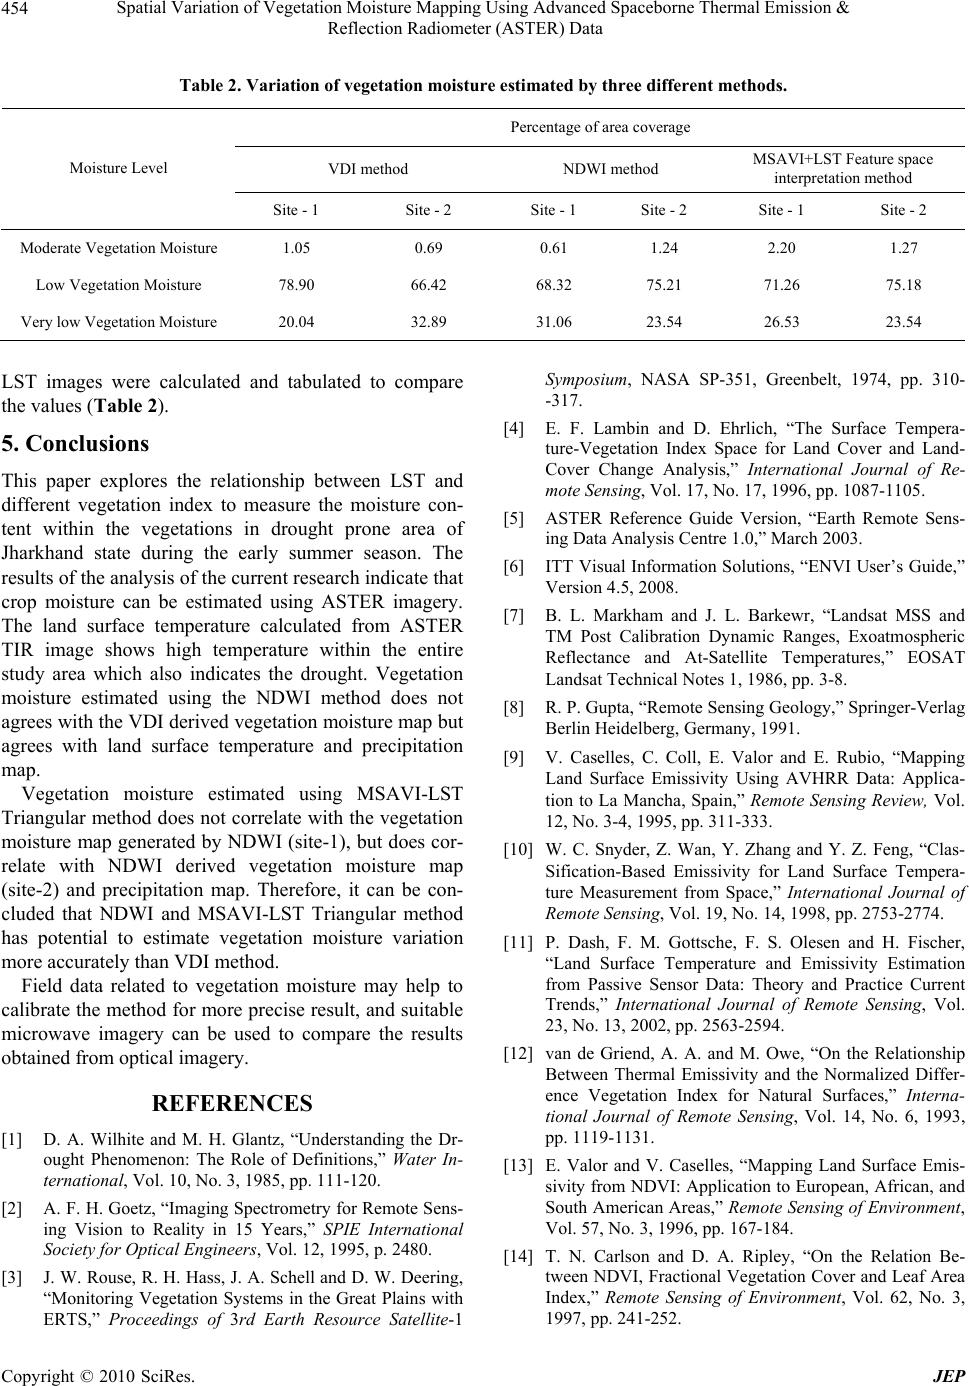 Spatial Variation of Vegetation Moisture Mapping Using Advanced Spaceborne Thermal Emission & Reflection Radiometer (ASTER) Data Copyright © 2010 SciRes. JEP 454 Table 2. Variation of vegetation moisture estimated by three different methods. Percentage of area coverage VDI method NDWI method MSAVI+LST Feature space interpretation method Moisture Level Site - 1 Site - 2 Site - 1 Site - 2 Site - 1 Site - 2 Moderate Vegetation Moistu re 1.05 0.69 0.61 1.24 2.20 1.27 Low Vegetation Moisture 78.90 66.42 68.32 75.21 71.26 75.18 Very low Vegetation Moisture 20.04 32.89 31.06 23.54 26.53 23.54 LST images were calculated and tabulated to compare the values (Table 2). 5. Conclusions This paper explores the relationship between LST and different vegetation index to measure the moisture con- tent within the vegetations in drought prone area of Jharkhand state during the early summer season. The results of the analysis of the current research indicate that crop moisture can be estimated using ASTER imagery. The land surface temperature calculated from ASTER TIR image shows high temperature within the entire study area which also indicates the drought. Vegetation moisture estimated using the NDWI method does not agrees with the VDI derived vegetation moisture map but agrees with land surface temperature and precipitation map. Vegetation moisture estimated using MSAVI-LST Triangular method does not correlate with the v egetation moisture map generated by NDWI (site-1), but does cor- relate with NDWI derived vegetation moisture map (site-2) and precipitation map. Therefore, it can be con- cluded that NDWI and MSAVI-LST Triangular method has potential to estimate vegetation moisture variation more accurately than VDI method. Field data related to vegetation moisture may help to calibrate the method fo r more precise result, and suitable microwave imagery can be used to compare the results obtained from optical imagery. REFERENCES [1] D. A. Wilhite and M. H. Glantz, “Understanding the Dr- ought Phenomenon: The Role of Definitions,” Water In- ternational, Vol. 10, No. 3, 1985, pp. 111-120. [2] A. F. H. Goetz, “Imaging Spectrometry for Remote Sens- ing Vision to Reality in 15 Years,” SPIE International Society for Optical Engineers, Vol. 12, 1995, p. 2480. [3] J. W. Rouse, R. H. Hass, J. A. Schell and D. W. Deering, “Monitoring Vegetation Systems in the Great Plains with ERTS,” Proceedings of 3rd Earth Resource Satellite-1 Symposium, NASA SP-351, Greenbelt, 1974, pp. 310- -317. [4] E. F. Lambin and D. Ehrlich, “The Surface Tempera- ture-Vegetation Index Space for Land Cover and Land- Cover Change Analysis,” International Journal of Re- mote Sensing, Vol. 17, No. 17, 1996, pp. 1087-1105. [5] ASTER Reference Guide Version, “Earth Remote Sens- ing Data Analysis Centre 1.0,” March 2003. [6] ITT Visual Information Solutions, “ENVI User’s Guide,” Version 4.5, 2008. [7] B. L. Markham and J. L. Barkewr, “Landsat MSS and TM Post Calibration Dynamic Ranges, Exoatmospheric Reflectance and At-Satellite Temperatures,” EOSAT Landsat Technical Notes 1, 1986, pp. 3-8. [8] R. P. Gupta, “Remote Sensing Geology,” Springer-Verlag Berlin Heidelberg, Germany, 1991. [9] V. Caselles, C. Coll, E. Valor and E. Rubio, “Mapping Land Surface Emissivity Using AVHRR Data: Applica- tion to La Mancha, Spain,” Remote Sensing Review, Vol. 12, No. 3-4, 1995, pp. 311-333. [10] W. C. Snyder, Z. Wan, Y. Zhang and Y. Z. Feng, “Clas- Sification-Based Emissivity for Land Surface Tempera- ture Measurement from Space,” International Journal of Remote Sensing, Vol. 19, No. 14, 1998, pp. 2753-2774. [11] P. Dash, F. M. Gottsche, F. S. Olesen and H. Fischer, “Land Surface Temperature and Emissivity Estimation from Passive Sensor Data: Theory and Practice Current Trends,” International Journal of Remote Sensing, Vol. 23, No. 13, 2002, pp. 2563-2594. [12] van de Griend, A. A. and M. Owe, “On the Relationship Between Thermal Emissivity and the Normalized Differ- ence Vegetation Index for Natural Surfaces,” Interna- tional Journal of Remote Sensing, Vol. 14, No. 6, 1993, pp. 1119-1131. [13] E. Valor and V. Caselles, “Mapping Land Surface Emis- sivity from NDVI: Application to European, African, and South American Areas,” Remote Sensing of Environment, Vol. 57, No. 3, 1996, pp. 167-184. [14] T. N. Carlson and D. A. Ripley, “On the Relation Be- tween NDVI, Fractional Vegetation Cover and Leaf Area Index,” Remote Sensing of Environment, Vol. 62, No. 3, 1997, pp. 241-252.  Spatial Variation of Vegetation Moisture Mapping Using Advanced Spaceborne Thermal Emission & Reflection Radiometer (ASTER) Data Copyright © 2010 SciRes. JEP 455 [15] J. Qi, A. Chehbouni, A. R. Huete, Y. Kerr and S. So- rooshian, “A Modified Soil Adjusted Vegetation Index (MSAVI),” Remote Sensing of Environment, Vol. 48, 1994, pp. 119-126. [16] A. K. M. Hossain, G. Easson and V. K. Boken, “Mapping Spatial Variation in Surface Moisture Using Reflective and Thermal ASTER Imagery for Southern Africa,” ASPRS 2006 Annual Conference, Reno, 1-5 May 2006. [17] G. Tian, L. B. Jupp, F. Qiang, W. Bingfang and H. Qin, “Drought Monitoring of Crop Using Remote Sensing and GIS,” Journal of Remote Sensing, Vol. 6, No. (Suppl.), 2002, pp. 145-152. [18] B. C. Gao, “NDWI – A Normalized Difference Water Index for Remote Sensing of Vegetation Liquid Water from Space,” Remote Sensing of Environment, Vol. 58, No. 3, 1996, pp. 257-266. [19] M. Maki, M. Ishiahra and M. Tamura, “Estimation of Leaf Water Status to Monitor the Risk of Forest Fires by Using Remotely Sensed Data,” Remote Sensing of Envi- ronment, Vol. 90, No. 3, 2004, pp. 441-450. |

