 Journal of Water Resource and Protection, 2013, 5, 669-680 http://dx.doi.org/10.4236/jwarp.2013.57067 Published Online July 2013 (http://www.scirp.org/journal/jwarp) Removal of Zn (II) from Aqueous Solution onto Kaolin by Batch Design Bahia Meroufel1,2,3*, Omar Benali4, Mohamed Benyahia2, Mohamed Amine Zenasni1,3, André Merlin3, Béatrice George3 1Laboratory of Valorisation of Vegetal Resources and Food Security (VRVSA), Bechar University, Bechar, Algeria 2Department of Chemistry, Faculty of Sciences, Djillali Liabes University, Sidi Bel Abbes, Algeria 3Laboratory of Studies and Research on Material Wood (LERMAB), University of Lorraine, Nancy, France 4Department of Chemistry, Faculty of Sciences, Tahar Moulay University, Saida, Algeria Email: *b.meroufel@gmail.com Received April 26, 2013; revised May 28, 2013; accepted June 18, 2013 Copyright © 2013 Bahia Meroufel et al. This is an open access article distributed under the Creative Commons Attribution License, which permits unrestricted use, distribution, and reproduction in any medium, provided the original work is properly cited. ABSTRACT The Algerian kaolin clay was investigated to remove Zn(II) heavy metal ion from aqueous solution. The effect of con- tact time, initial metal ion concentration, pH and temperature was experimentally studied in batch mode to evaluate the adsorption capacity, kinetic, thermodynamic and equilibrium. The extent of zinc adsorption increased with increasing initial concentration of adsorbat, pH and temperature. The linear Langmuir and Freundlich models were applied to de- scribe equilibrium isotherms and both models fitted well. The monolayer adsorption capacity for Zn(II) ions was 12.23 mg per g of kaolin clay at pH 6.1 and 25˚C. Dubinin-Radushkevich (D-R) isotherm model was also applied to the equi- librium data. Thermodynamic parameters showed that the adsorption of Zn(II) onto kaolin clay was spontaneous and endothermic process in nature. Furthermore, the Lagergren-first-order and pseudo-second-order models were used to describe the kinetic data. The experimental data fitted well the pseudo-second-order kinetic. As a result, the kaolin clay may be used for removal of zinc from aqueous media. Keywords: Zn(II); Kaolin; Adsorption Isotherm; Thermodynamic; Kinetic 1. Introduction Heavy metal contamination has become an environmen- tal problem today in both developing and developed countries throughout the world [1,2]. Heavy metals are of considerable environmental concern due to their toxicity, wide sources, non-biodegradable properties and accumu- lative behaviours [3]. Zinc is considered as an essential element for life and acts as a micronutrient when presented in trace amounts. But too much zinc can be harmful to health. Zn(II) is reported to be toxic beyond permissible limits. Symptoms of zinc toxicity include irritability, muscular stiffness, loss of appetite and nausea [4]. WHO [5] recommended level of zinc in drinking water is 5 mg/L. The metal is further reported to be bioaccumulated into flora and fauna creating ecological problems. In developing coun- tries, metal mining and metallurgy industrial departments produce large quantities of wastewater containing high concentration of Zn(II) [6,7]. It is also present in high concentration in wastewater of pharmaceuticals, galva- nizing, paints, pigments, insecticides, cosmetics, etc. that causes serious problem to the environment [8]. Therefore, the heavy metal levels in wastewater, drinking water, and water used for agriculture should be reduced to the maxi- mum permissible concentration. Many methods such as ion exchange, precipitation, membrane processes and reverse osmosis have been used for the removal of toxic metal ions [9-15]. However, these methods have several disadvantages such as incomplete metal ion removal, high reagent and energy requirements, generation of toxic sludge or other waste products, and long desorp- tion time. Adsorption is recognized as an effective and economic method for removal of pollutants from waste- waters. In recent years, many studies have focused on seeking cheap, locally available and effective adsorb- ents, such as waste biopolymers, clays and clay minerals [16]. Clay minerals are low-cost and readily available mate- rials functioning as excellent cation exchangers, which have often been used to adsorb metallic contaminants. *Corresponding author. C opyright © 2013 SciRes. JWARP  B. MEROUFEL ET AL. 670 They have different adsorption capacities for metal ions, such as mesoporous silica [17] and montmorillonite clay [18,19]. Kaolinite clay is a 1:1 clay mineral including a tight interlayer structure with the ideal formula of Al2Si2O5(OH)4 [20,21]. The sorption properties of this clay are solely determined by the nature of its surface and edges. Kaolinite clay possesses a variable charge that can be related to the reactions between ionisable surface groups located at the edges and the ions present in aque- ous solution [20,22]. It has been used as adsorbent mate- rial for the adsorption process of various heavy metals [23-26]. The objective of the present work is to study the ad- sorption characteristics of Zn(II) ions from aqueous solu- tion using Algerian kaolin clay. The influences of adsorp- tion conditions such as contact time, pH changes, initial concentration of Zn(II) ions and temperature effect were investigated. In addition, the evidence for physico- chemical characteristics of Algerian kaolin clay obtained from X-ray diffraction (XRD) and scanning electron mi- croscope (SEM) was investigated to understand the ad- sorption mechanism. Finally, kaolin clay potentially used to remove Zn(II) metal ion in wastewater was demon- strated. 2. Materials and Methods 2.1. Adsorbent The kaolin sample used in this investigation was col- lected from a natural deposit, located in Tabelbala in pro- vince Bechar (Algeria). The surface area and CEC of kaolin were measured using methylene blue technique [27]. The sample of kaolin powder was characterized by using infrared (FT-IR), X-ray diffraction (XRD) and scanning electron microscopic (SEM) techniques. 2.2. Reagents All chemicals used were of analytical grade. Stock stan- dard solution of Zn2+ has been prepared by dissolving the appropriate amount of ZnSO4·7H2O in deionized water. This stock solution was then diluted to specified concen- trations. The pH of the system was adjusted using reagent grade NaOH and HCl respectively. All plastic sample bottles and glassware were cleaned, then rinsed with de- ionized water and dried at 60˚C in a temperature con- trolled oven. 2.3. Instrumentation The pH of all solution was measured by a TitraLab In- strument TIM800 Model pH meter. The adsorption ex- periments have been studied by batch technique using a thermostated shaker bath GFL-1083 Model. A Eppendorf 5702 Model digital centrifuge was used to centrifuge the samples. Zn(II) concentrations of solutions before and after adsorption were measured by using flame atomic absorption spectrophometer (Varian, SpectrAA-100, AAS). The Fourier transform infrared (FT-IR) absorption spectra was recorded on KBr pressed pellets of the pow- dered sample in the range 4000 - 400 cm−1, using a Perkine-Elmer FTIR 2000 spectrophotometer. The X-ray diffraction pattern of powder was recorded on a Phillips-1730 (PAN analytical) X-ray diffractometer using Cu Kα radiation (λ = 1.54Å). Nanomorphology was characterized by scanning elec- tron microscopy (SEM) witch was carried out using Hi- tachi S-4800 equipped with energy dispersive spectro- metry for chemical analysis (EDS) and operating at 15 kV acceleration voltage. 2.4. Adsorption Procedure Adsorption measurements were determined by batch experiments. The effect of contact time on the adsorption capacity of Kaolin was studied in the range 1 - 360 min at an initial concentration of 100 mg/L. Adsorption ki- netics was studied using an initial concentration of 100 mg/L with the adsorbent dosage of 0.2 g/20 mL at pH 6.1. Adsorption isotherms were studied at various initial con- centrations of Zn(II) ion in the range of 10 - 120 mg/L and the experiments were conducted at different constant temperatures in the range 25˚C - 60˚C. The amount of Zn (II) adsorbed per unit mass of kaolin was calculated by using the mass balance equation given in Equation (1) [28]. oe e CCV qm (1) where qe is the maximum adsorption capacity in mg/g, Co is the initial concentration and Ce is the concentration at equilibrium of Zn(II) solution in mg/L, V is the volume of the Zn(II) solution in mL and m is the mass of the kao- lin in grams. The percent adsorption of metal ion was calculated as follows Equation (2) [24]: 100 oe o CC Sorption% % C (2) The sorption capacity at time t, qt (mg/g) was obtained as Equation (3) [24]: oe t CCV qm (3) where Co and Ct (mg/L) are the liquid phase concentra- tions of Zn (II) at initial and a given time t, V is the solu- tion volume and m the mass kaolin (g). Copyright © 2013 SciRes. JWARP  B. MEROUFEL ET AL. 671 3. Results and Discussion 3.1. Characterisation of Adsorbent SEM micrograph of the untreated clay sample suggests a very cohesive material (Figure 1). The micrograph con- firms that the material is forming micron-size agglomer- ates. A higher magnification micrograph of the same structure shows that the micro-size particles are com- posed of individual platelets, which conglomerate into larger size particles. The X-ray diffraction spectrograph of the kaolin clay is shown in Figure 2. Kaolin show three intense diffrac- tion peaks at 2θ value of 12.4˚, 24.8˚ and 26.6˚, less in- tense peaks at 2θ of 36.7˚, 39.6˚, 48.0˚, 50.1˚ and 60.1˚ and humps at 2θ = 19.8˚ - 21.9˚, 37.8˚ - 39.2˚ and 44.8˚ - 46.9˚, which are all associated with kaolinite (K). Dif- fraction peaks of quartz (Q) could be found at 2θ values of 20.9˚, 26.4˚, 50.9˚, 62.3˚ and 68.1˚. Illite (I) was also detected at 2θ = 17.9˚, 30.2˚, 35.1˚, 42.4˚ and 55˚. The FTIR Spectra of the kaolin, in the range of 400 - 4000 cm−1 was taken to confirm the presence of func- tional groups that might be responsible for the adsorption process and presented in Figure 3. As may be seen, clay display a number of adsorption peaks, reflecting the complex nature the kaolin clay. The main bonds observed Figure 1. SEM of kaolin clay. 0 1020304050607 0 4000 8000 12000 16000 Intensity Angle (2) K K Q KKK K K K IIKI Q I K K Q IQ K : Kaolinite Q : Quartz I : Illite Q Figure 2. XRD pattern of kaolin. were OH− stretching, hydroxyl sheet at 3698 cm−1 and 3620 cm−1. H2O stretching was also found at 1636 cm−1. Bands at 1033 cm−1 and 984 cm−1 were assigned to Si-O bonds in the SiO4 molecules [29]. The other band at 913 cm−1 was attributed to AlIV-OH vibrations [30]. The bands at 798 cm−1, 750 cm−1 and 694 cm−1 were Si-O symmetric stretching [31]. Absorption at 535 cm−1 was assigned as Si-O-AlVI, where the Al is in octahedral co- ordination [30,31]. The average surface area and CEC (Cation Exchange Capacity) of kaolin which were measured using methyl- ene blue technique [27] were 10.60 m2/g and 8.01 meq/ 100 g, respectively. 3.2. Effect of Contact Time The effect of contact time on the adsorption of Zn(II) ion onto kaolin clay at 25˚C and pH 6.1 is shown in Figure 4. It can be seen that the adsorption of Zn(II) occurred very quickly from the beginning of the experiment to the first 12 min. where the maximum adsorption of Zn(II) onto clay was observed; it can be said that beyond this there Figure 3. IR spectra of kaolin. 050100 150 200 250 300 350 40 93,2 93,4 93,6 93,8 94,0 94,2 94,4 Sorption (%) t min Figure 4. Effect of contact tie on adsorption capacity of Kaolin. m Copyright © 2013 SciRes. JWARP  B. MEROUFEL ET AL. 672 was almost no further increase in the adsorption. This was due to the decrease of adsorption sites on the clay which gradually interacted with the metal ion [32]. Therefore, 12 min was selected as the optimum contact time for all further experiments. In this study, 94.4% of Zn(II), were adsorbed on the Kaolin clay when the equilibrium was reached in just 12 min. On the basis of this result, it can be observed that natural kaolin clay can be used to remove this metal ion. 3.3. Effect of Initial Concentration of Zn (II) Effect of initial concentration of Zn(II) on adsorption n the adsorption capacity of kaolin capacity of kaolin was investigated by varying initial concentration of Zn(II) from 10 to 120 mg/L. For this study, pH, temperature, adsorbent dosage and contact time have been fixed as 25˚C, 0.2 g/20 mL and 12 min. The results are presented in Figure 5. An increase of Zn(II) concentration accelerates the diffusion of Zn(II) ions from solution to the adsorbent surface due to the increase in driving force of concentration gradient. Hence, the amount of adsorbed Zn(II) at equilibrium in- creased from 0.98 to 10.44 mg/g as the Zn(II) concentra- tion is increased from 10 to 120 mg/L. 3.4. Effect of pH Effect of initial pH o for Zn(II) was studied by varying solution pH from 1.5 to 11 at the adsorbent dosage of 0.2 g/20 mL using an initial concentration of Zn(II) as 100 mg/L. The pH range of 1.5 - 6.1 was chosen, as the precipitation of Zn(II) is found to occur at pH ≥ 7 [16]. Variation of adsorption capacity of kaolin for Zn(II) ions with pH is shown in Figure 6. It is evident that the adsorption of Zn(II) ions on kaolin is strongly dependant on the pH of the solution. The ad- sorption of Zn(II) ions increases steadily with increase in 0 20406080 0 2 4 6 8 10 100120 12 qe (mg/g) C0 (mg/L) Figure 5. Effect of initial concentration of Zn(II) on adsorp tion capacity of Kaolin. - 123456789 14 6 8 10 12 qe (mg/g) pH Figure 6. Effect of pH on adsorption capacity of Kaolin. In an alkaline medium (pH > 7), the s clay becom 2 + HSiO+ HO (5) 2+ 2 SiO+ MSiOM in c itial pH from 1.5 to 6.1 and the maximum adsorption apacity of 9.4 mg/g is observed at pH 6.1 (natural pH of suspension). The effect of pH can be explained considering the sur- face charge on the adsorbent material. At low pH values (pH 2 - 6), the low adsorption observation was explained due to increase in positive charge (protons) density on the surface sites and thus, electrostatic repulsion occurred between the metal ions (M2+: Zn2+) and the edge groups with positive charge (Si-OH2+) on the surface as follows: +2+ SiOH+ HSiOH+ H (4) urface of kaolin - es negatively charged and electrostatic repul sion decreases with raising pH due to reduction of posi- tive charge density on the sorption edges thus resulting in an increase metal adsorption. This mechanism can be shown as follows: + SiOH A similar theory was proposed by wo dsorption Isotherm Models selected in this lied to establish the (6) several earlier , rkers for metal adsorption on different adsorbents [6 33]. 3.5. A Three important isotherm models were study, which are namely the Langmuir, Freundlich and Dubinin-Radushkevich (D-R) isotherm models. 3.5.1. Langmuir Isotherm Model Langmuir isotherm model was app relationship between the amount of Zn(II) adsorbed onto kaolin clay and its equilibrium concentration in aqueous solution. Langmuir adsorption isotherm [34] is applied to equilibrium adsorption assuming monolayer adsorption onto a surface with a finite number of identical sites and Copyright © 2013 SciRes. JWARP 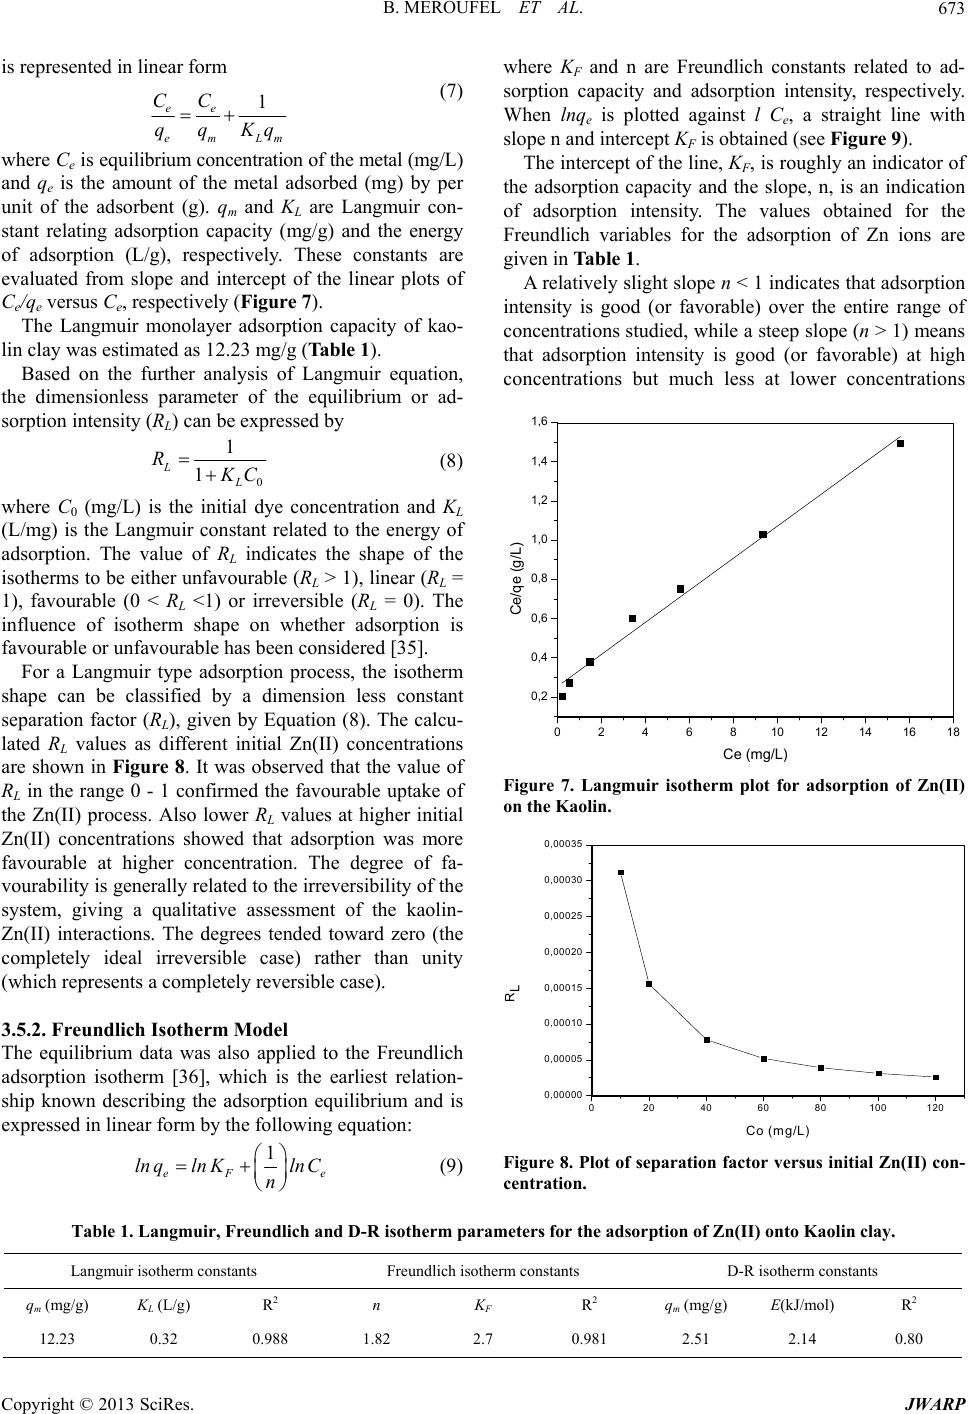 B. MEROUFEL ET AL. Copyright © 2013 SciRes. JWARP 673 where KF and n are Freundlich constants related to ad- sorption capacity and adsorption intensity, respectively. When lnq e is plotted against l Ce, a straight line with slope n and intercept KF is obtained (see Figure 9). is represented in linear form 1 ee CC qq (7) em Lm Kq where Ce is equilibrium concentration of the metal (mg/L) and q is the amount of the metal adsorbed (mg) by per le 1). or ad- so The intercept of the line, KF, is roughly an indicator of the adsorption capacity and the slope, n, is an indication of adsorption intensity. The values obtained for the Freundlich variables for the adsorption of Zn ions are given in Table 1. e unit of the adsorbent (g). qm and KL are Langmuir con- stant relating adsorption capacity (mg/g) and the energy of adsorption (L/g), respectively. These constants are evaluated from slope and intercept of the linear plots of Ce/qe versus Ce, respectively (Figur e 7). The Langmuir monolayer adsorption capacity of kao- lin clay was estimated as 12.23 mg/g (Tab A relatively slight slope n < 1 indicates that adsorption intensity is good (or favorable) over the entire range of concentrations studied, while a steep slope (n > 1) means that adsorption intensity is good (or favorable) at high concentrations but much less at lower concentrations Based on the further analysis of Langmuir equation, the dimensionless parameter of the equilibrium rption intensity (RL) can be expressed by 0 1 1 L L R C (8) 0 2 4 6 81012141618 0,2 0,4 0,6 0,8 1,0 1,2 1,4 1,6 where C0 (mg/L) is the initial d (L/mg) is the Langmuir constant related to the energy o ant se The equilibrium data was also applied to the Freundlich the earliest relation- ye concentration and KL f adsorption. The value of RL indicates the shape of the isotherms to be either unfavourable (RL > 1), linear (RL = 1), favourable (0 < RL <1) or irreversible (RL = 0). The influence of isotherm shape on whether adsorption is favourable or unfavourable has been considered [35]. For a Langmuir type adsorption process, the isotherm shape can be classified by a dimension less const Ce/qe (g/L) Ce (mg/L) paration factor (RL), given by Equation (8). The calcu- lated RL values as different initial Zn(II) concentrations are shown in Figure 8. It was observed that the value of RL in the range 0 - 1 confirmed the favourable uptake of the Zn(II) process. Also lower RL values at higher initial Zn(II) concentrations showed that adsorption was more favourable at higher concentration. The degree of fa- vourability is generally related to the irreversibility of the system, giving a qualitative assessment of the kaolin- Zn(II) interactions. The degrees tended toward zero (the completely ideal irreversible case) rather than unity (which represents a completely reversible case). 3.5.2. F re u ndlich Isotherm Model Figure 7. Langmuir isotherm plot for adsorption of Zn(II) on the Kaolin. 0,00000 0,00005 0,00010 0,00015 0,00020 0,00025 0,00030 0,00035 adsorption isotherm [36], which is ship known describing the adsorption equilibrium and is expressed in linear form by the following equation: 1 eF e lnqlnKln C n (9) 020406080100 120 RL Co (mg/L) Figure 8. Plot of separation factor versus initial Zn(II) con- Table 1. Langmuir, Freundlich anrameters for the adsorption of Zn(II) onto Kaolin clay. centration. d D-R isotherm pa Langmuir isotherm constants Freundlich isotherm constants D-R isotherm constants qm (mg/g)R2 n 2 qm (mg/g)R2 KL (L/g) KF R E(kJ/mol) 12.23 0.32 0.988 1.82 2.7 0.981 2.51 2.14 0.80 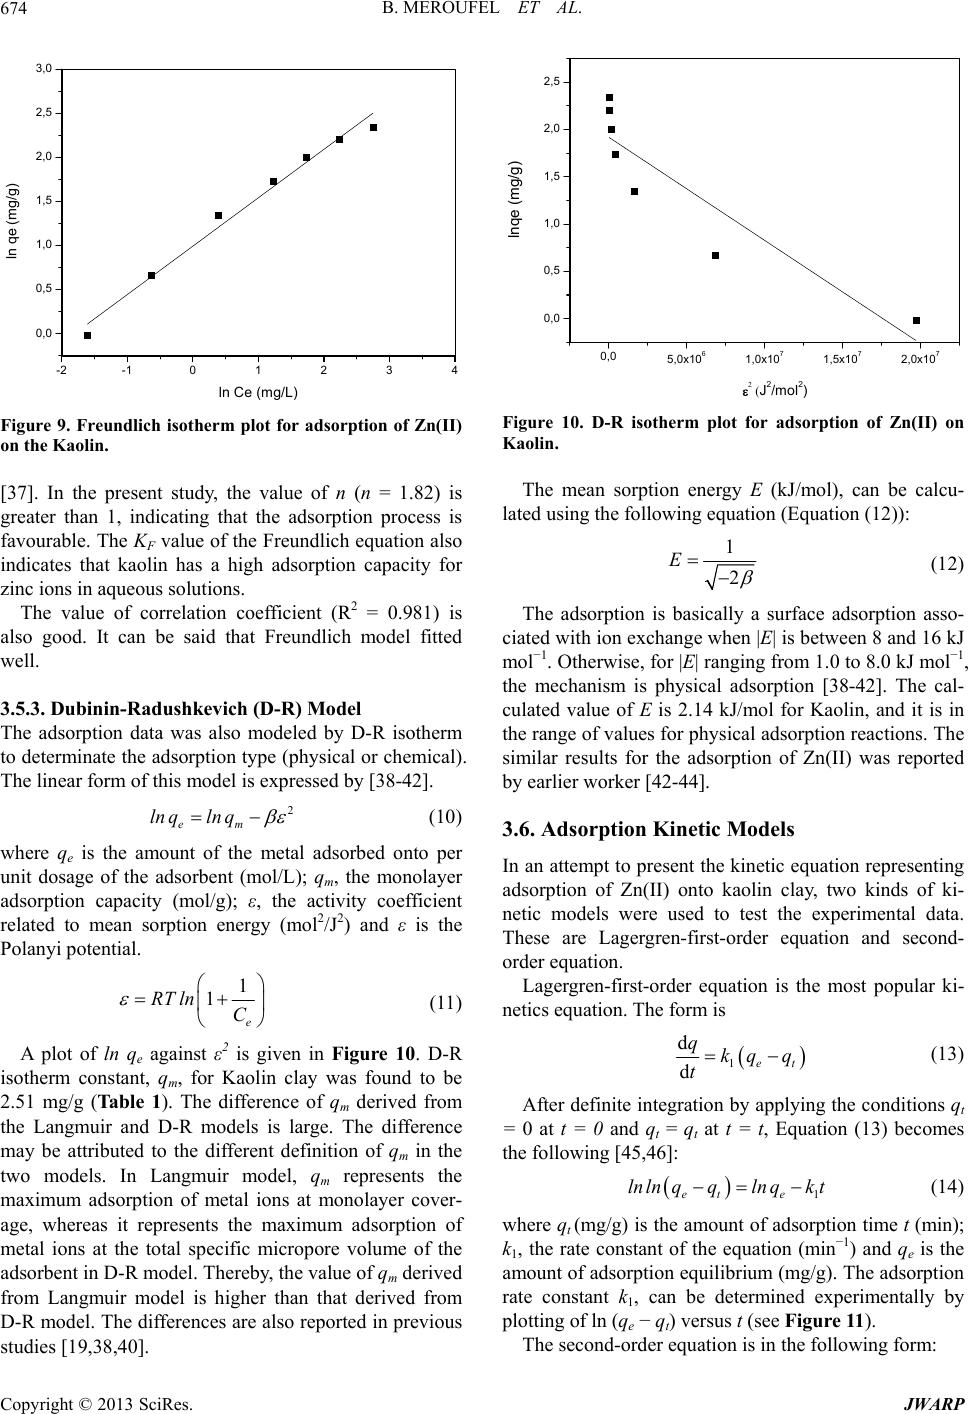 B. MEROUFEL ET AL. 674 -2-1 0,0 0,5 1,0 1,5 2,0 01234 2,5 3,0 ln qe (mg/g) ln Ce m /L Figure 9. Freundlich isotherm plot for adsorption of Zn(II) on the Kaolin. indicating that the adsorption process is vourable. The K value of the Freundlich equation also dsorption data was also modeled by D-R isotherm to determinate the adsorption type (physical or chemical). 38-42]. [37]. In the present study, the value of n (n = 1.82) is greater than 1, fa F indicates that kaolin has a high adsorption capacity for zinc ions in aqueous solutions. The value of correlation coefficient (R2 = 0.981) is also good. It can be said that Freundlich model fitted well. 3.5.3. Dubinin-Radushkevich (D-R) Model The a The linear form of this model is expressed by [ 2 em ln qln q (10) where qe is the amount of the metal adsorbed onto per unit dosage of the adsorbent (mol/L adsorption capacity (mol/g); ε, the activ ); qm, the monolayer ity coefficient related to mean sorption energy (mol2/J2) and ε is the Polanyi potential. 1 1RT ln (11) e C A plot of ln qe against ε2 is given in Figure 10. D-R isotherm constant, qm, for Kaoli 2.51 mg/g (Ta ble 1 ). The difference of q derived from th n clay was found to be m e Langmuir and D-R models is large. The difference may be attributed to the different definition of qm in the two models. In Langmuir model, qm represents the maximum adsorption of metal ions at monolayer cover- age, whereas it represents the maximum adsorption of metal ions at the total specific micropore volume of the adsorbent in D-R model. Thereby, the value of qm derived from Langmuir model is higher than that derived from D-R model. The differences are also reported in previous studies [19,38,40]. 0,0 5,0x1061,0 x10 71,5x1 072,0x10⁷ 0,0 0,5 1,0 2,5 1,5 2,0 qe (mg/g) ln J2/mo l 2) Figure 10. D-R isotherm plot for adsorption of Zn(II) on Kaolin. The mean sorption energy E (kJ/mol), can be calcu- lated using the following equation (Equation (12)): 1 2 E (12) The adsorption is basically a surface adsorption asso- ci mol−1, the mechanism is physical adsorption [38-42]. The cal- culated value of E is 2.14 kJ/m the range of values for physical adsorption reactions. The si -order equation and second- e most popular ki- ated with ion exchange when |E| is between 8 and 16 kJ mol−1. Otherwise, for |E| ranging from 1.0 to 8.0 kJ ol for Kaolin, and it is in milar results for the adsorption of Zn(II) was reported by earlier worker [42-44]. 3.6. Adsorption Kinetic Models In an attempt to present the kinetic equation representing adsorption of Zn(II) onto kaolin clay, two kinds of ki- netic models were used to test the experimental data. These are Lagergren-first order equation. Lagergren-first-order equation is th netics equation. The form is 1 d det qkq q t (13) After definite integration by applying the conditions qt = 0 at t = 0 and qt = qt at t = t, Equation (13) becomes the following [45,46]: eet qlnlnqlnq1 k t where q(mg/g) is the amount of adsorption time t (min); k determined experimentally by plotting of ln (qe − qt) versus t (see Figur The second-order equation is in the fo (14) t 1, the rate constant of the equation (min−1) and qe is the amount of adsorption equilibrium (mg/g). The adsorption rate constant k1, can be e 11). llowing form: Copyright © 2013 SciRes. JWARP 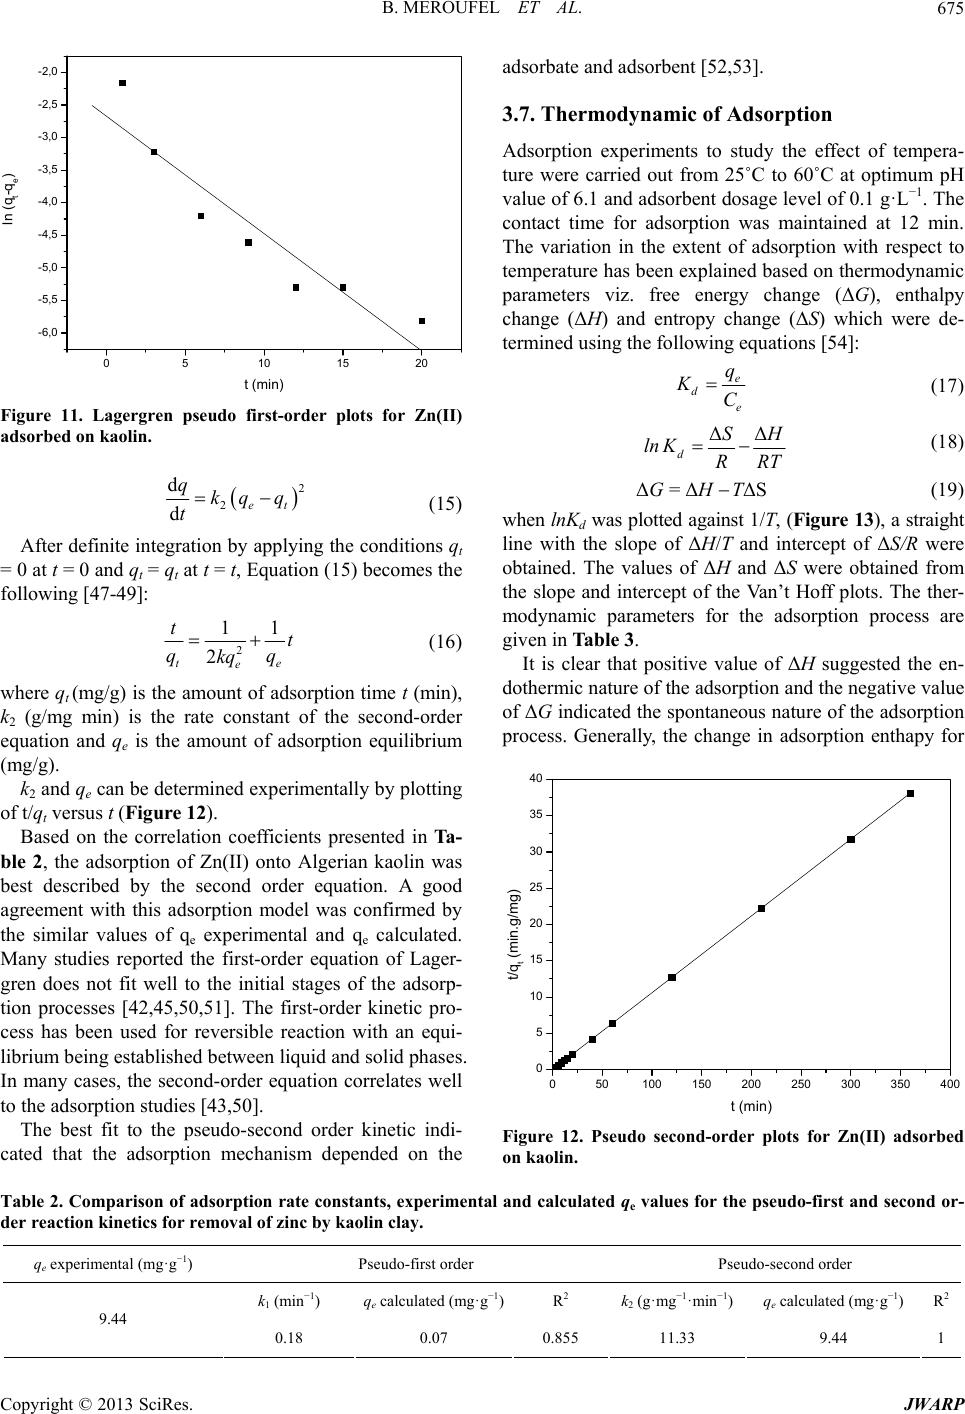 B. MEROUFEL ET AL. 675 0510 15 20 -6,0 -5,5 -5,0 -4,5 -4,0 -3,5 -3,0 -2,5 -2,0 )ln (qt-qe t (min) Figure 11. Lagergren pseudo first-order plots for Zn(II) adsorbed on kaolin. 2 2et kq q (15) d d q t After definite integration by applying the conditions qt = 0 at t = 0 and qt = qt at t = t, Equation (15) becomes the llowing [47-49]: fo 2 11 2 te e t qq kq w he amount of adsorption equilibrium (mg/g). k2 and qe can be determined exper of t/qt versus t (Figure 12). nt with this adsorption model was confirmed by th rst-order equation of Lager- gr t (16) here qt (mg/g) is the amount of adsorption time t (min), k2 (g/mg min) is the rate constant of the second-order equation and qe is t imentally by plotting Based on the correlation coefficients presented in Ta- ble 2, the adsorption of Zn(II) onto Algerian kaolin was best described by the second order equation. A good agreeme e similar values of qe experimental and qe calculated. Many studies reported the fi en does not fit well to the initial stages of the adsorp- tion processes [42,45,50,51]. The first-order kinetic pro- cess has been used for reversible reaction with an equi- librium being established between liquid and solid phases. In many cases, the second-order equation correlates well to the adsorption studies [43,50]. The best fit to the pseudo-second order kinetic indi- cated that the adsorption mechanism depended on the adsorbate and adsorbent [52,53]. 3.7. Thermodynamic of Adsorption Adsorption experiments to study the effect of tempera- ture were carried out from 25˚C to 60˚C at optimum pH value of 6.1 and adsorbent dosage level of 0.1 g·L−1. The contact time for adsorption was maintained at 12 min. The variation in the extent of adsorption with respect to temperature has been explained based on thermodynamic parameters viz. free energy change (ΔG), enthalpy change (ΔH) and entropy change (ΔS) which were de- termined using the following equations [54]: e d e q KC (17) ΔΔ d S R lK RT n Δ=ΔΔSGH T (18) (19) when lnKd was plotted against 1/T, (Figure 13), a straight line with the slope of ΔH/T and intercept of ΔS/R were obtained. The values of ΔH and ΔS were obtained from the slope and intercept of the Van’t Hoff plots. The ther- modynamic parameters for the adsorption process are given in Table 3. It is clear that positive value of ΔH suggested the en- dothermic nature of the adsorption and the negative value of ΔG indicated the spontaneous nature of the adsorption process. Generally, the change in adsorption enthapy for 050100 150 200 250 300 350 400 0 5 10 15 20 25 30 35 40 t/qt (min.g/mg) t min Figure 12. Pseudo second-order plots for Zn(II) adsorbed on kaolin. Table 2. Comparison of adsorption rate constants, experimen der reaction kine ti cs for removal of zinc by kaolin clay. tal and calculated qe values for the pseudo-first and second or- Pseudo-second order qe experimental (mg·g−1) Pseudo-first order k1 (min−1) qe calculated (mg·g−1) R2 k2 (g·mg−1·min−1) qe calculated (mg·g−1) R2 9.44 0.18 0.07 0.855 11.33 9.44 1 Copyright © 2013 SciRes. JWARP 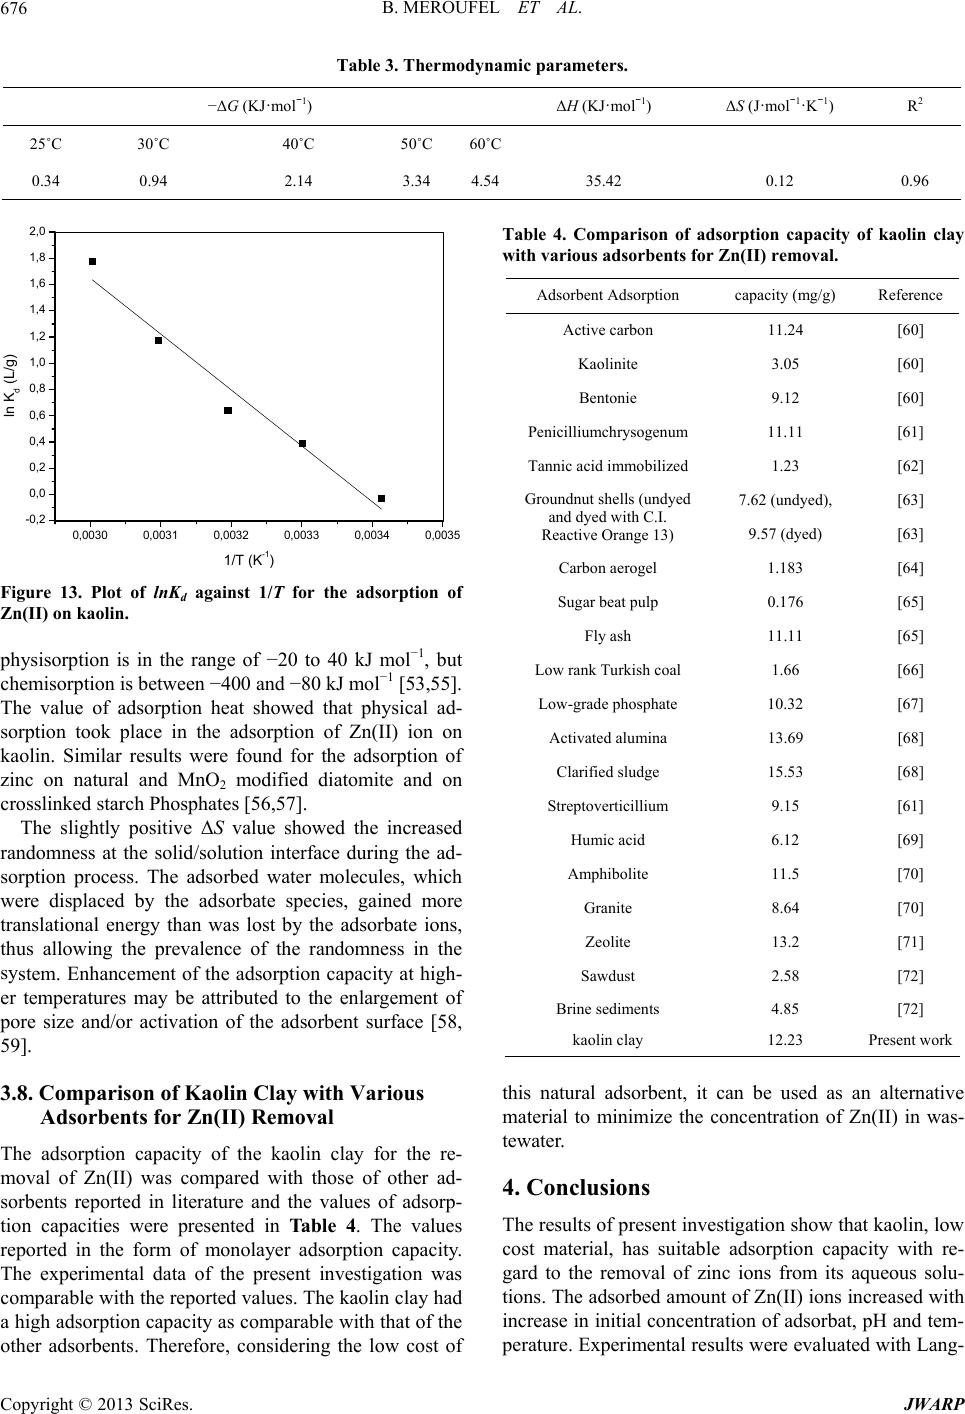 B. MEROUFEL ET AL. 676 Table 3. Thermodynamic parameters. −ΔG (KJ·mol−1) ΔH (KJ·mol−1) R2 ΔS (J·mol−1·K−1) 25˚C 30˚C 40˚C 50˚C 60˚C 0.34 0.94 3.4.54 35.42 0.12 0.96 2.1434 0,0030 0,0031 0,00320,0033 -0,2 0,0 0,2 0,4 0,6 0,8 1,0 0,0034 0,0035 1,4 1,8 2,0 1,2 1,6 ln Kd (L/g) 1/T (K-1) Figure 13. Plot of lnKd against 1/T for the adsorption of Zn(II) on kaolin. physisorption is in the range of −20 to 40 kJ mol−1, but chemisorption is between −400 and −80 kJ mol−1 [53,55]. The value of adsorption heat showed that physical ad- inc on natural and MnO2 modified diatomite and on andomness in the sy nts reported in literature and the values of adsorp- ues ity. The estigation was other adsorbents. Therefore, considering the low cost of Table 4. Comparison of adsorption capacity of kaolin clay with vants for Z Adsorbent Adsorption capaci (mg/g) Refer sorption took place in the adsorption of Zn(II) ion on kaolin. Similar results were found for the adsorption of z crosslinked starch Phosphates [56,57]. The slightly positive ΔS value showed the increased randomness at the solid/solution interface during the ad- sorption process. The adsorbed water molecules, which were displaced by the adsorbate species, gained more translational energy than was lost by the adsorbate ions, thus allowing the prevalence of the r stem. Enhancement of the adsorption capacity at high- er temperatures may be attributed to the enlargement of pore size and/or activation of the adsorbent surface [58, 59]. 3.8. Comparison of Kaolin Clay with Various Adsorbents for Zn(II) Removal The adsorption capacity of the kaolin clay for the re- moval of Zn(II) was compared with those of other ad- sorbe tion capacities were presented in Table 4. The val reported in the form of monolayer adsorption capac experimental data of the present inv comparable with the reported values. The kaolin clay had a high adsorption capacity as comparable with that of the rious adsorben(II) removal. tyence Acbon tive car11.24[60] Kaolinite 3.05 [60] [64] Low r coal Low-hate Present work Bentonie 9.12 [60] Penicilliumchrysogenum 11.11 [61] Tannic acid immobilized 1.23 [62] 7.62 (undyed), [63] Groundnut shells (undyed and dyed with C.I. Reactive Orange 13) 9.57 (dyed) [63] Carbon aerogel 1.183 Sugar beat pulp 0.176 [65] Fly ash 11.11 [65] ank Turkish1.66 [66] grade phosp10.32 [67] Activated alumina 13.69 [68] Clarified sludge 15.53 [68] Streptoverticillium 9.15 [61] Humic acid 6.12 [69] Amphibolite 11.5 [70] Granite 8.64 [70] Zeolite 13.2 [71] Sawdust 2.58 [72] Brine sediments 4.85 [72] kaolin clay 12.23 this nt, it can b as an ale matethe concentration of Zn(II- tewater. 4. Con The result investigatioow that kalow cost mates suitable adsoacity with re- gard to the removal of zinc ions from its aqueous solu- tions. Thd amount of Zons increath increacentration of adsorbat, pH em- perature. Experimental results were evaluated with Lang- atural adsorbene usedternativ rial to minimize ) in was clusions ts of presenn sholin, rial, harption cap e adsorben(II) ised wi se in initial conand t Copyright © 2013 SciRes. JWARP  B. MEROUFEL ET AL. 677 muir, Fnd Dubinin-Rkevic addition to higher values of correlation coefficients, Freundlich isotherms for zinc metal. Pseudo- on kinetic has provided a realistic of Zn2+ with similar values Liang, C. T. Gao and W. Q. Chen, “Heavy Me- reundich aadushh isotherms. In monolayer capacities (qm) determined from Langmuir isotherm and adsorption intensity (n) determined from Freundlich isotherm indicate appropriateness of Lang- muir and second-order reacti description for removal of q e calculated and qe experimental, whereas in the first order kinetic the difference between these values is large. The correlation coefficient was also higher in pseudo-second- order kinetic. The enthalpy change for the adsorption process was indicative of the endothermic nature of adsorption. The dimensionless separation factor (RL) showed that kaolin can be used for removal of zinc ions from aqueous solu- tions. The results of this research were compared to the published data in the same field, and found to be in agreement with most of them. The batch design may be useful for environmental technologist in designing treat- ment plants for metal removal from wastewaters. REFERENCES [1] L. P. Zhang, X. Ye, H. feng, Y. H. Jing, T. Ouyang, X. T. Yu, R. R. tal Contamination in Western Xiamen Baysediments and Its Vicinity,” Marine Pollution Bulletin, Vol. 54, No. 7, 2007, pp. 974-982. doi:10.1016/j.marpolbul.2007.02.010 [2] Y. B. Sun, Q. X. Zhou, X. K. Xie and R. Liu, “Spatial Sources and Risk Assessment of Heavy Metal Contami- nation of Urban Soils in Typical Regions of Shenyang,” Journal of Hazardous Materials, Vol. 174, No. 1-3, 2010, pp. 455-462. doi:10.1016/j.jhazmat.2009.09.074 [3] R. L. Yu, X. Yuan, Y. H. Zhao and X. L. Tu, “Heavy Me- tal Pollution in Intertidal Sediments from Quanzhou Bay,” Journal of Environmental Sciences, Vol. 20, No. 6, 2008, pp. 664-669. doi:10.1016/S1001- 0742(08)62110-5 [4] NRC (Nationarinking Waterl Research Council), “D and Public Health Safe Drinking Water Committee,” National Academy Press, Washington DC, 1977. [5] World Health Organization, “Guidelines for Drinking Water Quality,” Vol. 1, WHO, 1993, p. 52. V. C. Srivastava, I. D. Mall and I. M. Mishra, “Charac-[6] terization of Mesoporous Rice Husk Ash (RHA) and Ad- sorption Kinetics of Metal Ions from Aqueous Solution onto RHA,” Journal of Hazardous Materials, Vol. 134, No. 1-3, 2006, pp. 257-267. doi:10.1016/j.jhazmat.2005.11.052 [7] J. A. Grout and C. D. Levings, “Effects of Acid Mine Drainage from an Abandoned Copper Mine, Britannia Mines, Howe Sound, British Columbia, Canada, on Trans- planted Blue Mussels (Mytilus edulis),” Marine Environ- mental Research, Vol. 51, No. 3, 2001, pp. 265-288. doi:10.1016/S0141-1136(00)00104-5 [8] C. Lin, Y. Wu, W. Lu, A. Chen and Y. Liu, “Water Chem- istry and Ecotoxicity of an Acid Mine Drainage-Affected No. 1-2, 2007, Stream in Subtropical China during a Major Flood Event,” Journal of Hazardous Materials, Vol. 142, pp. 199-207. doi:10.1016/j.jhazmat.2006.08.006 [9] R. Y. Ning, “Arsenic Removed by Reverse Osmosis,” Desalination, Vol. 143, No. 3, 2002, pp. 237-241. doi:10.1016/S0011-9164(02)00262-X [10] G. U. Von, “Oxidation Kinetics and Water Research, Vol. 37, No. 7, 2003 Product Formation,” , pp. 1443-1467. doi:10.1016/S0043-1354(02)00457-8 [11] X. Chen, G. Chen and P. L. Yue, “Novel Electrode System for Electroflotation of Wastewater,” Environmental Sci- ence and Technology, Vol. 36, No. 4, 2002, pp. 778-783. doi:10.1021/es011003u [12] Z. Hu, L. Lei, Y. Li and Y. Ni, “Chromium Adsorption on High-Performance Activated Carbons from Aqueous So- lution,” Separation and Purification Technology, Vol. 31, No. 1, 2003, pp. 13-18. doi:10.1016/S1383-5866(02)00149-1 [13] Z. Reddad, C. Gerente, Y. Andres, J. F. Thibault and P. Le Cloirec, “Cadmium and Lead Adsorption by Natural Poly- saccharide in MF Membrance Reactor: Experiment lysis and Modeling,” Water Research al Ana- , Vol. 37, No. 16, 2003, pp. 3983-3991. doi:10.1016/S0043-1354(03)00295-1 W. Ciesielski, C. Y. Lii, M. T. Yen an[14] d P. Tomasik, “In- ternation of Starch with Salt of Metals from the Transition Groups,” Carbohydrate Polymers, Vol. 51, No. 1, 2003, pp. 47-56. doi:10.1016/S0144-8617(02)00108-X [15] H. Hyung and J. H. Kim, “A Mechanistic Study on Boron Rejection by Sea Water Reverse Osmosis Membranes,” Journal of Membrane Science, Vol. 286, No. 1-2, 2006, pp. 269-278. doi:10.1016/j.memsci.2006.09.043 [16] G. A. Waychunas, C. C. Fuller and J. A. Dav Complexation and Precipitate Geom is, “Surface etry for Aqueous Zn(II) Sorption on Ferrihydrite I: X-Ray Absorption Ex- tended Fine Structure Spectroscopy Analysis,” Geochi- mica et Cosmochimica Acta, Vol. 66, No. 7, 2002, pp. 1119-1137. doi:10.1016/S0016-7037(01)00853-5 [17] D. Pérez-Quintanillaa and I. Del Hierroa, “Mesoporous Silica Functionalized with 2-Mercaptopyridine: Synthesis, Characterization and Employment for Hg(II) Adsorption,” Microporous Mesoporous Materials, Vol. 89, No. 1-3, 2006, pp. 58-68. doi:10.1016/j.micromeso.2005.10.012 [18] R. De Pablo, M. L. Chávez and M. Abatal, “Adsorption of Heavy Metals in Acid to Alkaline Environments by Montmorillonite and Ca-Montmorillonite,” Chemical En- gineering Journal, Vol. 171, No. 3, 2011, pp. 1276-1286. doi:10.1016/j.cej.2011.05.055 [19] M. A. Zenasni, S. Benfarhi, A. Merlin, S. Molina, B. Ge- orge and B. Meroufel, “Adsorption of Cu(II) on Maghnite from Aqueous Solution: Effects of pH, Initial Concentra- tion, Interaction Time and Temperature,” Natural Science, Vol. 10, No. 11, 2012, pp. 856-868. doi:10.4236/ns.2012.411114 [20] I. Ikhsan, B. B. Johson, J. D. Wells and M. J. Angove, “Adsorption of Aspartic Acid,” Journal of Colloid and In- terface Science, Vol. 273, No. 1, 2004, pp. 1-5. doi:10.1016/j.jcis.2004.01.061 Copyright © 2013 SciRes. JWARP  B. MEROUFEL ET AL. 678 [21] A. Sari and O. Isildak, “Adsorption Properties of Stearic Acid onto Untreated Kaolinite,” Bulletin of The Chemical Society of Ethiopia, Vol. 20, 2006, pp. 1-9. doi:10.4314/bcse.v20i2.61410 [22] M. J. Angove, B. B. Johson and J. D. Wells, “Adsorption of Cadmium(II) on Kaolinite,” Colloids and Surfaces A: Physicochemical and Engineering Aspects, Vol. 126, No. 2-3, 1997, pp. 137-147. doi:10.1016/S0927-7757(96)03990-8 [23] K. O. Adebowale, I. E. Unuabonah and B. I. Olu-Owolabi, “The Effect of Some Operating Vari tion of Lead and Cadmium Io ables on the Adsorp- ns on Kaolinite Clay,” Jour- nal of Hazardous Materials, Vol. 134, No. 1-3, 2006, pp. 130-139. doi:10.1016/j.jhazmat.2005.10.056 [24] K. G. Bhattacharyya and S. S. Gupta, “Kaolinite and Mont- morillonite as Adsorbents for Fe(III), Co(II) and Ni(II) in Aqueous Medium,” Applied Clay Science, Vol. 41, No. 1- 2, 2008, pp. 1-9. doi:10.1016/j.clay.2007.09.005 [25] K. G. Bhattacharyya and S. S. Gupta, “Kaol morillonite, and Their Modified inite, M Derivatives as Adsorb- ont- ents for Removal of Cu(II) from Aqueous Solution,” Se- paration and Purification Technology, Vol. 50, No. 3, 2006, pp. 388-397. doi:10.1016/j.seppur.2005.12.014 [26] S. S. Gupta and K. G. Bhatt tal Ions with Clays: I. A Case Study w acharyya, “Interaction of ith Pb(II),” Applied Me- Clay Science, Vol. 30, No. 3-4, 2005, pp. 199-208. doi:10.1016/j.clay.2005.03.008 [27] Y. Yukselen and A. Kaya, “Suitability of Methylene Blue Test for Surface Area, Cation Exchange Capacity and Swell Potential Determination of Clayey Soils,” Engi- neering Geology, Vol. 102, No. 1-2, 2008, pp. 38-45. doi:10.1016/j.enggeo.2008.07.002 [28] S. Wang, Z. Nan, Y. Li and Z. Zhao, “The Chemical Bon- ding of Copper Ions on Kaolin from Suzhou, China,” Desalination, Vol. 228, 2009, pp. 97-107. [29] M. L. Granizo, M. T. B. Varela and S. Martinez-Ramirez, “Alkali Activation of Metakaolins: Parameters Affecting Mechanical, Structural and Microstructural Properties,” Journal of Materials Science, Vol. 42, No. 9, 2007, pp. 2934-2943. doi:10.1007/s10853-006-0565-y [30] A. G. S. Cristóbal, R. Castelló, M. A. M. Luengo and C. Vizcayno, “Zeolites Prepared from Calcined and chanically Modified Kaolins: A Me- Comparative Study ,” Ap- plied Clay Science, Vol. 49, No. 3, 2010, pp. 239-246. doi:10.1016/j.clay.2010.05.012 [31] E. Galan, P. Aparicio, A. Miras, K. Michailidis and A. Tsirambides, “Technical Properties of Compounded K lin Sample from Griva (Macedon ao- ia, Greece),” App lied Clay Science, Vol. 10, No. 6, 1996, pp. 477-490. doi:10.1016/0169-1317(95)00041-0 [32] M. Q. Jiang, X. Y. Jin, X. Q. Lu and Z. L. Chen, “Adsorp- tion of Pb(II), Cd(II), Ni(II) and Cu(II) onto Natural Kao- linite Clay,” Desalination, Vol. 252, No. 1-3, 2010, pp. 33-39. doi:10.1016/j.desal.2009.11.005 [33] A. Sari, M. Tuzen, D. Citak and M. Soylak, “Equilibrium, Kinetic and Thermodynamic Studies of Adsorption of Pb(II) from Aqueous Solution onto Turkish Kaolinite Clay,” Journal of Hazardous Materials, Vol. 149, No. 2, 2007, pp. 283-291. doi:10.1016/j.jhazmat.2007.03.078 [34] I. Langmuir, “The Adsorption of Gases on Plane Surfaces of Glass, Mica and Platinum,” Journal of the Americ Chemical Society, Vol. 40, No. 9 an , 1918, pp. 1361-1403. doi:10.1021/ja02242a004 [35] M. O Zacar and I. A. S. Engil, “Equilibrium Data and Process Design for Adsorption of Disperse Dyes onto Alunite,” Environment Geology, Vol. 45, No. 6, 2 762-768. 004, pp. 36-5doi:10.1007/s00254-003-09 Modified Unye [36] H. Freundlich, “Über die Adsorption in lösungen,” Zeits- chrift für Physikalische Chemie (Leipzig), Vol. 57, 1906, pp. 385-470. [37] E. Eren, “Removal of Copper Ions by Clay, Turkey,” Journal of Hazardous Materials, Vol. 159, No. 2-3, 2008, pp. 235-244. doi:10.1016/j.jhazmat.2008.02.035 [38] A. Sari, M. Tuzen and M. Soylak, “Adsorption of Pb(II) and Cr(III) from Aqueous Solution on Celtek Clay,” Jour- nal of Hazardous Materials, Vol. 144, No. 1-2, 2007, pp. 41-46. doi:10.1016/j.jhazmat.2006.09.080 [39] A. Sari, M. Tuzen, D. Citak and M. Soylak, “Adsorption Characteristics of Cu(II) an d Pb(II) onto Expanded Perlite from Aqueous Solution,” Journal of Hazardous Materials, Vol. 148, No. 1-2, 2007, pp. 387-394. doi:10.1016/j.jhazmat.2007.02.052 [40] D. Xu, X. L. Tan, C. L. Chen and X. K. Wang, “Adsorp- ience, Vol. 41, No. 1-2, 2008, pp. tion of Pb(II) from Aqueous Solution to MX-80 Bentonite: Effect of pH, Ionic Strength, Foreign Ions and Tempera- ture,” Applied Clay Sc 37-46. doi:10.1016/j.clay.2007.09.004 [41] A. Günay, E. Arslankaya and I. Tosun, “Lead Removal from Aqueous Solution by Na tilolite: Adsorption Equilibrium and tural and Pretreated Clinop- Kinetics,” Journal of Hazardous Materials, Vol. 146, No. 1-2, 2007, pp. 362- 371. doi:10.1016/j.jhazmat.2006.12.034 [42] S. Veli and B. Alyüz, “Adsorption of Copper and Zinc from Aqueous Solutions by Using Natural Clay,” Journal of Hazardous Materials, Vol. 149, No. 1, 2007, pp. 226- 233. doi:10.1016/j.jhazmat.2007.04.109 [43] P. Ding, K. L. Huang, G. Y. Li, Y. F. Liu and W. W. Zeng, “Kinetics of Adsorption of Zn(II) Ion on tives,” International Journal of Bi Chitosan Deriva- ological Macromole- cules, Vol. 39, No. 4-5, 2006, pp. 222-227. doi:10.1016/j.ijbiomac.2006.03.029 [44] C. H. Weng and C. P. Huang, “Adsorption Characteristics of Zn(II) from Dilute Aqueous Solution by Fly Ash,” Colloids and Surfaces A: Physicochemical and Enginee- ring Aspects, Vol. 247, No. 1-3, 2004, pp. 137-143. doi:10.1016/j.colsurfa.2004.08.050 [45] S. Lagergren, “Zur Theorie der Sogenannten Adsorption gel Osterstoffe Kungliga Svenska vetenskapsakade- miens,” Handlingar, Vol. 24, 1898, pp. 1-39. f [46] Y. S. Ho, “Citation Review of Lagergren Kinetic Rate Equation on Adsorption Reactions,” Scientometrics, Vol. 59, No. 1, 2004, pp. 171-177. doi:10.1023/B:SCIE.0000013305.99473.c [47] Y. S. Ho, “Selection of Optimum Sorption Isotherm,” Carbon, Vol. 42, No. 10, 2004, pp. 2115-2116. Copyright © 2013 SciRes. JWARP  B. MEROUFEL ET AL. 679 doi:10.1016/j.carbon.2004.03.019 [48] C. Quintelas, H. Figueiredo and T. Tavares, of Clay Treatment on Remediation of “The Effect Diethylketone Con- taminated Wastewater: Uptake, Equilibrium and Kinetic Studies,” Journal of Hazardous Materials, Vol. 186, No. 2-3, 2011, pp. 1241-1248. doi:10.1016/j.jhazmat.2010.11.131 [49] S. C. Tsai, S. Ouyang and C. N. Hsu, “Sorption and Diffusion Behavior of Cs and Sr on Jih-Hsing Bentonite,” Applied Radiation and Isotopes, Vol. 54, No. 2, 2001, pp. 209-215. doi:10.1016/S0969-8043(00)00292-X [50] Y. S. Ho, “Review of Second-Order Models for Adsorp- tion Systems,” Journal of Hazardous Materials, Vol. 136, No. 3, 2006, pp. 681-689. doi:10.1016/j.jhazmat.2005.12.043 [51] D. Wen, Y. S. Ho and X. Tang, “Comparative Sorption Kinetic Studies of Ammonium onto Zeolite,” Jo Hazardous Materials, Vol. 133, N urnal o o. 1-3, 2006, pp. 252- f 256. doi:10.1016/j.jhazmat.2005.10.020 [52] Y. S. Ho and G. McKay, “Pseudo-Second Order Model for Sorption Processes,” Process Biochemistry, Vol. 34, No. 5, 1999, pp. 451-465. doi:10.1016/S0032-9592(98)00112-5 [53] B. Meroufel, O. Benali, M. Benyah M. A. Zenasni, “Adsorptive Remo ia, Y. Benmoussa and val of Anionic Dye aghnite,” Materials Sciences , pp. 153-161. from Aqueous Solutions by Algerian Kaolin: Characteris- tics, Isotherm, Kinetic and Thermodynamic Studies,” Journal of Materials and Environmental Science, Vol. 4, No. 3, 2013, pp. 482-491. [54] M. A. Zenasni, S. Benfarhi, A. Merlin, S. Molina, B. George and B. Meroufel, “Adsorption of Nickel in Aque- ous Solution onto Natural M and Applications, Vol. 4, No. 2, 2013 doi:10.4236/msa.2013.42018 [55] A. Safa Özcan, B. Erdem and A. Özcan, “Adsorption of Acid Blue 193 from Aqueous Solutions onto Na-Bento- nite and DTMA-Bentonite,” Journal of Colloid and Inter- face Science, Vol. 280, No. 1, 2004, pp. 44-54. doi:10.1016/j.jcis.2004.07.035 [56] N. Caliskan, A. Riza Kul, S. Alkan, E. G. Sogut and I. Alacabey, “Adsorption of Zinc(II) on Diatomite and Man- ganese-Oxide-Modified Diatomite: A Kinetic and Equi- librium Study,” Journal of Hazardous Materials, Vol. 193, No. 15, 2011, pp. 27-36. doi:10.1016/j.jhazmat.2011.06.058 [57] L. Guo, C. M. Sun, G. Y. Li, C. Liu and C. Ji, “Thermo- dynamics and Kinetics of Zn(II) Adsorption on Cross- linked Starch Phosphates,” Journal of Hazardous Materi- als, Vol. 161, No. 1, 2009, pp. 510-515. doi:10.1016/j.jhazmat.2008.04.003 [58] M. K. Jhaa, R. R. Upadhyay, J. C. Lee and V. Kumar, “Treatment of Rayon Waste Effluent for the Removal of Zn and Ca Using Indion BSR Resin,” Desalination, Vol. 228, No. 1-3, 2008, pp. 97-107. doi:10.1016/j.desal.2007.08.010 [59] Y. Zhang, Y. Li, L. Q. Yang, X. J. Ma, L. Y. Wang and Z. F. Ye, “Characterization and Adsorption Mechanism of Zn2+ Removal by PVA/EDTA Resin in Polluted Water,” Journal of Hazardous Materials, Vol. 178, No. 1-3, 2010, pp. 1046-1054. doi:10.1016/j.jhazmat.2010.02.046 [60] P. C. Mishra and R. K. Patel, “Removal of Lead Ions from Water by Low Cost Ad and Zinc sorbents,” Journal of Hazardous Materials, Vol. 168, No. 1, 2009, pp. 319-325. doi:10.1016/j.jhazmat.2009.02.026 [61] P. R. Puranik and K. M. Paknikar, “Influence of Co-Ca- tions on Biosorption of Lead and Zinc— Evaluation in Binary and Multime A Comparative tal Systems,” Biore- source Technology, Vol. 70, No. 3, 1999, pp. 269-276. doi:10.1016/S0960-8524(99)00037-1 [62] A. Ucer, A. Uyanik and S. F. Aygun, “Adsorption of Cu(II), Zn(II), Mn(II) and Fe(II Immobilized Activated Carbon,” ) Ions by Tannic Acid Separation and Purifi- cation Technology, Vol. 47, No. 3, 2006, pp. 113-118. doi:10.1016/j.seppur.2005.06.012 [63] S. R. Shukla and R. S. Pai, “Adsorption of Cu(II), Ni(II) and Zn(II) on Dye Loaded Groundnut Shells and Saw- dust,” Separation and Purification Technology, Vol. 43, No. 1, 2005, pp. 1-8. doi:10.1016/j.seppur.2004.09.003 [64] A. K. Meena, G. K. Mishra, P. K. Rai, C. Rajagopal and P. N. Nager, “Removal of Heavy Metal Ions from Aqueous Solutions Using Carbon Aerogel as an Adsorbents,” Jour- nal of Hazardous Materials, Vol. 122, No. 1-2, 2005, pp. 161-170. doi:10.1016/j.jhazmat.2005.03.024 [65] E. Pehlivan, S. Cetin and B. H. Yanik, “Equilibrium Stud- ies for the Sorption of Zinc and Copper from Aqueou Solutions Using Sugar Beat Pulp and s Fly Ash,” Journal of Hazardous Materials, Vol. 135, No. 1-3, 2006, pp. 193- 199. doi:10.1016/j.jhazmat.2005.11.049 [66] S. Karabulut, A. Karabaka, A. Deaizbi and Y. Yurcim, “Batch Removal of Copper(II) and Zinc(II) from Aqueo Solutions with Low Rank Turkish us Coals,” Separation and Purification Technology, Vol. 18, No. 3, 2000, pp. 177- 184. doi:10.1016/S1383-5866(99)00067-2 [67] M. I. Kandah, “Zinc and Cadmium Adsorption on Low- Grade Phosphate,” Separation and Purification Technol- ogy, Vol. 35, No. 1, 2004, pp. 61-70. doi:10.1016/S1383-5866(03)00131-X [68] A. K. Bhattacharya, S. N. Mandal and S. K. Das, “Ad- sorption of Zn(II) from Aqueous Solution by Using Dif- ferent Adsorbents,” Chemical Engineering Journal, Vol. 123, No. 1-2, 2006, pp. 43-51. doi:10.1016/j.cej.2006.06.012 [69] Y. Li, Q. Yue and B. Gao, “Adsorption Kinetics and De- sorption of Cu(II) and Zn(II) from Aqueous Solution onto Humic Acid,” Journal of Hazardous Materials, Vol. 178, No. 1-3, 2010, pp. 455-461. doi:10.1016/j.jhazmat.2010.01.103 [70] C. Pérez-Novo, D. Fernández-Calviño and A. Bermúdez- Couso, “Phosphorus Effect on Zn Adsorption-Desorption Kinetics in Acid Soils,” Chemosphere, Vol. 83, No. 7, 2011, pp. 1028-1034. doi:10.1016/j.chemosphere.2011.01.064 [71] E. Katsou, S. Malamis, M. Tzanoudak and M. Loizidou, “Regeneration of N i, K. Haralambous atural Zeolite Pol- luted by Lead and Zinc in Wastewater Treatment Sys- tems,” Journal of Hazardous Materials, Vol. 189, No. 3, 2011, pp. 773-786. doi:10.1016/j.jhazmat.2010.12.061 Copyright © 2013 SciRes. JWARP  B. MEROUFEL ET AL. Copyright © 2013 SciRes. JWARP 680 Heavy Metals Retention l Sorbent Developed from , 2009, pp. 536- [72] L. Agouborde and R. Navia, “ Capacity of a Non-Conventiona a Mixture of Industrial and Agricultural Wastes,” Journal of Hazardous Materials, Vol. 167, No. 1-3 544. doi:10.1016/j.jhazmat.2009.01.027
|