Paper Menu >>
Journal Menu >>
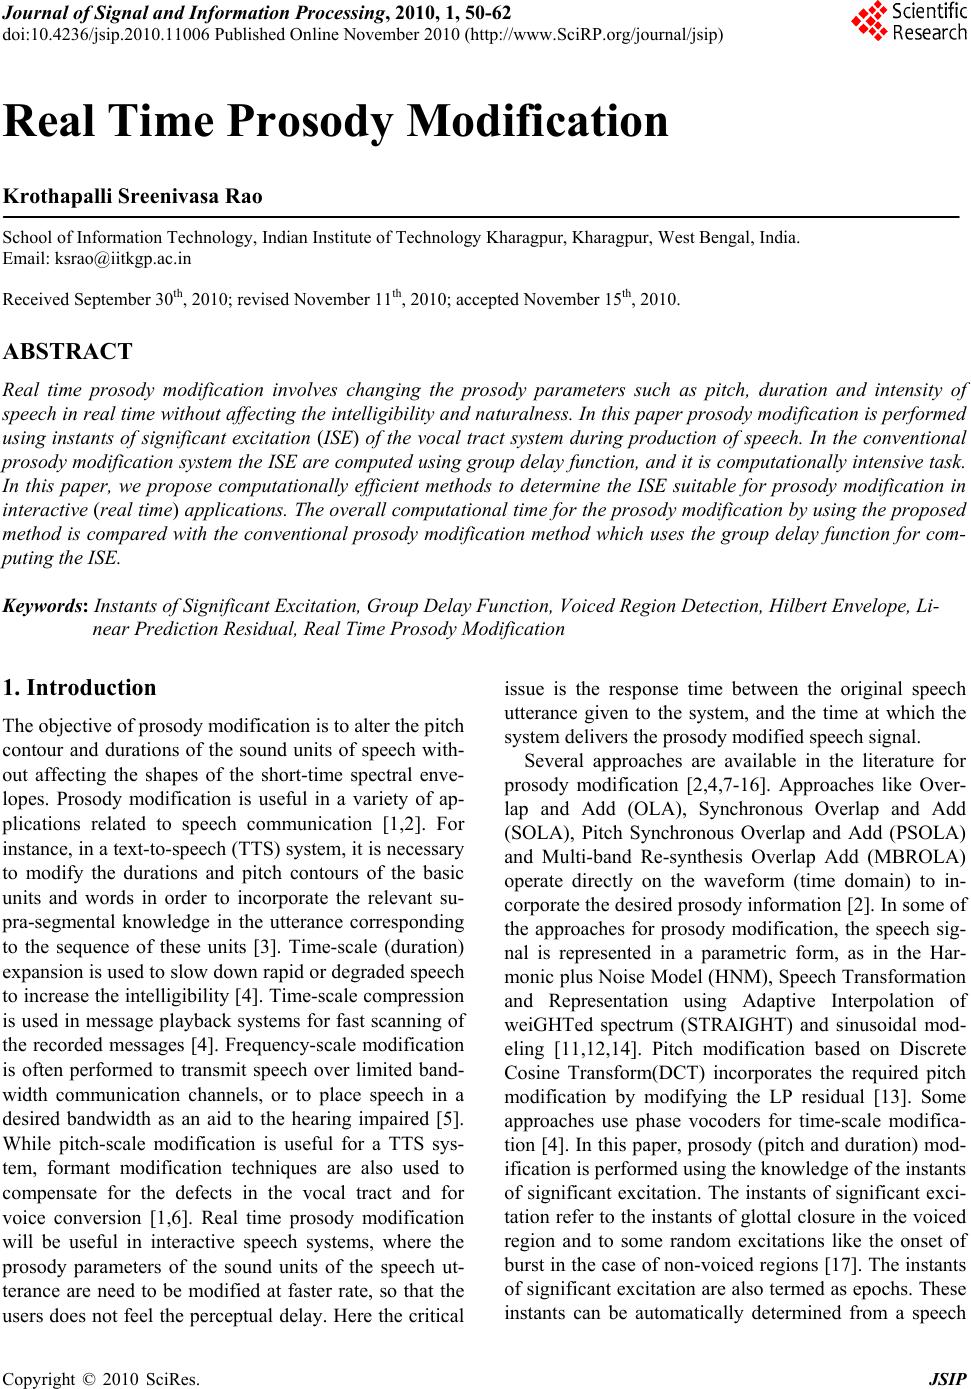 Journal of Signal and Information Processing, 2010, 1, 50-62 doi:10.4236/jsip.2010.11006 Published Online November 2010 (http://www.SciRP.org/journal/jsip) Copyright © 2010 SciRes. JSIP Real Time Prosody Modification Krothapalli Sreenivasa Rao School of Information Technology, Indian Institute of Technology Kharagpur, Kharagpur, West Bengal, India. Email: ksrao@iitkgp.ac.in Received September 30th, 2010; revised November 11th, 2010; accepted November 15th, 2010. ABSTRACT Real time prosody modification involves changing the prosody parameters such as pitch, duration and intensity of speech in real time without affecting the intelligibility and naturalness. In this paper prosody modification is performed using instants of significant excitation (ISE) of the vocal tract system during production of speech. In the conventional prosody modification system the ISE are computed using group delay function, and it is computationally intensive task. In this paper, we propose computationally efficient methods to determine the ISE suitable for prosody modification in interactive (real time) applications. The overall computational time for the prosody modification by using the proposed method is compared with the conventional prosody modification method which uses the group delay function for com- puting the ISE. Keywords: Instants of Significant Excitation, Group Delay Function, Voiced Region Detection, Hilbert Envelope, Li- near Prediction Residual, Real Time Prosody Modification 1. Introduction The objective of prosody modification is to alter the pitch contour and durations of the sound units of speech with- out affecting the shapes of the short-time spectral enve- lopes. Prosody modification is useful in a variety of ap- plications related to speech communication [1,2]. For instance, in a text-to-speech (TTS) system, it is necessary to modify the durations and pitch contours of the basic units and words in order to incorporate the relevant su- pra-segmental knowledge in the utterance corresponding to the sequence of these units [3]. Time-scale (duration) expansion is used to slow down rapid or degraded speech to increase the intelligibility [4]. Time-scale compression is used in message playback systems for fast scanning of the recorded messages [4]. Frequency-scale modification is often performed to transmit speech over limited band- width communication channels, or to place speech in a desired bandwidth as an aid to the hearing impaired [5]. While pitch-scale modification is useful for a TTS sys- tem, formant modification techniques are also used to compensate for the defects in the vocal tract and for voice conversion [1,6]. Real time prosody modification will be useful in interactive speech systems, where the prosody parameters of the sound units of the speech ut- terance are need to be modified at faster rate, so that the users does not feel the perceptual delay. Here the critical issue is the response time between the original speech utterance given to the system, and the time at which the system delivers the prosody modified speech signal. Several approaches are available in the literature for prosody modification [2,4,7-16]. Approaches like Over- lap and Add (OLA), Synchronous Overlap and Add (SOLA), Pitch Synchronous Overlap and Add (PSOLA) and Multi-band Re-synthesis Overlap Add (MBROLA) operate directly on the waveform (time domain) to in- corporate the desired prosody information [2]. In some of the approaches for prosody modification, the speech sig- nal is represented in a parametric form, as in the Har- monic plus Noise Model (HNM), Speech Transformation and Representation using Adaptive Interpolation of weiGHTed spectrum (STRAIGHT) and sinusoidal mod- eling [11,12,14]. Pitch modification based on Discrete Cosine Transform(DCT) incorporates the required pitch modification by modifying the LP residual [13]. Some approaches use phase vocoders for time-scale modifica- tion [4]. In this paper, prosody (pitch and duration) mod- ification is performed using the knowledge of the instants of significant excitation. The instants of significant exci- tation refer to the instants of glottal closure in the voiced region and to some random excitations like the onset of burst in the case of non-voiced regions [17]. The instants of significant excitation are also termed as epochs. These instants can be automatically determined from a speech 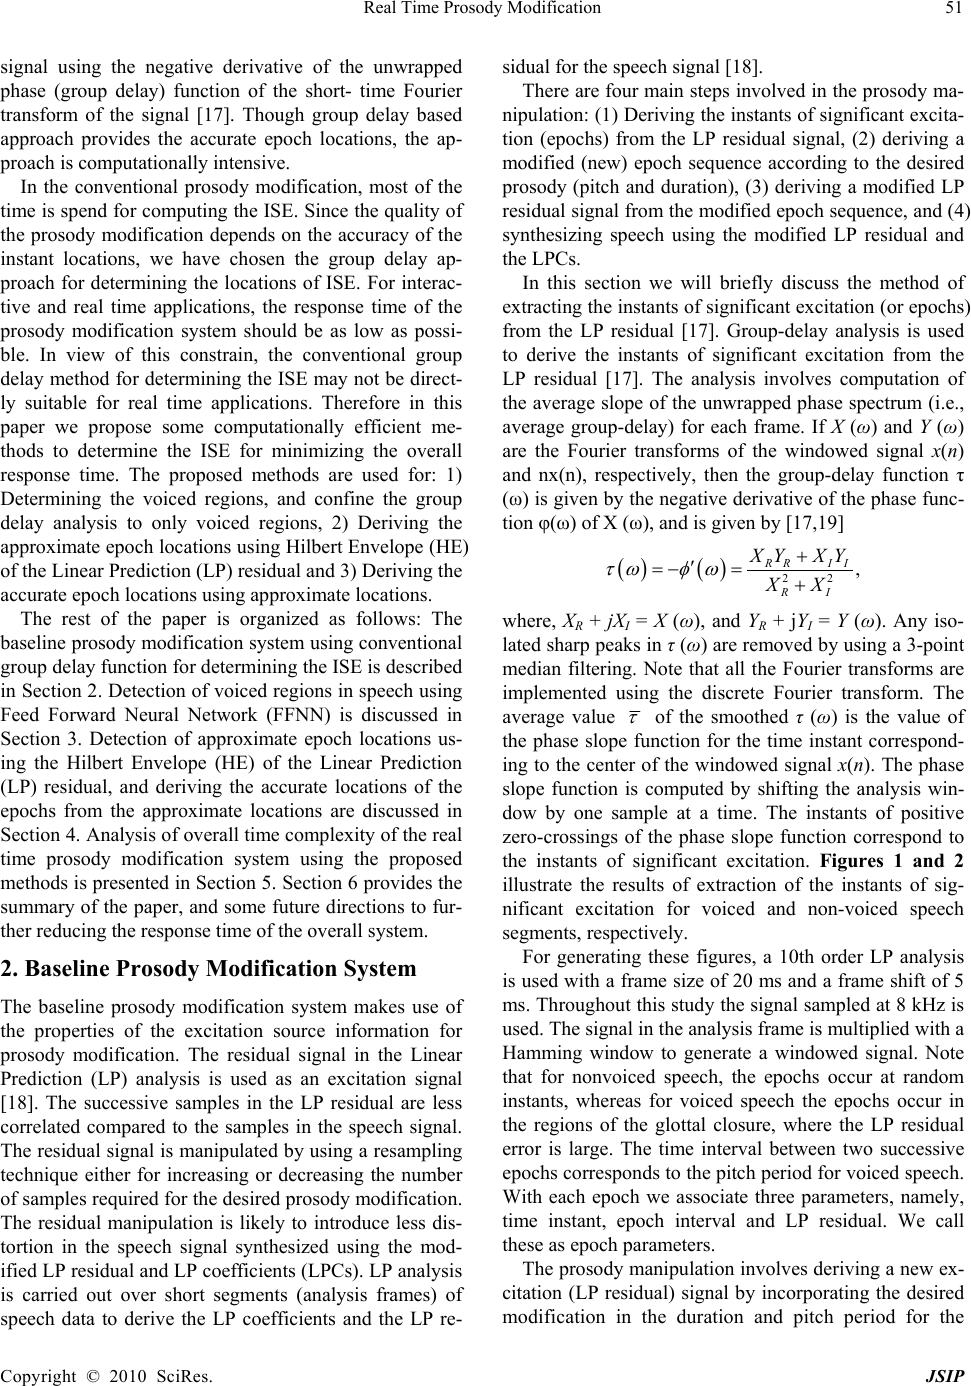 Real Time Prosody Modification Copyright © 2010 SciRes. JSIP 51 signal using the negative derivative of the unwrapped phase (group delay) function of the short- time Fourier transform of the signal [17]. Though group delay based approach provides the accurate epoch locations, the ap- proach is computationally intensive. In the conventional prosody modification, most of the time is spend for computing the ISE. Since the quality of the prosody modification depends on the accuracy of the instant locations, we have chosen the group delay ap- proach for determining the locations of ISE. For interac- tive and real time applications, the response time of the prosody modification system should be as low as possi- ble. In view of this constrain, the conventional group delay method for determining the ISE may not be direct- ly suitable for real time applications. Therefore in this paper we propose some computationally efficient me- thods to determine the ISE for minimizing the overall response time. The proposed methods are used for: 1) Determining the voiced regions, and confine the group delay analysis to only voiced regions, 2) Deriving the approximate epoch locations using Hilbert Envelope (HE) of the Linear Prediction (LP) residual and 3) Deriving the accurate epoch locations using approximate locations. The rest of the paper is organized as follows: The baseline prosody modification system using conventional group delay function for determining the ISE is described in Section 2. Detection of voiced regions in speech using Feed Forward Neural Network (FFNN) is discussed in Section 3. Detection of approximate epoch locations us- ing the Hilbert Envelope (HE) of the Linear Prediction (LP) residual, and deriving the accurate locations of the epochs from the approximate locations are discussed in Section 4. Analysis of overall time complexity of the real time prosody modification system using the proposed methods is presented in Section 5. Section 6 provides the summary of the paper, and some future directions to fur- ther reducing the response time of the overall system. 2. Baseline Prosody Modific at io n S ys te m The baseline prosody modification system makes use of the properties of the excitation source information for prosody modification. The residual signal in the Linear Prediction (LP) analysis is used as an excitation signal [18]. The successive samples in the LP residual are less correlated compared to the samples in the speech signal. The residual signal is manipulated by using a resampling technique either for increasing or decreasing the number of samples required for the desired prosody modification. The residual manipulation is likely to introduce less dis- tortion in the speech signal synthesized using the mod- ified LP residual and LP coefficients (LPCs). LP analysis is carried out over short segments (analysis frames) of speech data to derive the LP coefficients and the LP re- sidual for the speech signal [18]. There are four main steps involved in the prosody ma- nipulation: (1) Deriving the instants of significant excita- tion (epochs) from the LP residual signal, (2) deriving a modified (new) epoch sequence according to the desired prosody (pitch and duration), (3) deriving a modified LP residual signal from the modified epoch sequence, and (4) synthesizing speech using the modified LP residual and the LPCs. In this section we will briefly discuss the method of extracting the instants of significant excitation (or epochs) from the LP residual [17]. Group-delay analysis is used to derive the instants of significant excitation from the LP residual [17]. The analysis involves computation of the average slope of the unwrapped phase spectrum (i.e., average group-delay) for each frame. If X (ω) and Y (ω) are the Fourier transforms of the windowed signal x(n) and nx(n), respectively, then the group-delay function τ (ω) is given by the negative derivative of the phase func- tion φ(ω) of X (ω), and is given by [17,19] 22 , R RII RI X YXY XX where, XR + jXI = X (ω), and YR + jYI = Y (ω). Any iso- lated sharp peaks in τ (ω) are removed by using a 3-point median filtering. Note that all the Fourier transforms are implemented using the discrete Fourier transform. The average value of the smoothed τ (ω) is the value of the phase slope function for the time instant correspond- ing to the center of the windowed signal x(n). The phase slope function is computed by shifting the analysis win- dow by one sample at a time. The instants of positive zero-crossings of the phase slope function correspond to the instants of significant excitation. Figures 1 and 2 illustrate the results of extraction of the instants of sig- nificant excitation for voiced and non-voiced speech segments, respectively. For generating these figures, a 10th order LP analysis is used with a frame size of 20 ms and a frame shift of 5 ms. Throughout this study the signal sampled at 8 kHz is used. The signal in the analysis frame is multiplied with a Hamming window to generate a windowed signal. Note that for nonvoiced speech, the epochs occur at random instants, whereas for voiced speech the epochs occur in the regions of the glottal closure, where the LP residual error is large. The time interval between two successive epochs corresponds to the pitch period for voiced speech. With each epoch we associate three parameters, namely, time instant, epoch interval and LP residual. We call these as epoch parameters. The prosody manipulation involves deriving a new ex- citation (LP residual) signal by incorporating the desired modification in the duration and pitch period for the 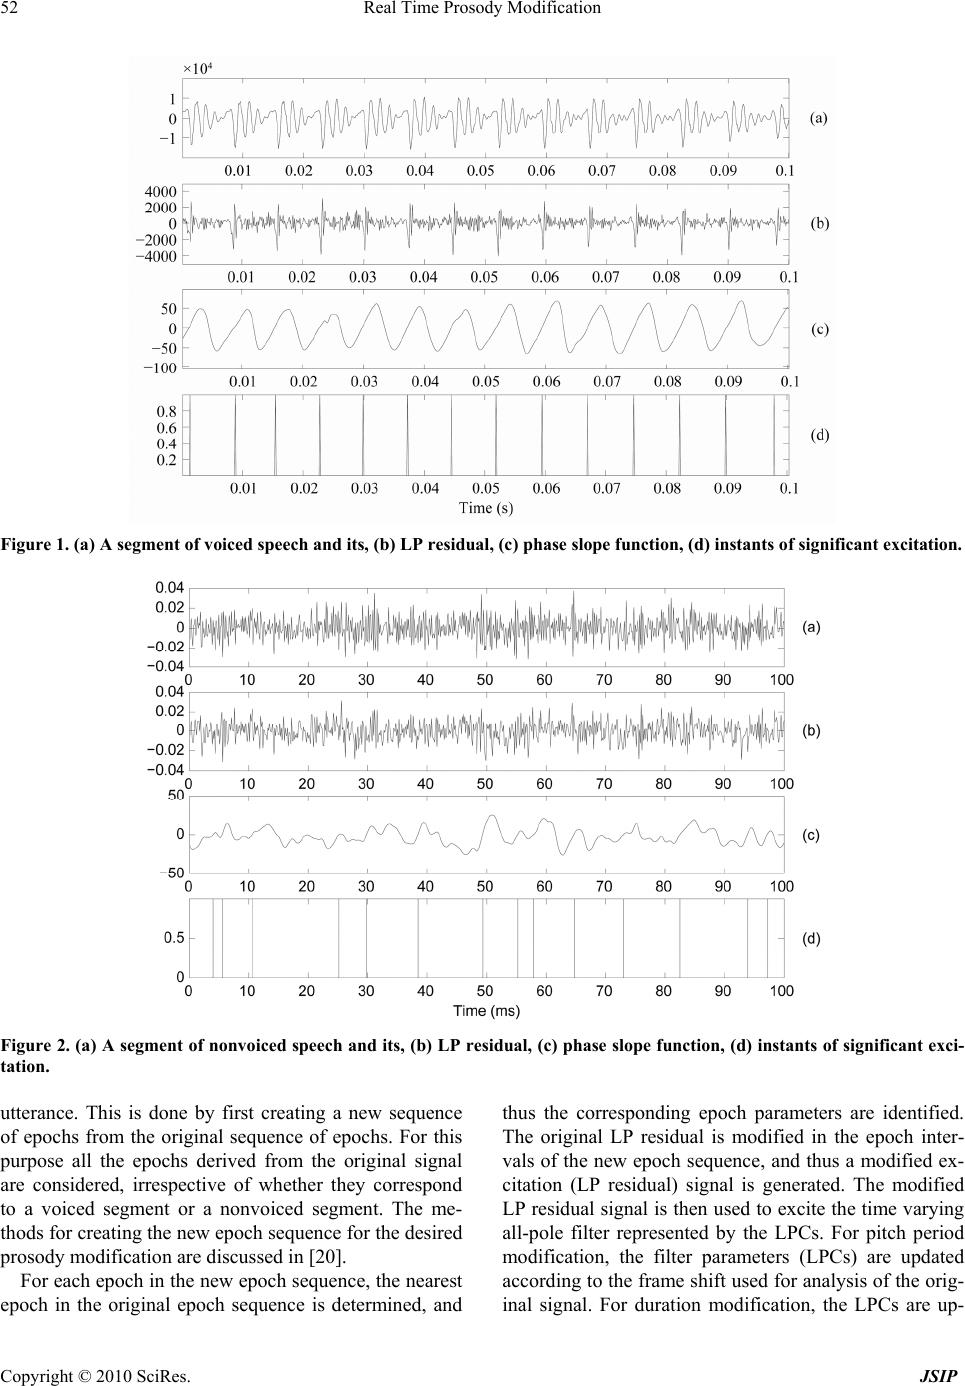 Real Time Prosody Modification Copyright © 2010 SciRes. JSIP 52 Figure 1. (a) A segment of voiced speech and its, (b) LP residual, (c) phase slope function, (d) instants of significant excitation. Figure 2. (a) A segment of nonvoiced speech and its, (b) LP residual, (c) phase slope function, (d) instants of significant exci- tation. utterance. This is done by first creating a new sequence of epochs from the original sequence of epochs. For this purpose all the epochs derived from the original signal are considered, irrespective of whether they correspond to a voiced segment or a nonvoiced segment. The me- thods for creating the new epoch sequence for the desired prosody modification are discussed in [20]. For each epoch in the new epoch sequence, the nearest epoch in the original epoch sequence is determined, and thus the corresponding epoch parameters are identified. The original LP residual is modified in the epoch inter- vals of the new epoch sequence, and thus a modified ex- citation (LP residual) signal is generated. The modified LP residual signal is then used to excite the time varying all-pole filter represented by the LPCs. For pitch period modification, the filter parameters (LPCs) are updated according to the frame shift used for analysis of the orig- inal signal. For duration modification, the LPCs are up-  Real Time Prosody Modification Copyright © 2010 SciRes. JSIP 53 dated according to the modified frame shift value. Gen- eration of the modified LP residual according to the de- sired pitch period and duration modification factors is described in [20]. Figure 3 shows the block diagram indicating various stages in prosody modification. In the baseline system all the epochs (both in voiced and non-voiced regions) were considered for prosody modification. But the epochs in the nonvoiced region are random in nature (see Figure 2) and they are not signifi- cant. Most of the nonvoiced regions contain either si- lence or pauses. Therefore, it is not necessary to modify the prosody parameters in these regions using epoch knowledge. Since, epoch extraction process is computa- tionally involved, confining the epoch extraction to only voiced regions will have the impact on the reduction of overall computational time. For verifying this point, per- ceptual tests were conducted on the synthesized speech utterances whose prosody is modified by base line me- thod (where the epochs in both voiced and nonvoiced regions are considered) and the proposed method (where the epochs in only voiced regions are considered). The results of the perceptual tests indicated that the difference in the quality of speech generated from the two methods is not significant. Therefore in the proposed prosody modification method epochs are determined only in the voiced regions, and the prosody parameters are modified in the voiced regions using epoch knowledge, and in the nonvoiced regions prosody is modified using frames of fixed size. In the proposed method the accuracy in the detection of voiced regions is crucial. If any segment of nonvoiced region is detected as voiced leads to increase in computational complexity, otherwise any voiced seg- ment detected as nonvoiced leads to mismatch in the pitch periodicity and distortion in that region. In the fol- lowing section, we discuss about the detection of voiced regions in speech. 3. Detection of Voiced Regions in Speech Voiced speech is produced as a result of excitation of vocal tract system by a quasiperiodic sequence of glottal pulses. In this paper we exploited multiple cues for ac- curate detection of the voiced regions. Various cues used in this paper are 1) Frame energy (FE), 2) Zero crossing rate (ZCR), 3) Normalized autocorrelation coefficient (NAC) and 4) Residual energy to signal energy ratio (RSR). The choice of these cues are based on the com- plexity of the extraction of the parameters and their Figure 3. Block diagram for prosody modification.  Real Time Prosody Modification Copyright © 2010 SciRes. JSIP 54 ability to discriminate between voiced and nonvoiced classes reliably. The combination of these multiple cues yields better accuracy in the classification. Between voiced/nonvoiced regions compared to indi- vidual cues. The accuracy of the classification depends on the way these multiple cues are combined. In this pa- per, three methods are explored to combine the multiple cues: 1) Sum rule (SR), 2) Majority voting (MV) and 3) Fusion using Feed Forward Neural Network (FFNN). The details of the multiple cues are briefly discussed in the following subsections. 3.1. Frame Energy Generally the energy of the voiced sounds is greater than that of the nonvoiced sounds. Frame energies are deter- mined by dividing the speech signal into non-overlapping frames of size 10 ms. Average frame energy is calculated and the threshold is selected as 10% of the average frame energy. Using the threshold, voiced and nonvoiced re- gions are separated. The critical issue in using this cue is the selection of the appropriate threshold for maximizing the detection accuracy. Some times unvoiced frames at the transition regions have comparable energies with respect to voiced frames, and this leads to detection of unvoiced as voiced frames. This will happen, if we use only this cue for detection. Hence by using multiple cues, one can minimize these inaccuracies. Figure 4 shows the speech signal and its energy contour. 3.2. Zero Crossing Rate The zero crossing rate indicates the sign changes in the input signal. A high zero crossing rates indicate the prominence of high frequency components, while a low zero crossings indicate the prominence of low frequency components. In voiced speech most of the energy is con centrated at low frequencies and for unvoiced speech high frequency components have dominant energy. Hence by using ZCR count voiced and unvoiced regions can be detected to some extent. Using this cue the diffi- culty lies in the separation of silence regions from voiced regions. Some times the ZCR of the silence portions are comparable to voiced regions. The ZCR of the silence regions depends on the characteristics of the room re- sponse, and its spectrum usually dominated by low and mid frequencies. Therefore by using multiple cues this difficulty can be resolved to some extent. Here ZCRs are computed on speech frames of size 10 ms. Figure 5 shows the speech signal and its ZCR count for the speech frames. 3.3. Normalized Autocorrelation Coefficient Speech samples in the voiced region are highly corre- lated compared to unvoiced or nonspeech regions. Hence the correlation coefficient for the speech frames in the voiced regions is close to unity, whereas for nonvoiced regions it is less than or close to zero. By using this dis- crimination, voiced and nonvoiced regions can be sepa- rated. Normalized auto correlation coefficient (C) for a speech frame can be computed using 1 2 1 1 N n N n snsn C sn where s n is the speech signal and N is the frame length considered. Figure 6 shows the speech signal and its normalized auto correlation coefficient for the speech frames. Figure 4. Speech signal and its frame energy.  Real Time Prosody Modification Copyright © 2010 SciRes. JSIP 55 Figure 5. Speech signal and its ZCR count for speech frames. Figure 6. Speech signal and its normalized auto correlation coefficient for the speech frames. 3.4. Residual Energy to Signal Energy Ratio LP residual signal is derived from the speech signal using inverse filter. Since this is the error signal in the estima- tion of speech parameters, the error is high in the case of nonvoiced regions, and it is low in the voiced regions. This is because in the voiced regions, speech samples are highly correlated and it leads to low prediction error. Whereas in nonvoiced regions (i.e., unvoiced and silence regions) the sample amplitudes are random in nature (appears like noise), and it leads to high prediction error. Therefore the residual signal contains the higher strength in nonvoiced regions and lower strength in voiced re- gions. Whereas, for the speech signal, reverse characte- ristics (i.e., voiced regions have higher strength and nonvoiced have lower strength) can Be observed. By dividing the residual energy with signal energy, nonvoiced regions are emphasized and contains the higher values compared to voiced regions. This will provide the complementary evidence with re- spect to signal energy. The problem of errors at the tran- sition regions by using signal energy cue can be over- come by using this particular cue. Figure 7 shows the speech signal and the residual to signal energy ratio. The problem of voiced region detection can be viewed as classification problem with two classes. Class-1 indi- cate the frames of voiced region and class-2 indicate the frames of nonvoiced region. The performance measures considered for this problem are false alarms, i.e., voiced frames classified as nonvoiced frames and nonvoiced frames classified as voiced frames. In both the cases one need to pay the penalty in prosody modification in the form of either distortion or increase in computational complexity. The false alarm related to frames of class-1  Real Time Prosody Modification Copyright © 2010 SciRes. JSIP 56 Figure 7. Speech signal and its residual to signal energy ratio. classified as class-2 (voiced frames as nonvoiced frames) introduces distortion, since the epochs are not extracted in those voiced regions and the prosody modification is performed based on fixed frame size. Whereas in the other case false alarm related to class-2 classified as class-1 (nonvoiced frames as voiced frames) increase the computational complexity. Since the group delay com- putation is performed on the voiced region, due to this misclassification group delay computation is performed in the nonvoiced region, which leads to increase in com- putational complexity. Therefore the basic goal is to mi- nimize the false alarms in both cases. For evaluating the performance of various cues in de- tecting the voiced regions, 100 speech utterances were chosen from Hindi broadcast news read by a male speak- er. The speech utterances were chosen in such a way that their durations are varying between 3-5 secs, and all of them have similar energy profile. The classification per- formance of the individual cues by using appropriate thresholds is given in Table 1. The first column indicates the method (cue) used for voiced/nonvoiced frame detec- tion. Second and fourth columns indicate the % of classi- fication with respect to the total number of Table 1. Accuracy of the voiced region detection using dif- ferent methods. FA1: False Alarm1 (voiced frames classi- fied as nonvoiced frames) and FA2: False Alarm2 (non- voiced frames classified as voiced frames). Method %classification FA1 FA2 True classification FE 3.43 7.06 96.57 ZCR 5.72 6.14 94.28 NAC 6.24 6.16 93.76 RSR 5.94 8.79 94.06 voiced frames. The third column shows the %of classifi- cation with respect to total number of nonvoiced frames. The classification performance can be improved by combining the cues using different fusion methods. In this paper three different fusion techniques are used for combining the evidences from multiple cues. In one of the fusion techniques, the extracted parameters for each speech frame using different cues are normalized and then they are added with appropriate weights. The linear weighted sum C is given by 4 1 . ii i Cc where ωi and ci are the weights and normalized parame- ter values associated to ith cue. The weighted sum of the extracted parameters (C) is compared with appropriate threshold (α), and the classification is performed as fol- lows: C ≥ α indicates the frame is voiced, otherwise it is unvoiced. The second fusion technique is based on majority vot- ing approach. In this approach, classification is per- formed by each cue independently, and these individual classification results are combined. The final decision is made based on the agreement of the majority cues. This technique leads to ambiguity, if both the classes (voiced and nonvoiced) receive equal votes. In this special case, the classification decision is made in favor of voiced frames, which will minimize the perceptual distortion. In the above two approaches the linear relationships between the multiple cues are exploited. For capturing the nonlinear relationships between the cues, we ex- plored Feed Forward Neural Network (FFNN) model in this paper. Neural network models are known for their ability to capture the functional relation between in-  Real Time Prosody Modification Copyright © 2010 SciRes. JSIP 57 put-output pattern pairs. The performance of the model depends on the nature of training data and the structure of the model. The classification problem here consists of four inputs (the evidences from different cues) and two outputs (two class labels corresponding to voiced and nonvoiced frames). The general structure of the FFNN is shown in Figure 8. Here the FFNN model is expected to capture the functional relationship between the input and output feature vectors of the given training data. The mapping function is between the 4-dimensional input vector and the 2-dimensional output. It is known that a neural network with two hidden layers can realize any continuous vector-valued function. The first layer is the input layer with linear units. The second and third layers are hidden layers. The second layer (first hidden layer) of the network has more units than the input layer, and it can be interpreted as capturing some local features in the input space. The third layer (second hidden layer) has fewer units than the first layer, and can be interpreted as capturing some global features [21]. The fourth layer is the output layer having two units representing two classes. The activation function for the units at the input layer is linear, and for the units at the hidden layers, it is nonlinear. Generalization by the network is influenced by three factors: The size of the training set, the architecture of the neural network, and the complexity of the problem. We have no control over the first and last factors. Several network structures were explored in this study. The (em- pirically arrived) final structure of the network is 4L-8N-3N-2N, where L denotes a linear unit, and N de- notes a nonlinear unit. The integer value indicates the number of units used in that layer. The nonlinear units use tanh(s) as the activation function, where s is the acti- vation value of that unit. All the input and output features are normalized to the range [–1, +1] before presenting them to the neural network. The backpropagation learn- ing algorithm is used for adjusting the weights of the network to minimize the mean squared error for each speech frame. For evaluating the performance of the model, speech frames from 50 sentences are used for training and the remaining 50 sentences are used for testing. For each frame, four parameters are extracted using four different cues and form the 4-dimensional feature vector. Based on the nature of the frame, the out- put vector is formed. For example, the output vector for a voiced frame will be (1 –1). The model is trained by feeding the 4-dimensional vector as input, and its asso- ciated 2-dimensional vector as output. The performance of the model for the test patterns is given in Table 2. From the results, it is observed that the detection accura- cy of voiced/nonvoiced regions is superior by combining multiple cues using fusion techniques compared to indi- vidual cues. Among the three fusion techniques analyzed in this Figure 8. Four lay er feed Forward neural network. Table 2. Accuracy of the voiced region by combining dif- ferent methods using various fusion techniques. FA1: False Alarm1 (voiced frames classified as nonvoiced frames) and FA2: False Alarm2 (nonvoiced frames classified as voiced frames). Fusion Technique % classification FA1 FA2 True classification LWS 4.67 5.06 95.33 MV 6.92 2.72 93.08 FFNN 2.23 3.06 97.77 study, the performance of the FFNN is observed to bet- ter. 4. A Computationally Efficient Method for Extracting the Instants of Significant Excitation By using the methods discussed in the previous section, the computation complexity can be reduced to a fraction equivalent to the fraction of voiced regions present in the speech utterance. In general it is observed that voiced regions contribute 50-60% of time in the speech utter- ance. Even though by limiting the group delay computa- tion to only voiced regions, real time prosody modifica- tion applications still need low response time. In this paper, a computationally efficient method for extracting the instants of significant excitation is proposed. Determining the instants of significant excitation using group-delay based method is computationally intensive process, since the group delay is computed for every sample shift. The computational complexity can be re-  Real Time Prosody Modification Copyright © 2010 SciRes. JSIP 58 duced by computing the group-delay only for few sam- ples around the instants of glottal closure. This is achiev- ed by first detecting the approximate locations of the glottal closure instants. The peaks in the Hilbert envelope of the linear prediction residual indicate the approximate locations of the glottal closure (GC) instants [17]. Even though the real and imaginary parts of an analyt- ic signal (related through the Hilbert transform) have positive and negative samples, the Hilbert envelope of the signal is a positive function, giving the envelope of the signal. Thus the properties of Hilbert envelope can be exploited to derive the impulse-like characteristics of the GC events. The Hilbert envelope he(n) of the LP residual e(n) is defined as follows [19]: 22 eh hne ne n where eh(n) is the Hilbert transform of e(n), and is given by eh(n)=IDFT [Eh(k)], where ,0,1,, 1 2 ,,1,,1 22 h N jE kk Ek NN jE kkN Here IDFT denotes the Inverse Discrete Fourier Transform, and E(k) is the discrete Fourier transform of e(n). The major peaks in the Hilbert envelope indicate approximate locations of epochs. The evidence of glottal closure instants is obtained by convolving the Hilbert envelope with a Gabor filter (modulated Gaussian pulse) given by 2 2 2 2 1 2 N n j wn gn e where σ defines the spatial spread of the Gaussian, w is the frequency of modulating sinusoid, n is the time index varying from 1 to N , and N is the length of the filter [22]. The Hilbert envelope of the LP residual is convolved with the Gabor filter to obtain the plot of evidence shown in Figure 9, which is termed as GC Evidence Plot (Fig- ure 10(c)). In the GC evidence plot, the instants of posi- tive zero-crossings correspond to approximate locations of the instants of significant excitation. To determine the accurate locations of the glottal closure instants, the phase slope function is computed for the residual sam- ples around the approximate GC instant locations. The positive zero-crossings of the phase slope function cor- respond to accurate locations of the instants of significant excitation. Figure 9 shows a segment of voiced speech, the Hilbert envelope of the LP residual of a speech seg- ment, the GC instant evidence plot, approximate loca- tions of GC instants, phase slope function and the loca- tions of the instants of significant excitation. The computational efficiency of the proposed method depends on the number of approximate epoch locations derived from the Hilbert envelope of the LP residual and the number of samples considered around each GC in- stant. For evaluating the performance of the proposed method, 100 speech utterances, each of duration of 3 Figure 9. (a) A segment of voiced speech, (b) Hilbert envelope of the LP residual, (c) GC instant evidence plot, (d) approx- imate GC instant locations, (e) phase slope function, (f) accurate locations of the instants of significant excitation.  Real Time Prosody Modification Copyright © 2010 SciRes. JSIP 59 seconds are considered. Among the utterances, 50 are uttered by male speakers and 50 are uttered by female speakers. For each utterance the instants of significant excitation are computed by the proposed method using different window sizes (number of samples around the approximate instant location). The epochs determined by the standard group delay method are used as reference [17]. Table 3 shows the number of instant locations de- rived by the proposed method for different window sizes. The total number of instants derived from the utterances of male speakers and female speakers are 12385 and 20113, respectively, by using the group delay method. The total number of approximate instant locations from the utterances of male speakers and female speakers, using the Hilbert envelope of the LP residual is 12867 and 20926 respectively. The analysis shows that with a window size of 2 ms, about 97% of the glottal closure instants are detected accurately for male speakers, and for female speakers about 98% of the glottal closure in- stants are detected accurately (Table 3). For instance, time complexity analysis in the case of male speakers indicate that for a window size of 2 ms, the proposed method determines the instants of significant excitation approximately in one fourth of time compared to the group delay method (assuming that the average pitch period for male speakers as 8 ms). It is observed that when the size of the window is small, the computational efficiency is high but at the same time, some of the epochs will be missing. As the size of the window in- creases, the computational efficiency decreases, but the number of missing epochs also decreases. The deviation in the approximate epoch locations with respect to their reference locations are computed. The results of the analysis are given in Table 4. The entries in the Table 4 indicate the number of approximate instants and their deviation in terms of number of samples with respect to reference instants. On the whole the average deviation per instant is found to be 2.1 samples (0.26 ms) and 1.7 samples (0.21 ms) for male and female speakers utterances respectively. It is observed from Tables 3,4, that the proposed me- thod can be used to derive the ISE for carrying out the prosody modification in real time. 5. Analysis of Overall Time Complexity in Real Time Prosody Modification System The objective of the real time prosody modification sys- tem is to modify the prosody parameters at faster rate, so that the users do not feel any perceptual inconvenience. Prosody modification using ISE is known to be one of the best method in the current state of the art. In this me- thod, the ISE are determined using group delay function. This is computationally intensive and not suitable for real time prosody modification applications. In the existing method, most of the complexity lies in the computation of ISE using group delay method. In this section we will discuss the effect of the proposed methods on the com- putational time of the ISE as well as the overall response time of the system. Table 3. Number of instants derived using the proposed method for different window sizes. Window Size(ms) Male speakers Female speakers # instants % in- stants # instants % in- stants 0.5 7813 63.08 13510 67.17 1.0 11207 90.49 18792 93.43 1.5 11865 95.80 19644 97.67 2.0 12031 97.14 19775 98.32 2.5 12142 98.04 19883 98.86 3.0 12226 98.72 19940 99.14 3.5 12284 99.18 19974 99.31 4.0 12308 99.38 20020 99.54 Table 4. Number of approximate instants derived from Hilbert envelope for different deviations with respect to reference instant locations. Deviation # samples Male speakers Female speakers # instants % instants # instants % instants 0 2672 21.57 4575 22.74 1 3076 24.84 4745 23.59 2 2079 16.79 4198 20.87 3 2245 18.13 3260 16.21 4 1145 9.26 2037 10.13 5 537 4.34 526 2.62  Real Time Prosody Modification Copyright © 2010 SciRes. JSIP 60 Figure 10. Block diagram for Real time prosody modifica- tion. The block diagram for the real time prosody modifica- tion system is given in Figure 10.The sequence of opera- tions that need to be performed are as follows: 1) Cap- turing speech signal through microphone, 2) LP analysis to extract LPCs and LP residual signal, 3) Identifying the voiced regions using the methods discussed in Section 3, 4) Determining the ISE using computationally efficient methods proposed in Section 4, 5) Performing the pros- ody modification using ISE and 6) Synthesize the speech using modified LP residual and LPCs. The time com- plexity of the real time prosody modification system is analyzed by using 100 speech utterances. These utter- ances were chosen from Hindi broadcast news speech corpus. The durations of the speech utterances are vary- ing from 3-5 secs. Each utterance is given to the prosody modification system for the modification pitch period and duration by 1.5 times. For each utterance, the time taken by each module to carry out its function is deter- mined. Here four basic modules are considered for the analysis of computation time: 1) LP analysis, 2) Epoch Table 5. The average computation time for each module in the prosody modification system using different methods to determine the ISE. Method Computation time (sec) LP analysis Epoch extraction Prosody modification Synthesis Baseline 6.22 58.73 5.38 5.65 Method-16.22 34.97 5.38 5.65 Method-26.22 6.07 5.38 5.65 extraction, 3) Prosody modification and 4) Synthesis. Among these modules, the computation time in epoch extraction module will be varying based on the proposed methods to determine the ISE. The rows in the Table 5 indicate the average computation time for the modules in the prosody modification system using different ap- proaches to determine the ISE. The entries in the table represent the average computational time per utterance. In the table, first column indicates different methods used to determine the ISE. In the baseline method, ISE are determined using conventional group delay based method. In this method group delay is computed for every sample shift. Therefore this method consumes huge time for determining the ISE, and it can be ob- served in the 3rd column of the first row. Method-1 computes the ISE by exploiting the voiced regions. In this method, voiced regions are detected using neural network model, and the group delay analysis is confined to only voiced regions. Prosody modification is performed in the voiced region using epoch knowledge and in the nonvoiced regions it is performed using fixed size frames. In this method the computation time for de- tecting ISE depends on 1) Computation time for the de- tection of voiced region and 2) Computation time for performing the group delay analysis in the voiced regions. Since this method determines the ISE by applying the group delay analysis to only voiced regions, the compu- tation time for detecting ISE will be less compared to baseline method. From the numbers shown in the table, it is observed that the computation time for detecting ISE is reduced by 40% approximately. The overall complexity is reduced by 30% compared to baseline system. The reduction in time complexity using method-1 is not sufficient for real time applications, where the users expect very low response time. Therefore in method-2, the computation time for detecting ISE is still optimized. In this method group delay analysis is applied to small regions (approximately 1.5 ms) around the approximate epoch locations in the voiced regions. This provides a drastic reduction in the computation time for determining  Real Time Prosody Modification Copyright © 2010 SciRes. JSIP 61 the ISE. This can be observed from the analysis derived from the test data. From the table entries it is observed that the computation time for determining the ISE is re- duced to one tenth (0.1 times) of the time required for baseline method, and one sixth (0.17 times) of the time required for method-1. The overall time complexity of the prosody modification system is also highly affected by this method. The overall complexity using method-2 is reduced to one fourth of the baseline method, and one third of the method-1. 6. Summary and Conclusions In this paper, we proposed methods for implementing the real time prosody modification system. The baseline prosody modification system is not suitable for real time applications, where the user expects low response time. In the baseline system most of the complexity lies in de- termining the ISE. Therefore methods proposed in this paper mainly aim to reduce the computation complexity in determining the ISE. As the ISE are valid only in voiced regions, one of the proposed methods exploited this salient feature by confining the group delay compu- tation to only voiced regions for detecting the ISE. For detecting the voiced regions, multiple cues such as FE, ZCR, NAC and RSR were used in the proposed method. Three different fusion techniques were explored in this study for combining the multiple cues to improve the performance. Nonlinear fusion using FFNN model sh- own better performance compared to other fusion tech- niques. With this proposed method, it was observed that the computation time for determining the ISE is reduced by 45%and overall response time is reduced by 30%compared to baseline system. Real time applications demand further low response time compared to the method which derives the ISE by exploiting voiced regions. Another method was proposed to determine the ISE in a more efficient way. In this me- thod, the ISE are determined in the voiced region by ap- plying the group delay analysis to only a few samples around each of the approximate epoch locations. The approximate epoch locations were obtained from the HE of the LP residual. In this method the computation com- plexity is drastically reduced, because the group delay analysis is confined to few samples around each epoch. Whereas in the previous methods, group delay analysis is performed for every sample shift which, increases the computation complexity and leads to increase in overall response time. From the analysis, it was observed that this method can reduce the computation complexity for determining the ISE by 90%(i.e., one tenth of the time required for the baseline method) compared to baseline method. The overall response time is also reduced by 75% (i.e., one fourth of the time required for the baseline method) compared to baseline method. In this paper, the proposed methods mainly aimed to reduce the computation complexity in determining the ISE. The overall response time can be further minimized by optimizing the computation time in other modules. For certain applications, approximate epoch locations are sufficient to perform prosody modification. In these cas- es one should analyze the perceptual characteristics of the synthesized speech. REFERENCES [1] D. G. Childers, K. Wu, D. M. Hicks, and B. Yegnana- rayana,“Voice conversion,” Speech Communication, Vol. 8, pp. 147-158, June 1989. [2] E. Moulines and J. Laroche, “Non-parametric techniques for pitch-scale and time-scale modification of speech,” Speech Communication, Vol. 16, pp. 175-205, Feb. 1995. [3] B. Yegnanarayana, S. Rajendran, V. R. Ramachandran, and A. S.M. Kumar, “Significance of knowledge sources for TTS system for Indian languages,” SADHANA Academy Proc. In Engineering Sciences, Vol. 19, pp. 147-169, Feb. 1994. [4] M. R. Portnoff, “Time-scale modification of speech based on short-time Fourier analysis,” IEEE Trans. Acoustics, Speech, and Signal Processing, Vol. 29, pp. 374-390, June. 1981. [5] M. R. Schroeder, J. L. Flanagan, and E. A. Lundry, “Bandwidth compression of speech by analytic-signal rooting,” Proc. IEEE, Vol. 55, pp. 396-401, Mar. 1967. [6] M. Narendranadh, H. A. Murthy, S. Rajendran, and B. Yegnanarayana, “Transformation of formants for voice conversion using artificial neural networks,” Speech Communication, Vol. 16, pp. 206-216, Feb. 1995. [7] E. B. George andM. J. T. Smith, “Speech Analy- sis/Synthesis and modification using an Analysis-by- Synthesis/Overlap-Add Sinusoidal model,” IEEE Trans. Speech and Audio Processing, Vol. 5, pp. 389-406, Sept. 1997. [8] Y. Zhang and J. Tao, “Prosody modification on mixed- language speech synthesis,” in Proc. Int. Conf. Spoken Language Processing, (Brisbane, Australia), Sept. 2008. [9] S. R. M. Prasanna, D. Govind, K. S. Rao, and B. Yegna- narayana, “Fast prosody modification using instants of significant excitation,” in Speech Prosody 2010, (Chicago, USA), May 2010. [10] D. Govind and S. R. M. Prasanna, “Expressive speech synthesis using prosodic modification and dynamic time warping,” in NCC 2009, (Guwahati, India), January 2009. [11] Y. Stylianou, “Applying the harmonic plus noise model in concatenative speech synthesis,” IEEE Trans. Speech and Audio Processing, Vol. 9, pp. 21-29, Jan. 2001. [12] H. Kawahara, I. Masuda-Katsuse, and A. de Cheveigne, “Restructuring speech representations using a pitch- adaptive time-frequency smoothing and an instantane- ous-frequencybased F0 extraction: Possible role of a re-  Real Time Prosody Modification Copyright © 2010 SciRes. JSIP 62 petitive structure in sounds,” Speech Communication, Vol. 27, pp. 187-207, 1999. [13] R. MuraliSankar, A. G. Ramakrishnan, and P. Prathibha, “Modification of pitch using DCT in source domain,” Speech Communication, Vol. 42, pp. 143-154, Jan. 2004. [14] T. F. Quatieri and R. J.McAulay, “Shape invariant time-scale and pitch modification of speech,” IEEE Trans. Signal Processing, Vol. 40, pp. 497-510, Mar. 1992. [15] W. Verhelst, “Overlap-add methods for time-scaling of speech,” Speech Communication, Vol. 30, pp. 207-221, 2000. [16] D. O’Brien and A. Monaghan, Improvements in Speech Synthesis, ch. Shape invariant pitch and time-scale mod- ification of speech based on harmonic model. Chichester: John Wiley & Sons, 2001. [17] P. S. Murthy and B. Yegnanarayana, “Robustness of groupdelay-based method for extraction of significant ex- citation from speech signals,” IEEE Trans. Speech and Audio Processing, Vol. 7, pp. 609-619, Nov. 1999. [18] J. Makhoul, “Linear prediction: A tutorial review,” Proc. IEEE, Vol. 63, pp. 561-580, Apr. 1975. [19] A. V. Oppenheim, R. W. Schafer, and J. R. Buck, Dis- cretetime signal processing. Upper Saddle River, NJ.: Prentice-Hall, 1999. [20] K. S. Rao and B. Yegnanarayana, “Prosody modification using instants of significant excitation,” IEEE Trans. Speech and Audio Processing, Vol. 14, pp. 972-980, May 2006. [21] S. Haykin, Neural Networks: A Comprehensive Founda- tion. New Delhi, India: Pearson Education Aisa, Inc., 1999. [22] D. Gabor, “Theory of communication,” J. IEE, Vol. 93, No. 2, pp. 429-457, 1946. |