Paper Menu >>
Journal Menu >>
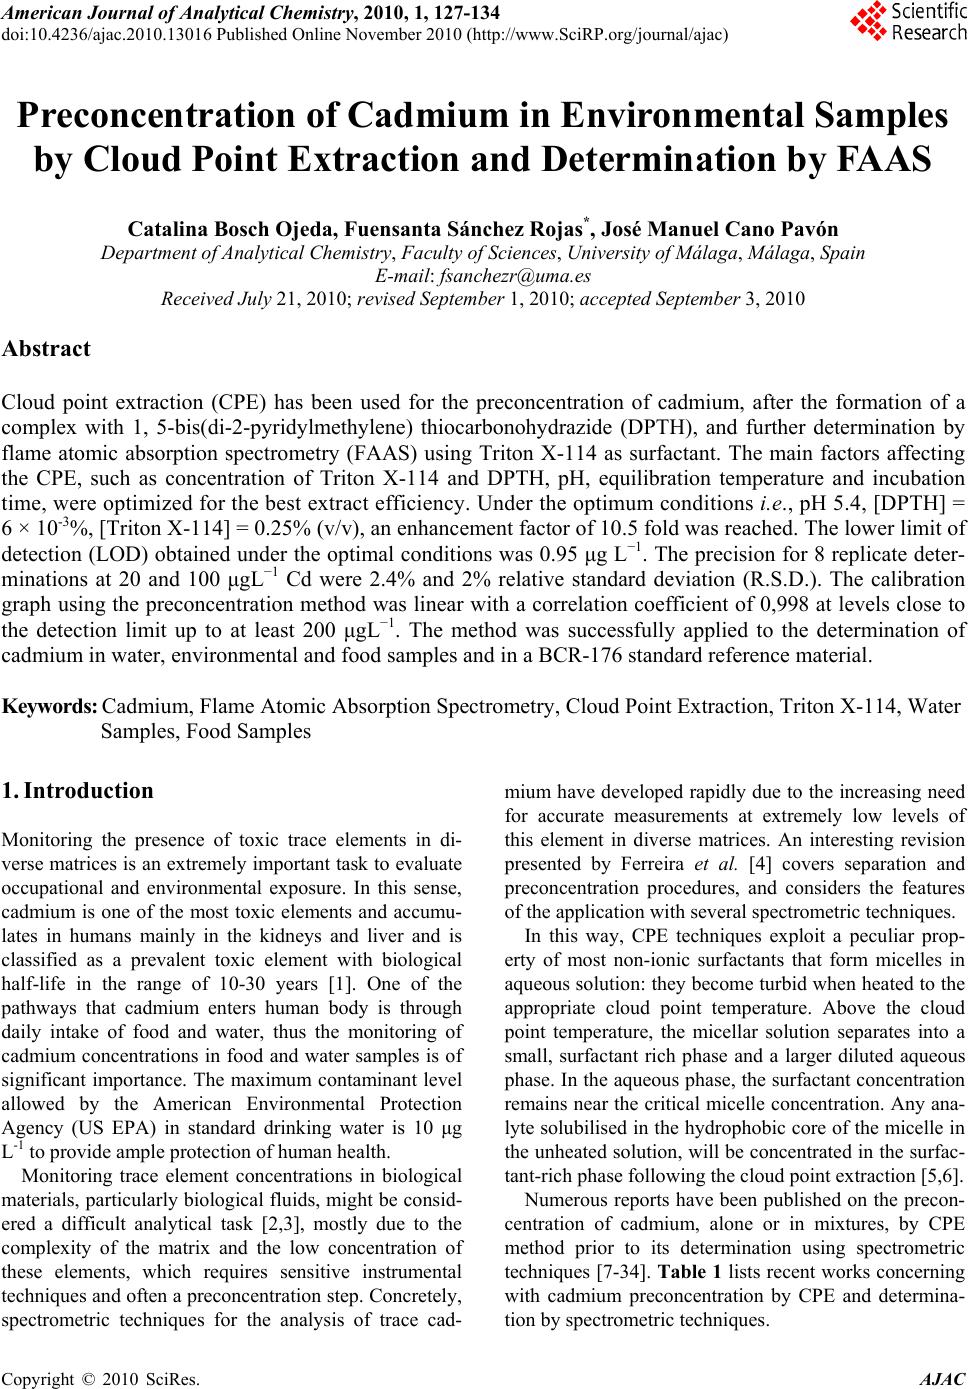 American Journal of Anal yt ical Chemistry, 2010, 1, 127-134 doi:10.4236/ajac.2010.13016 Published Online November 2010 (http://www.SciRP.org/journal/ajac) Copyright © 2010 SciRes. AJAC Preconcentration of Cadmium in Environmental Samples by Cloud Point Extraction and Determination by FAAS Catalina Bosch Ojeda, Fuensanta Sánchez Rojas*, José Manuel Cano Pavón Department of An al yt i cal Che mi st r y , Faculty of Sciences, University of Málaga, Málaga, Spain E-mail: fsanchezr@uma.es Received July 21, 2010; revised September 1, 2010; accepted September 3, 2010 Abstract Cloud point extraction (CPE) has been used for the preconcentration of cadmium, after the formation of a complex with 1, 5-bis(di-2-pyridylmethylene) thiocarbonohydrazide (DPTH), and further determination by flame atomic absorption spectrometry (FAAS) using Triton X-114 as surfactant. The main factors affecting the CPE, such as concentration of Triton X-114 and DPTH, pH, equilibration temperature and incubation time, were optimized for the best extract efficiency. Under the optimum conditions i.e., pH 5.4, [DPTH] = 6 × 10⁻³%, [Triton X-114] = 0.25% (v/v), an enhancement factor of 10.5 fold was reached. The lower limit of detection (LOD) obtained under the optimal conditions was 0.95 μg L−1. The precision for 8 replicate deter- minations at 20 and 100 μgL−1 Cd were 2.4% and 2% relative standard deviation (R.S.D.). The calibration graph using the preconcentration method was linear with a correlation coefficient of 0,998 at levels close to the detection limit up to at least 200 μgL−1. The method was successfully applied to the determination of cadmium in water, environmental and food samples and in a BCR-176 standard reference material. Keywords: Cadmium, Flame Atomic Absorption Spectrometry, Cloud Point Extraction, Triton X-114, Water Samples, Food Samples 1. Introduction Monitoring the presence of toxic trace elements in di- verse matrices is an extremely important task to evaluate occupational and environmental exposure. In this sense, cadmium is one of the most toxic elements and accumu- lates in humans mainly in the kidneys and liver and is classified as a prevalent toxic element with biological half-life in the range of 10-30 years [1]. One of the pathways that cadmium enters human body is through daily intake of food and water, thus the monitoring of cadmium concentrations in food and water samples is of significant importance. The maximum contaminant level allowed by the American Environmental Protection Agency (US EPA) in standard drinking water is 10 μg L-1 to provide ample protection of human health. Monitoring trace element concentrations in biological materials, particularly biological fluids, might be consid- ered a difficult analytical task [2,3], mostly due to the complexity of the matrix and the low concentration of these elements, which requires sensitive instrumental techniques and often a preconcentration step. Concretely, spectrometric techniques for the analysis of trace cad- mium have developed rapidly due to the increasing need for accurate measurements at extremely low levels of this element in diverse matrices. An interesting revision presented by Ferreira et al. [4] covers separation and preconcentration procedures, and considers the features of the application with several spectrometric techniques. In this way, CPE techniques exploit a peculiar prop- erty of most non-ionic surfactants that form micelles in aqueous solution: they become turbid when heated to the appropriate cloud point temperature. Above the cloud point temperature, the micellar solution separates into a small, surfactant rich phase and a larger diluted aqueous phase. In the aqueous phase, the surfactant concentration remains near the critical micelle concentration. Any ana- lyte solubilised in the hydrophobic core of the micelle in the unheated solution, will be concentrated in the surfac- tant-rich phase following the cloud point extraction [5,6]. Numerous reports have been published on the precon- centration of cadmium, alone or in mixtures, by CPE method prior to its determination using spectrometric techniques [7-34]. Table 1 lists recent works concerning with cadmium preconcentration by CPE and determina- tion by spectrometric techniques.  128 C. B. OJEDA ET AL. Table 1. Cadmium preconcentration by CPE. Matrix Reagent/surfactant Pre-concentration factorTechnique Ref. Seawater PAN 120 FAAS 7 Waters DDTP/Triton X-114 29 ICP-MS 8 Waters TAN/Triton X-114 58 FAAS 9 Human hair DDTP/Triton X-114 22 FAAS 10 Waste and waters Dithizone/Triton X-114 52 FAAS 11 Seawater DDTC/Triton X-114 52 GFAAS 12 Physiological solution, mineral and lake waters and tobacco DDTP/Triton X-114 - FAAS 13 Biological materials DDTP/Triton X-114 129 GFAAS 14 Waters PMBP/Triton X-100 23 FAAS 15 Waters Iodide/Triton X-114 55.6 FAAS 16 Water and urine APDC/Triton X-114 13 TS-FF-AAS 17 Waters PONPE 7.5 62 CV-AAS 18 Waters PAN/Triton X-100 50 GFAAS 19 Waters 5-Br-PADAP/Triton X-114 21 GFAAS 20 Water standard reference material and urine 5-Br-PADAP/PONPE 7.5 22 GFAAS 21 Urine APDC/Triton X-114 15 WCAAS 22 Water and tobacco GBHA/Triton X-114/SDS/NaCl 22 GFAAS 23 Waters Carboxylic acids/OP-10 - FAAS 24 Urine DDTP/Triton X-114 16 GFAAS 25 Drinking waters TAC/Triton X-114 22 FS-FAAS 26 Natural waters DDTP/Triton X-114 - FAAS 27 Waters TAN/Triton X-114 20.3 FAAS 28 Natural waters Schiff base benzylbis thiosemicarbazone/ Triton X-114 140 FAAS 29 Mineral drinking water, river water and seawater NDDBH/Triton X-114 157 FAAS 30 Waters PAR/Triton X-114 9.4 ICP-OES 31 Environmental samples BIES/Triton X-114 48 FAAS 32 Waters o-phen and eosin/PONPE 7.5 - Molecular fluorescence33 Rice and water Dithizone/Triton X-114 152 93 W-coil ETV-AFS W-coil GFAAS 34 Copyright © 2010 SciRes. AJAC  C. B. OJEDA ET AL. Copyright © 2010 SciRes. AJAC 129 In this work, we report on the results obtained in a study of the CPE of Cd2+, after the formation of a com- plex with DPTH using Triton X-114 as surfactant fol- lowed by analysis by FAAS. 2. Experimental 2.1. Instrumentation A thermostated bath Model Selecta Precisterm, main- tained at the desired temperature, was used for the CPE experiments. Phase separation was achieved with a cen- trifuge Selecta Centromix in 10mL calibrated conical tubes. A Varian Model SpectrAA 50 (Mulgrave, Victoria, Australia) flame atomic absorption spectrometer was used for the analysis with the appropriate cadmium hol- low cathode lamp. The operating parameters were set as recommended by the manufacturer. Atomic absorption measurements were carried out in an air-acetylene flame. The following conditions were used: absorption line Cd: 228.8 nm; slit widths: 0.5 nm; and lamp currents: 4 mA. 2.2. Reagents and Samples High purity water (resistivity 18 MΩ cm-1) obtained by a Milli-Q® water purification system (Millipore, Bedford, MA, USA) was used throughout this work. 1000 mg L-1 stock solutions of cadmium (E. Merck, Darmstadt, Ger- many). Working standard solution was obtained daily by stepwise dilution of the standard stock solution. DPTH solution in DMF was prepared by dissolving solid re- agent samples prepared and purified by the authors. Non-ionic surfactant, Triton X-114 stock solution (2%, v/v) was prepared by dissolving 2 mL of concentrated solution (Merck, Darmstadt, Germany) in 100 mL hot deionised water. These reagents were all of analytical grade or better. The accuracy of the method for determination of cad- mium content was checked by analyzing the reference standard material BCR 176 ‘‘City waste incineration ash’’; for this the certified cadmium content was 470 ± 9 mg kg-1. The sample was first prepared in accordance with the instructions on the analysis certificate, after which an accurately weighed amount (50 mg) was sub- jected to microwave digestion. The solution obtained was then adjusted to the optimum pH and, finally, the sample was diluted to 25 mL with de-ionized water in a calibrated flask. The proposed method was also evaluated by analysis of cadmium in several spiked food samples. The Cd concentrations in all the original samples were below the detection limit. For this purpose, standard solutions con- taining cadmium were added to 0.2–0.5 g of diverse food and the resulting materials were mineralized by micro- wave digestion, adjusted pH and diluted at convenient volume. Natural waters were collected in polypropylene bottles previously cleaned by soaking for 24 h in 10% (v/v) ni- tric acid and finally rinsed thoroughly with ultrapure water before use. 2.3. Procedure 10 mL analyte solution containing cadmium, 1mL buffer solution pH 5.4, DPTH 6 × 10⁻³ % and 0.25% (v/v) Tri- ton X-114 was kept in a thermostated bath at 50ºC for 30 min. Phase separation was accelerated by centrifuging the resultant solution at 3800 rpm for 5 min. The conical tubes were then immersed in an ice-water mixture for 20 min, allowing ease of removing the supernatant bulk aqueous phase. A small volume of surfactant rich phase remained at the bottom of the tube. To decrease the vis- cosity of the extract and to facilitate sampling, 0.4 mL of HNO3 0.1M/MeOH was added to surfactant-rich phase. The cadmium content was determined by flame atomic absorption at 228.8 nm against a blank solution. Calibra- tion was carried using different standard solutions of cadmium submitted to the same preconcentration and determination procedures. Blank solution was submitted to the same procedure and measured in parallel to the samples. 3. Results and Discussion 3.1. Study of the CPE System Variables In the so-called cloud point extraction, several parame- ters play a substantial role in the performance and ag- gregation of the surfactant system, thus entrapping the analyte species. CPE of metal ions is known to depend on several factors such as type and amount of reagent and surfactant, pH of solution, ionic strength, equilibra- tion temperature and time, etc. We have investigated the CPE process in order to obtain optimum conditions. 3.1.1. Effec t of pH and Triton X-114 Concentrati o n The formation of metal complexes and its chemical sta- bility are the two important influence factors for the CPE, and the pH plays a unique role on metal chelate forma- tion and subsequent extraction; in this sense, cadmium(II) react with DPTH to form intensely coloured complex and in a previous study, the characteristics of this chelate were described so cadmium(II) forms a complex with DPTH in a wide range of pH. CPE of cadmium was performed in solutions of pH  130 C. B. OJEDA ET AL. ranging from 3.6 to 5.6. Separation of metal ions by cloud point method involves the prior formation of a complex with sufficient hydrophobicity to be extracted in to the small volume of surfactant-rich phase. Extraction recovery depends on the pH at which complex formation occurs. On the other hand, in CPE, since the temperature cor- responding to cloud point is correlated with the hydro- philic property of surfactants, an appropriate surfactant is important. The surfactants, which have too high or too low cloud point, are not suitable for the CPE separation/ preconcentration of trace elements. A successful cloud point extraction should maximize the extraction effi- ciency by minimizing the phase volume ratio (Vorg/Va- queous), thus improving its concentration factor. Triton X-114 was chosen for the formation of surfactant rich phase due to its recognized physicochemical characteris- tics: low cloud point temperature, high density of the surfactant rich phase; which facilitates phase separation by centrifugation, commercial availability, relatively low price and low toxicity. These variables of interest in the CPE process were optimized with the aid of experimental design. The sig- nificant factors were optimized by using a factorial de- sign 32. The pH varied between 3.6 and 5.6, and the Tri- ton X-114 concentration ranged from 0.1 to 0.4 %. The experimental results as absorbance are described in Ta- ble 2. The significance of the effects was checked by analysis of the variance (ANOVA) and using P-value significance levels. Also, the ANOVA results produced the graphs showing the influence of main effects repre- sented in Figure 2, interaction plot in Figure 3 and standardized Pareto chart in Figure 4. These data were fitted into the following function: Table 2. Factorial design for optimization of the experi- mental conditions. Experiment Triton (%) pH Absorbance 1 0.4 3.6 0.349 2 0.1 5.6 0.517 3 0.1 4.8 0.53 4 0.4 4.8 0.471 5 0.4 5.6 0.546 6 0.2 5.6 0.485 7 0.1 3.6 0.182 8 0.2 3.6 0.325 9 0.2 4.8 0.477 Figure 1. Scheme of the CPE procedure. Copyright © 2010 SciRes. AJAC  C. B. OJEDA ET AL. Copyright © 2010 SciRes. AJAC 131 Figure 2. Influence of main effects on the absorbance. Figure 3. Interaction plots. Figure 4. Pareto’s chart. Absorbance = –1,85484 + 1,25039(Triton) + 0,825714 (pH) – 0,205556(Triton)2 – 0,213299(Triton) (pH) – 0,0718056 (pH)2 This equation shows a maximum condition of absorb- ance for a Triton X-114 concentration of 0.25 % and pH 5.4. 3.1.2. Effect of DPTH Concentration The variation of the analytical signal as a function of the concentration of DPTH in the range of 5 × 10⁻³ – 2 × 10⁻²% (w/v) was studied, and the experimental results in Figure 5 demonstrated that the signal intensity of the analyte was accentuated by DPTH at concentrations up to about 6 × 10⁻³% (w/v). The maximum signal intensity achieved with this concentration remained practically constant up to the highest amount studied. A 6 × 10⁻³% (w/v) DPTH was selected for further research. 3.1.3. Effect of Ionic Strength The influence of ionic strength was examined by study- Figure 5. Influence of DPTH concentration. ing the extraction efficiency for NaCl concentration in the range 0.5-3%. Ionic strength had no significant effect upon percent recovery and sensitivity. 3.1.4. Effects of the Equilibration Temperature and Time It is desirable to employ the shortest incubation time and the lowest possible equilibrium temperature, which comprise completion of the reaction and efficient separa- tion of the phases. As mentioned above, after evaluating the incubation time in the range 10-40 min, it was kept for 30 min, which is sufficient for the completion of the complex reaction and also for the clouding process. It was also observed that a temperature of 50ºC is sufficient for maximum recovery of the cadmium. In general, centrifugation time hardly ever affects mi- celle formation but accelerates phase separation in the same sense as in conventional separations of a precipitate from its original aqueous environment. Therefore, a cen- trifugation time of 5 min at 3800 rpm was selected as optimum, since complete separation occurred for this time and no appreciable improvements were observed for long time. In the phase separation step, the surfactant-rich phase with high viscosity was settled. The addition of a diluent, such as 0.4 mL of HNO3 0.1 M/methanol mixture re- duces the surfactant phase viscosity and facilitates its transfer into the flame. The optimized conditions of CPE are summarized in Table 3. 3.2. Analytical Characteristics Table 4 summarizes the analytical characteristics of the optimized method, including regression equation deter- mining before and after cloud point extraction method, linear range, limit of detection and reproducibility of Cd after CPE. The limit of detection, defined as CL = 3SB/m 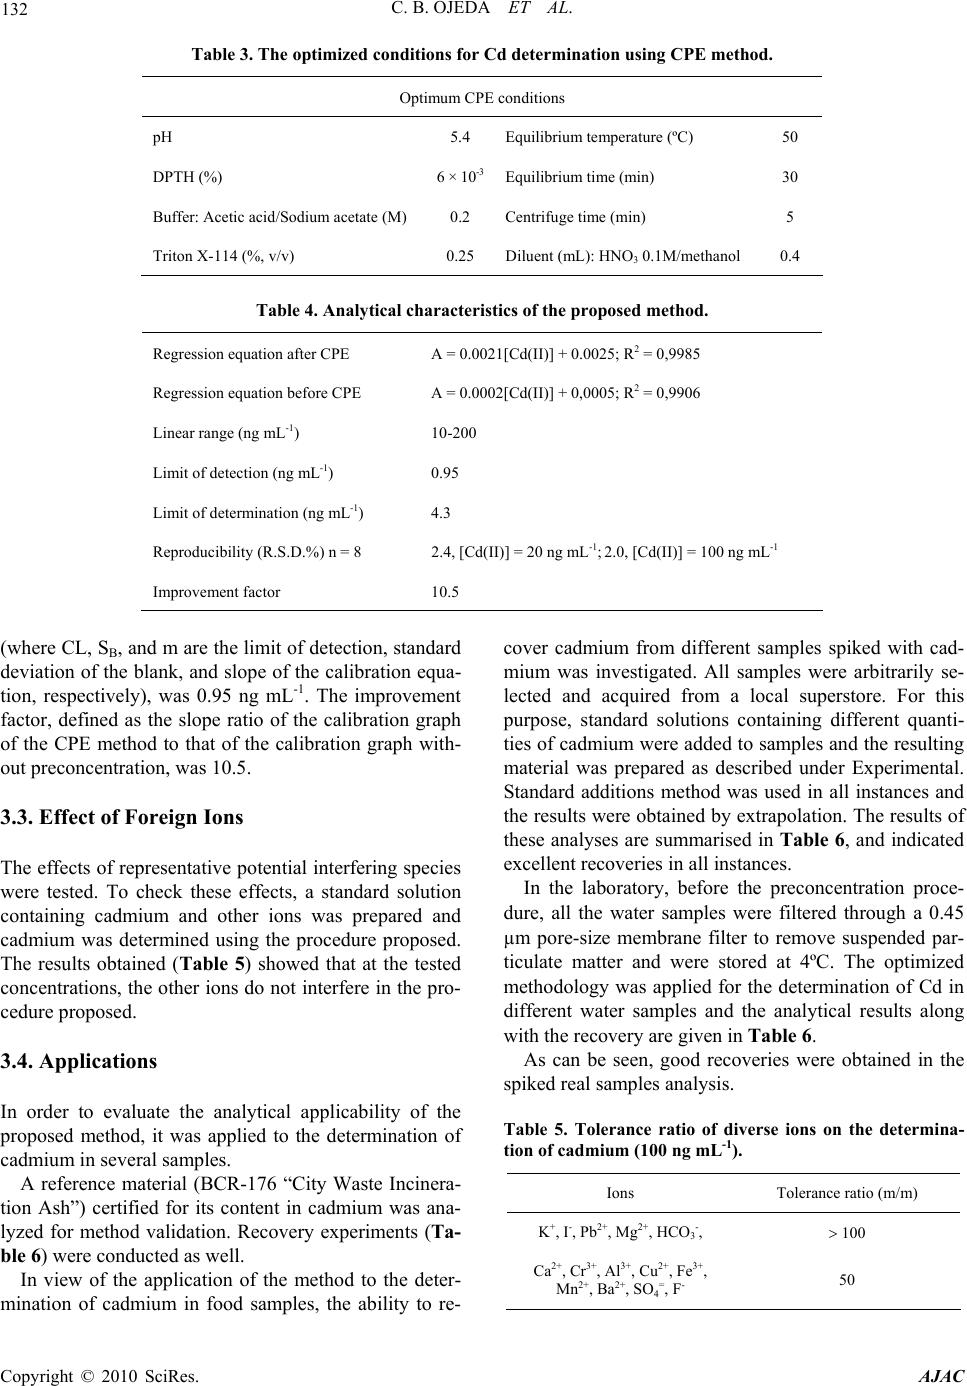 132 C. B. OJEDA ET AL. Table 3. The optimized conditions for Cd determination using CPE method. Optimum CPE conditions pH 5.4 Equilibrium temperature (ºC) 50 DPTH (%) 6 × 10⁻³ Equilibrium time (min) 30 Buffer: Acetic acid/Sodium acetate (M) 0.2 Centrifuge time (min) 5 Triton X-114 (%, v/v) 0.25 Diluent (mL): HNO3 0.1M/methanol 0.4 Table 4. Analytical characteristics of the proposed method. Regression equation after CPE A = 0.0021[Cd(II)] + 0.0025; R2 = 0,9985 Regression equation before CPE A = 0.0002[Cd(II)] + 0,0005; R2 = 0,9906 Linear range (ng mL-1) 10-200 Limit of detection (ng mL-1) 0.95 Limit of determination (ng mL-1) 4.3 Reproducibility (R.S.D.%) n = 8 2.4, [Cd(II)] = 20 ng mL-1; 2.0, [Cd(II)] = 100 ng mL-1 Improvement factor 10.5 (where CL, SB, and m are the limit of detection, standard deviation of the blank, and slope of the calibration equa- tion, respectively), was 0.95 ng mL-1. The improvement factor, defined as the slope ratio of the calibration graph of the CPE method to that of the calibration graph with- out preconcentration, was 10.5. 3.3. Effect of Foreign Ions The effects of representative potential interfering species were tested. To check these effects, a standard solution containing cadmium and other ions was prepared and cadmium was determined using the procedure proposed. The results obtained (Table 5) showed that at the tested concentrations, the other ions do not interfere in the pro- cedure proposed. 3.4. Applications In order to evaluate the analytical applicability of the proposed method, it was applied to the determination of cadmium in several samples. A reference material (BCR-176 “City Waste Incinera- tion Ash”) certified for its content in cadmium was ana- lyzed for method validation. Recovery experiments (Ta- ble 6) were conducted as well. In view of the application of the method to the deter- mination of cadmium in food samples, the ability to re- cover cadmium from different samples spiked with cad- mium was investigated. All samples were arbitrarily se- lected and acquired from a local superstore. For this purpose, standard solutions containing different quanti- ties of cadmium were added to samples and the resulting material was prepared as described under Experimental. Standard additions method was used in all instances and the results were obtained by extrapolation. The results of these analyses are summarised in Table 6, and indicated excellent recoveries in all instances. In the laboratory, before the preconcentration proce- dure, all the water samples were filtered through a 0.45 µm pore-size membrane filter to remove suspended par- ticulate matter and were stored at 4ºC. The optimized methodology was applied for the determination of Cd in different water samples and the analytical results along with the recovery are given in Table 6. As can be seen, good recoveries were obtained in the spiked real samples analysis. Table 5. Tolerance ratio of diverse ions on the determina- tion of cadmium (100 ng mL-1). Ions Tolerance ratio (m/m) K+, I-, Pb2+, Mg2+, HCO3-, 100 Ca2+, Cr3+, Al3+, Cu2+, Fe3+, Mn2+, Ba2+, SO4=, F- 50 Copyright © 2010 SciRes. AJAC 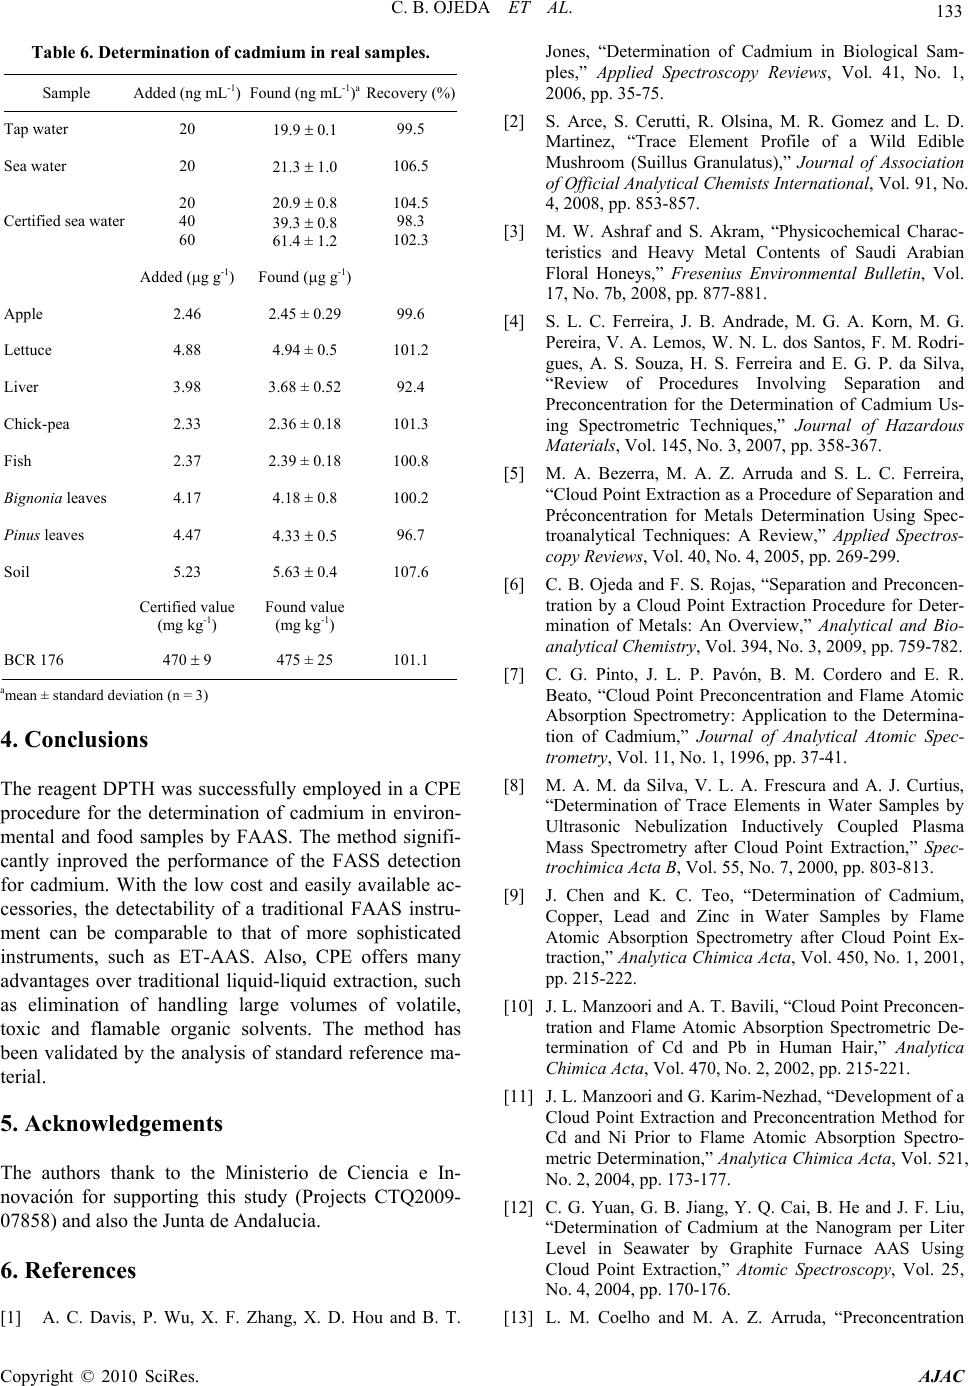 C. B. OJEDA ET AL. 133 Table 6. Determination of cadmium in real samples. Sample Added (ng mL-1)Found (ng mL-1)a Recovery (%) Tap water 20 19.9 0.1 99.5 Sea water 20 21.3 1.0 106.5 Certified sea water 20 40 60 20.9 0.8 39.3 0.8 61.4 ± 1.2 104.5 98.3 102.3 Added (g g-1) Found (g g-1) Apple 2.46 2.45 ± 0.29 99.6 Lettuce 4.88 4.94 ± 0.5 101.2 Liver 3.98 3.68 ± 0.52 92.4 Chick-pea 2.33 2.36 ± 0.18 101.3 Fish 2.37 2.39 ± 0.18 100.8 Bignonia leaves 4.17 4.18 ± 0.8 100.2 Pinus leaves 4.47 4.33 0.5 96.7 Soil 5.23 5.63 0.4 107.6 Certified value (mg kg-1) Found value (mg kg-1) BCR 176 470 9 475 ± 25 101.1 amean ± standard deviation (n = 3) 4. Conclusions The reagent DPTH was successfully employed in a CPE procedure for the determination of cadmium in environ- mental and food samples by FAAS. The method signifi- cantly inproved the performance of the FASS detection for cadmium. With the low cost and easily available ac- cessories, the detectability of a traditional FAAS instru- ment can be comparable to that of more sophisticated instruments, such as ET-AAS. Also, CPE offers many advantages over traditional liquid-liquid extraction, such as elimination of handling large volumes of volatile, toxic and flamable organic solvents. The method has been validated by the analysis of standard reference ma- terial. 5. Acknowledgements The authors thank to the Ministerio de Ciencia e In- novación for supporting this study (Projects CTQ2009- 07858) and also the Junta de Andalucia. 6. References [1] A. C. Davis, P. Wu, X. F. Zhang, X. D. Hou and B. T. Jones, “Determination of Cadmium in Biological Sam- ples,” Applied Spectroscopy Reviews, Vol. 41, No. 1, 2006, pp. 35-75. [2] S. Arce, S. Cerutti, R. Olsina, M. R. Gomez and L. D. Martinez, “Trace Element Profile of a Wild Edible Mushroom (Suillus Granulatus),” Journal of Association of Official Analytical Chemists International, Vol. 91, No. 4, 2008, pp. 853-857. [3] M. W. Ashraf and S. Akram, “Physicochemical Charac- teristics and Heavy Metal Contents of Saudi Arabian Floral Honeys,” Fresenius Environmental Bulletin, Vol. 17, No. 7b, 2008, pp. 877-881. [4] S. L. C. Ferreira, J. B. Andrade, M. G. A. Korn, M. G. Pereira, V. A. Lemos, W. N. L. dos Santos, F. M. Rodri- gues, A. S. Souza, H. S. Ferreira and E. G. P. da Silva, “Review of Procedures Involving Separation and Preconcentration for the Determination of Cadmium Us- ing Spectrometric Techniques,” Journal of Hazardous Materials, Vol. 145, No. 3, 2007, pp. 358-367. [5] M. A. Bezerra, M. A. Z. Arruda and S. L. C. Ferreira, “Cloud Point Extraction as a Procedure of Separation and Préconcentration for Metals Determination Using Spec- troanalytical Techniques: A Review,” Applied Spectros- copy Reviews, Vol. 40, No. 4, 2005, pp. 269-299. [6] C. B. Ojeda and F. S. Rojas, “Separation and Preconcen- tration by a Cloud Point Extraction Procedure for Deter- mination of Metals: An Overview,” Analytical and Bio- analytical Chemistry, Vol. 394, No. 3, 2009, pp. 759-782. [7] C. G. Pinto, J. L. P. Pavón, B. M. Cordero and E. R. Beato, “Cloud Point Preconcentration and Flame Atomic Absorption Spectrometry: Application to the Determina- tion of Cadmium,” Journal of Analytical Atomic Spec- trometry, Vol. 11, No. 1, 1996, pp. 37-41. [8] M. A. M. da Silva, V. L. A. Frescura and A. J. Curtius, “Determination of Trace Elements in Water Samples by Ultrasonic Nebulization Inductively Coupled Plasma Mass Spectrometry after Cloud Point Extraction,” Spec- trochimica Acta B, Vol. 55, No. 7, 2000, pp. 803-813. [9] J. Chen and K. C. Teo, “Determination of Cadmium, Copper, Lead and Zinc in Water Samples by Flame Atomic Absorption Spectrometry after Cloud Point Ex- traction,” Analytica Chimica Acta, Vol. 450, No. 1, 2001, pp. 215-222. [10] J. L. Manzoori and A. T. Bavili, “Cloud Point Preconcen- tration and Flame Atomic Absorption Spectrometric De- termination of Cd and Pb in Human Hair,” Analytica Chimica Acta, Vol. 470, No. 2, 2002, pp. 215-221. [11] J. L. Manzoori and G. Karim-Nezhad, “Development of a Cloud Point Extraction and Preconcentration Method for Cd and Ni Prior to Flame Atomic Absorption Spectro- metric Determination,” Analytic a Chimica A cta, Vol. 521, No. 2, 2004, pp. 173-177. [12] C. G. Yuan, G. B. Jiang, Y. Q. Cai, B. He and J. F. Liu, “Determination of Cadmium at the Nanogram per Liter Level in Seawater by Graphite Furnace AAS Using Cloud Point Extraction,” Atomic Spectroscopy, Vol. 25, No. 4, 2004, pp. 170-176. [13] L. M. Coelho and M. A. Z. Arruda, “Preconcentration Copyright © 2010 SciRes. AJAC  C. B. OJEDA ET AL. Copyright © 2010 SciRes. AJAC 134 Procedure Using Cloud Point Extraction in the Presence of Electrolyte for Cadmium Determination by Flame Atomic Absorption Spectrometry,” Spectrochimica Acta B, Vol. 60, No. 5, 2005, pp. 743-748. [14] T. A. Maranhão, D. L. G. Borges, M. A. S. da Veiga and A. J. Curtius, “Cloud Point Extraction for the Determination of Cadmium and Lead in Biological Samples by Graphite Furnace Atomic Absorption Spectrometry,” Spectro- chimica Acta B, Vol. 60, No. 5, 2005, pp. 667-672. [15] P. Liang, J. Li and X. Yang, “Cloud Point Extraction Preconcentration of Trace Cadmium as 1-Phenyl-3- methyl-4-benzoyl-5-pyrazolone Complex and Determi- nation by Flame Atomic Absorption Spectrometry,” Mi- crochimica Acta, Vol. 152, No. 1-2, 2005, pp. 47-51. [16] A. Afkhami, T. Madrakian and H. Siampour, “Flame Atomic Absorption Spectrometric Determination of Trace Quantities of Cadmium in Water Simples after Cloud Point Extraction in Triton X-114 without Added Chelat- ing Agents,” Journal of Hazardous Materials, Vol. 138, 2006, pp. 269-272. [17] P. Wu, Y. Zhang, Y. Lv and X. Hou, “Cloud Point Extraction—Thermospray Flame Quartz Furnace Atomic Absorption Spectrometry for Determination of Ultratrace Cadmium in Water and Urine,” Spectrochimica Acta B, Vol. 61, No. 12, 2006, pp. 1310-1314. [18] J. L. Manzoori, H. Abdolmohammad-Zadeh and M. Am- jadi, “Ultratrace Determination of Cadmium by Cold Vapor Atomic Absorption Spectrometry after Preconcentration with a Simplified Cloud Point Extraction Methodology,” Talanta, Vol. 71, No. 2, 2007, pp. 582-587. [19] X. S. Zhu, X. H. Zhu and B. S. Wang, “Determination of Trace Cadmium in Water Samples by Graphite Furnace Atomic Absorption Spectrometry after Cloud Point Ex- traction,” Microchimica Acta, Vol. 154, No. 1-2, 2006, pp. 95-100. [20] S. Xiao, J. Chen, X. Wu and Y. Miao, “Determination of Cadmium in Water Samples by Graphite Furnace Atomic Absorption Spectrometry after Cloud Point Extraction,” Journal of Analytical Chemistry, Vol. 62, No. 1, 2007, pp. 42-45. [21] P. R. Aranda, R. A. Gil, S. Moyano, I. De Vito and L. D. Martinez, “Cloud Point Extraction for Ultra-Trace Cd Determination in Microwave-Digested Biological Samples by ETAAS,” Talanta, Vol. 77, No. 2, 2008, pp. 663-666. [22] G. L. Donati, K. E. Pharr, C. P. Calloway Jr., J. A. Nóbrega and B. T. Jones, “Determination of Cd in Urine by Cloud Point Extraction—Tungsten Coil Atomic Absorption Spec- trometry,” Talanta, Vol. 76, No. 5, 2008, pp. 1252-1255. [23] H. Filik, F. Dondurmacioglu and R. Apak, “Micelle Me- diated Extraction of Cadmium from Water and Tobacco Samples with Glyoxal-bis(2-hydroxyanil) and Determi- nation by Electrothermal Atomic Absorption Spectrome- try,” International Journal of Environmental Analytical Chemistry, Vol. 88, No. 9, 2008, pp. 637-648. [24] V. A. Doroshchuk and S. A. Kulichenko, “Preconcentra- tion of Cadmium with OP-10 Nonionic Surfactant Phases at the Cloud Point,” Journal of Analytical Chemistry, Vol. 60, No. 5, 2005, pp. 400-403. [25] T. D. A. Maranhão, E. Martendal, D. L. G. Borges, E. Carasek, B. Welz and A. J. Curtius, “Cloud Point Extraction for the Determination of Lead and Cadmium in Urine by Graphite Furnace Atomic Absorption Spectrometry with Multivariate Optimization Using Box—Behnken Design,” Spectrochimica Acta B, Vol. 62, No. 9, 2007, pp. 1019-1027. [26] L. A. Portugal, H. S. Ferreira, W. N. L. Santos and S. L. C. Ferreira, “Simultaneous Pre-Concentration Procedure for the Determination of Cadmium and Lead in Drinking Water Employing Sequential Multi-Element Flame Atomic Absorption Spectrometry,” Microchemical Jour- nal, Vol. 87, No. 1, 2007, pp. 77-80. [27] S. M. Talebi, S. Habib-Ollahi and A. Semnani, “Cloud Point Extraction and Flame Atomic Absorption Spec- trometric Determination of Lead and Cadmium in Natural Waters,” Asian Journal of Chemistry, Vol. 19, 2007, pp. 2445-2451. [28] E. L. Silva and P. dos S. Roldán, “Simultaneous Flow Injection Preconcentration of Lead and Cadmium Using Cloud Point Extraction and Determination by Atomic Absorption Spectrometry,” Journal of Hazardous Mate- rials, Vol. 161, No. 1, 2009, pp. 142-147. [29] S. D. Abkenar, M. Hosseini and M. Salavati-Niasari, “Cloud Point Extraction and Preconcentration of Silver and Cadmium Using Schiff Base Prior to Flame Atomic Absorption Spectrometric Determination,” Asian Journal of Chemistry, Vol. 20, No. 6, 2008, pp. 4291-4300. [30] M. Arvand, A. Pourhabib, A. Afshari, M. Bagherinia, N. Ghodsi and R. J. Shemshadi, “Determination of Cad- mium and Zinc in Water Samples by Flame Atomic Ab- sorption Spectrometry after Cloud-Point Extraction,” Jour- nal of Analytical Chemistry, Vol. 63, No. 10, 2008, pp. 954-959. [31] E. L. Silva, P. S. Roldan and M. F. Giné, “Simultaneous Preconcentration of Copper, Zinc, Cadmium, and Nickel in Water Samples by Cloud Point Extraction Using 4-(2- Pyridylazo)-Resorcinol and Their Determination by In- ductively Coupled Plasma Optic Emission Spectrome- try,” Journal of Hazardous Materials, Vol. 171, No. 1-3, 2009, pp. 1133-1138. [32] M. Ghaedi, A. Shokrollahi, K. Niknam, E. Niknam, A. Najibi and M. Soylak, “Cloud Point Extraction and Flame Atomic Absorption Spectrometric Determination of Cadmium(II), Lead(II), Palladium(II) and Silver(I) in En- vironmental Samples,” Journal of Hazardous Materials, Vol. 168, No. 2-3, 2009, pp. 1022-1027. [33] M. C. Talio, M. O. Luconi, A. N. Masi and L. P. Fernández, “Determination of Cadmium at Ultra-Trace Level by CPE-Molecular Fluorescence Combined Methodology,” Journal of Hazardous Materials, Vol. 170, No. 1, 2009, pp. 272-277. [34] X. Wen, P. Wu, L. Chen and X. Hou, “Determination of Cadmium in Rice and Water by Tungsten Coil Electro- thermal Vaporization-Atomic Fluorescence Spectrometry and Tungsten Coil Electrothermal Atomic Absorption Spectrometry after Cloud Point Extraction,” Analytica Chimica Acta, Vol. 650, No. 1, 2009, pp. 33-38. |