 Vol.2, No.11, 1211-1224 (2010) Natural Science http://dx.doi.org/10.4236/ns.2010.211149 Copyright © 2010 SciRes. OPEN ACCESS On the recovery from the Little Ice Age Syun-Ichi Akasofu International Arctic Research Center, University of Alaska Fairbanks, Fairbanks, USA; sakasofu@iarc.uaf.edu Received 28 July 2010; revised 30 August 2010; accepted 3 September 2010. ABSTRACT A number of published papers and openly avail- able data on sea level changes, glacier retreat, freezing/break-up dates of rivers, sea ice retreat, tree-ring observations, ice cores and changes of the cosmic-ray intensity, from the year 1000 to the present, are studied to examine how the Earth has recovered from the Little Ice Age (LIA). We learn that the recovery from the LIA has proceeded continuously, roughly in a linear manner, from 1800-1850 to the present. The rate of the recovery in terms of temperature is about 0.5°C/100 years and thus it has important im- plications for understanding the present global warming. It is suggested on the basis of a much longer period covering that the Earth is still in the process of recovery from the LIA; there is no sign to indicate the end of the recovery before 1900. Cosmic-ray intensity data show that solar activity was related to both the LIA and its re- covery. The multi-decadal oscillation of a period of 50 to 60 years was superposed on the linear change; it peaked in 1940 and 2000, causing the halting of warming temporarily after 2000. These changes are natural changes, and in order to determine the contribution of the manmade greenhouse effect, there is an urgent need to identify them correctly and accurately and re- move them from the present global warm- ing/cooling trend. Keywords: Little Ice Age 1. INTRODUCTION: THE LITTLE ICE AGE (LIA) The Little Ice Age (LIA) is discussed in a large num- ber of publications, including monographs (cf. Lamb 1; Grove 2). Although it is generally believed that the LIA ended more than two centuries ago, there has not been much discussion about how the recovery from it. In this paper, on the basis of published papers and some openly available data, we learn that the LIA certainly ended in about 1800-1850, but the recovery has con- tinuously progressed to the present with superposed ‘fluctuations’. In this section, we briefly review data from the LIA. In Section 2, ice core data, river freeze/break-up dates, sea level changes, sea ice changes, glacier changes, tree-ring data and cosmic-ray intensity data, are examined, and we learn that the recovery pro- gressed from 1800-1850 to the present. In Section 3, having more accurate data after 1900, we learn that tem- perature changes during the 20th century can be judged as a continuation of the recovery, approximated by a lin- ear change at the rate of about 0.5 C/100 years, with the superposed multi-decadal oscillation. In Section 4, we learn on the basis of changes of the cosmic-ray intensity from the year 1000 to the present that solar activity was relatively low during the LIA, but began to recover from about 1800-1850. In Section 5, it is suggested that the multi-decadal oscillation is halting the recovery from the LIA temporarily and that this situation is similar to the situation from 1940 to 1975. The summary is given in Section 6 and the conclusion in Section 7. There is little doubt that the Earth experienced a rela- tively cool period after the Medieval Warm Period around the year 1000. In this section, we briefly review changes of temperature from about 1000 to the present before examining details of the recovery from the LIA. Figure 1(a) shows a typical example of tree-ring data from the middle latitudes (Esper et al. 3; Frank et al. 4). Compared with the mean 1961-1990 level, the temperature was relatively low from about 1100 to 1800-1850, indicating that the Earth experienced a rela- tively cool period, the LIA. Our particular interest here is the recovery that began in about 1800-1850, namely the temperature increase here from 1800-1850 to the present. It can be seen that the temperature rise from 1800-1850 to the present was continuous with super- posed ‘fluctuations’ and that there is no sign of the end of the recovery before 1900. Figure 1(b) shows temperature changes from the year 900 to the present, which combines seven (including Figure 1(a)) different research results (National Research 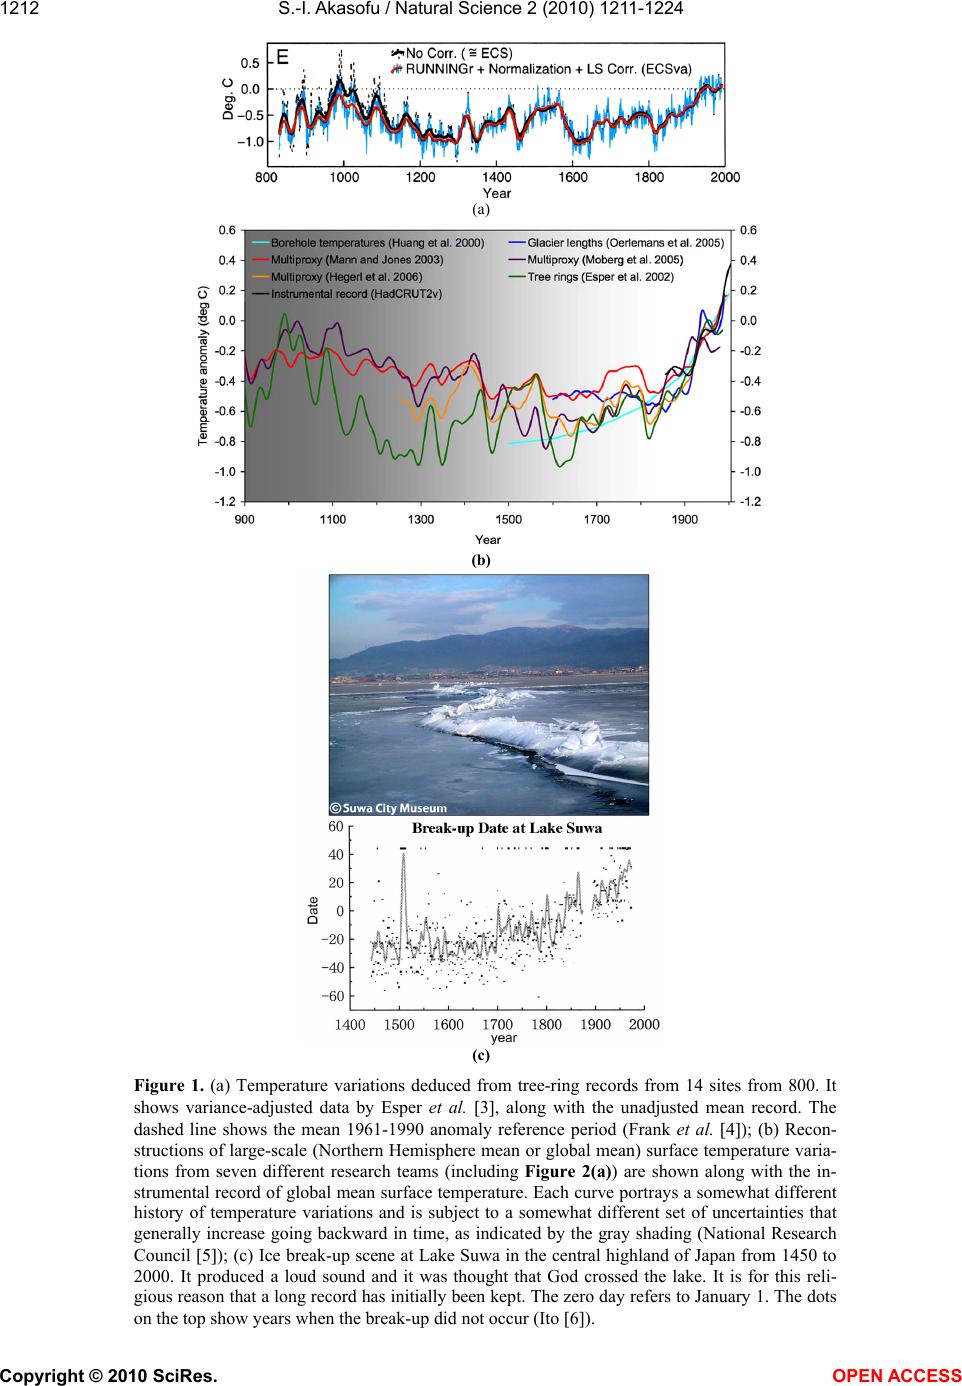 S.-I. Akasofu / Natural Science 2 (2010) 1211-1224 Copyright © 2010 SciRes. OPEN ACCESS 1212 (a) (b) (c) Figure 1. (a) Temperature variations deduced from tree-ring records from 14 sites from 800. It shows variance-adjusted data by Esper et al. 3, along with the unadjusted mean record. The dashed line shows the mean 1961-1990 anomaly reference period (Frank et al. 4); (b) Recon- structions of large-scale (Northern Hemisphere mean or global mean) surface temperature varia- tions from seven different research teams (including Figure 2(a)) are shown along with the in- strumental record of global mean surface temperature. Each curve portrays a somewhat different history of temperature variations and is subject to a somewhat different set of uncertainties that generally increase going backward in time, as indicated by the gray shading (National Research Council 5); (c) Ice break-up scene at Lake Suwa in the central highland of Japan from 1450 to 2000. It produced a loud sound and it was thought that God crossed the lake. It is for this reli- gious reason that a long record has initially been kept. The zero day refers to January 1. The dots on the top show years when the break-up did not occur (Ito 6). 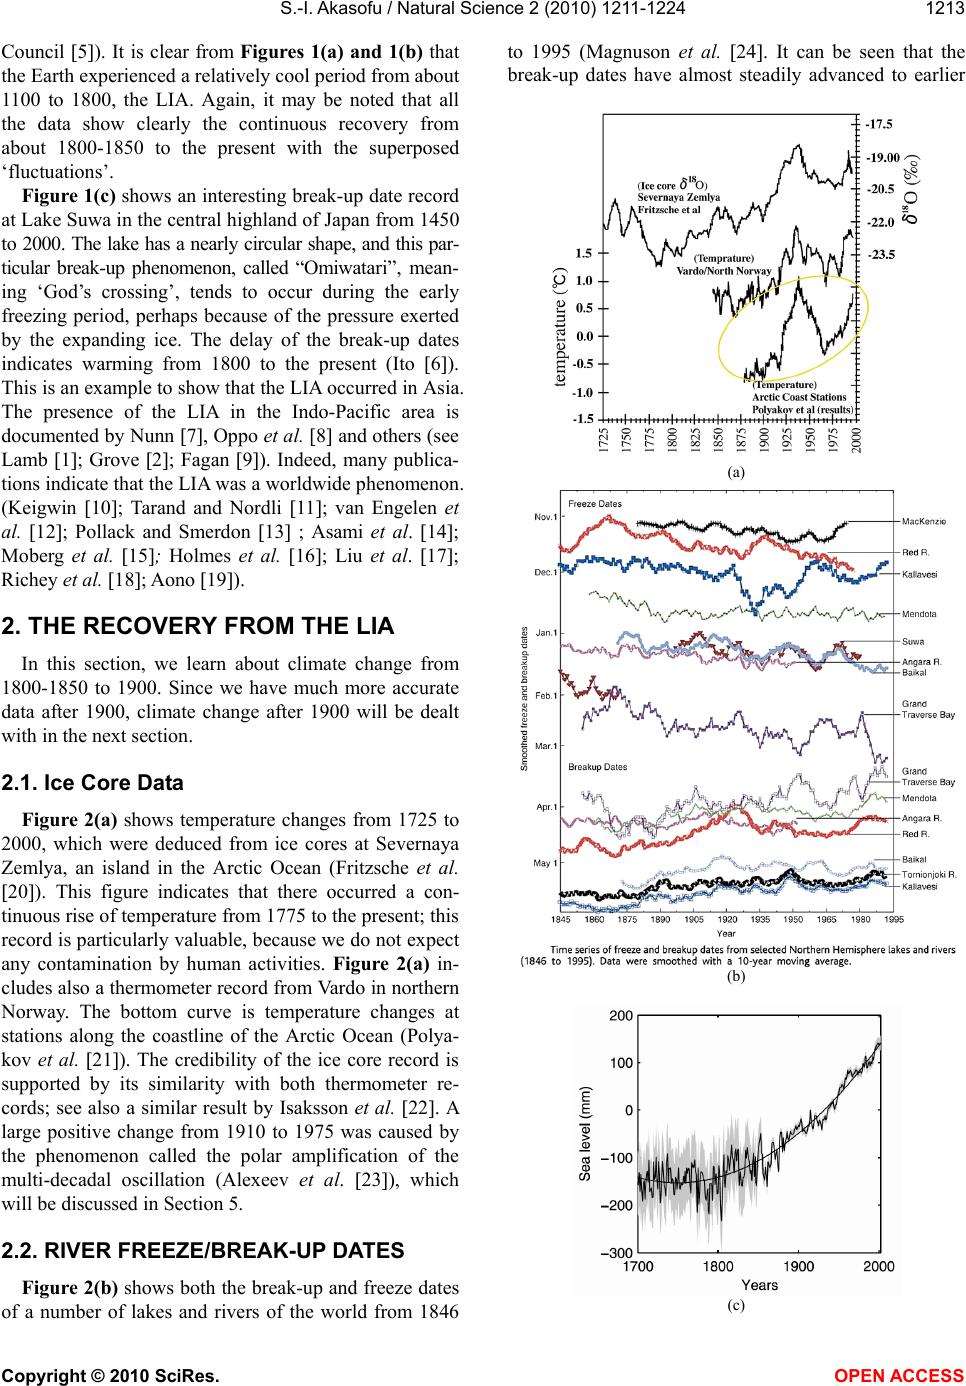 S.-I. Akasofu / Natural Science 2 (2010) 1211-1224 Copyright © 2010 SciRes. OPEN ACCESS 1213 Council 5). It is clear from Figures 1(a) and 1(b) that the Earth experienced a relatively cool period from about 1100 to 1800, the LIA. Again, it may be noted that all the data show clearly the continuous recovery from about 1800-1850 to the present with the superposed ‘fluctuations’. Figure 1(c) shows an interesting break-up date record at Lake Suwa in the central highland of Japan from 1450 to 2000. The lake has a nearly circular shape, and this par- ticular break-up phenomenon, called “Omiwatari”, mean- ing ‘God’s crossing’, tends to occur during the early freezing period, perhaps because of the pressure exerted by the expanding ice. The delay of the break-up dates indicates warming from 1800 to the present (Ito 6). This is an example to show that the LIA occurred in Asia. The presence of the LIA in the Indo-Pacific area is documented by Nunn 7, Oppo et al. 8 and others (see Lamb 1; Grove 2; Fagan 9). Indeed, many publica- tions indicate that the LIA was a worldwide phenomenon. (Keigwin 10; Tarand and Nordli 11; van Engelen et al. 12; Pollack and Smerdon 13 ; Asami et al. 14; Moberg et al. 15; Holmes et al. 16; Liu et al. 17; Richey et al. 18; Aono 19). 2. THE RECOVERY FROM THE LIA In this section, we learn about climate change from 1800-1850 to 1900. Since we have much more accurate data after 1900, climate change after 1900 will be dealt with in the next section. 2.1. Ice Core Data Figure 2(a) shows temperature changes from 1725 to 2000, which were deduced from ice cores at Severnaya Zemlya, an island in the Arctic Ocean (Fritzsche et al. 20). This figure indicates that there occurred a con- tinuous rise of temperature from 1775 to the present; this record is particularly valuable, because we do not expect any contamination by human activities. Figure 2(a) in- cludes also a thermometer record from Vardo in northern Norway. The bottom curve is temperature changes at stations along the coastline of the Arctic Ocean (Polya- kov et al. 21). The credibility of the ice core record is supported by its similarity with both thermometer re- cords; see also a similar result by Isaksson et al. 22. A large positive change from 1910 to 1975 was caused by the phenomenon called the polar amplification of the multi-decadal oscillation (Alexeev et al. 23), which will be discussed in Section 5. 2.2. RIVER FREEZE/BREAK-UP DATES Figure 2(b) shows both the break-up and freeze dates of a number of lakes and rivers of the world from 1846 to 1995 (Magnuson et al. 24. It can be seen that the break-up dates have almost steadily advanced to earlier (a) (b) (c)  S.-I. Akasofu / Natural Science 2 (2010) 1211-1224 Copyright © 2010 SciRes. OPEN ACCESS 1214 (d) (e) Figure 2. (a) Late Holocene ice core record from Akademii Nauk Ice Cap, Severnaya Zemlya, Rus- sian Arctic, by Fritzsche 20, together with temperature records from Vardo, Norway, and from sta- tions along the arctic coast (Polyakov et al 21); (b) Freeze dates and break-up dates of lakes and riv- ers in the Northern Hemisphere from 1845~1993 (Magnuson et al 24; (c)Global sea level change from 1700 to the present (Jevrejeva et al 26; (d) Upper, retreat of sea ice in the Norwegian Sea (Vinje 27; note that the downward slope indicates a northward shift. Lower, satellite data corre- sponding to the period between 1970 and 1998; (e) Variations of the occurrence of sea ice at the coast of Iceland from the year 800. This work was done by L. Koch (Lamb 1.). dates in the year, while the freeze dates seemed to shift steadily to later dates. Similar ice break-up data are also available by Tarand and Nordlie 11 and van Engelen et al. 12. 2.3. Sea Level Changes The linear trend of the recovery from the LIA can also be seen in sea level changes (Jevrejena et al. 25,26. Figure 2(c) shows the global sea level from 1800. It is clear that the sea level began to increase in about 1850 and continued rising almost linearly to the present. 2.4. Sea Ice Changes There is no accurate Arctic Ocean data until satellite  S.-I. Akasofu / Natural Science 2 (2010) 1211-1224 Copyright © 2010 SciRes. OPEN ACCESS 1215 observations became available in the 1970s. The only long-term observation of sea ice is available from the Norwegian Sea. Figure 2(d) shows changes in the south- ern edge of sea ice in the Norwegian Sea. It has been receding from about 1800 to the present at almost the same rate (Vinje 27. In the lower part, satellite data are shown. Although a drastic decrease in 2007 (not shown here) was widely reported, it is found that winds and many other factor were responsible for it (Zhang et al. 28,29; in fact, the ice has shown a steady recovery since then (Muskett 30. The large ‘fluctuations’ between 1910 and 1975 are likely related to the multi-decadal oscilla- tion, which is discussed in Section 5. Figure 2(e) shows variations of the occurrence of sea ice on the coasts of Iceland (see the figure caption for the reference). The decline after 1800 corresponds to the northward shift shown in Figure 2(d). Another impor- tant piece of evidence to notice is that, as Figure 4(b) shows later, there was a gradual build-up of sea ice, be- ginning in about 1200 or after 1400, at the beginning of the LIA. 2.5. Glaciers Figures 3(a-f) show records of glaciers in Alaska, New Zealand, the European Alps, and the Himalayas. These glaciers have been receding from the time of the earliest available records, about 1800 and an accurate terminus records. There are also a large number of simi- lar records from the European Alps, Alaska, and else- where (Grove 2; Molnia 31). Molnia’s examples are shown in his figures 33, 34, 81, 107 (same as Figure 3(a)) and 301. Thus, it may be said that many glaciers in the world have been retreating from 1800-1850 to the present; the retreat is not a phenomenon that began only in recent years. In a large number of recent publications, photograph sets of the same glaciers taken early and late in the 1900s are shown as evidence of the effect of CO2 (cf. ACIA 32; Strom 33). However, Figure 3(a-f) demonstrate that those recent photographs are mislead- ing as evidence of the sudden warming after 1900 and of the greenhouse effect. Therefore, such a set of photo- graphs cannot be used as evidences supporting the greenhouse effect of CO2. It is interesting to examine glacier changes before 1800. Figure 3(d) shows radiocarbon datings related to glacial advances in some of the Juneau outlet glaciers (Grove 34. Each advance killed trees and left in situ stumps for analyses. These advances occurred before Glacier Bay glaciers began to recede in about 1800 (Figure 3(a)). Figure 3(e) shows changes of the Mer de Glace gla- cier in the Alps. It began to retreat in about 1852. Figure 3(f) shows its changes in more detail (von Michael Kuhn 35. This particular glacier began to build up after 1550 (namely during the LIA) and began to retreat after 1850 (Holzhausen et al. 36). There are also various reports about advancing gla- ciers during the LIA in Scandinavia (cf. Lamb 1). Therefore, it is clear that many glaciers advanced during the LIA before starting to retreat in about 1800-1850. Altogether, long- te r m glacier data presented here show that glaciers advanced from about 1400 and began to retreat rather steadily after 1800-1850. These facts con- firm that the Earth experienced the LIA and began to recover from it as evidenced by a number of natural phenomena, such as retreating glaciers and sea ice from about 1800-1850 to the present. A large number of his- (a) (b) 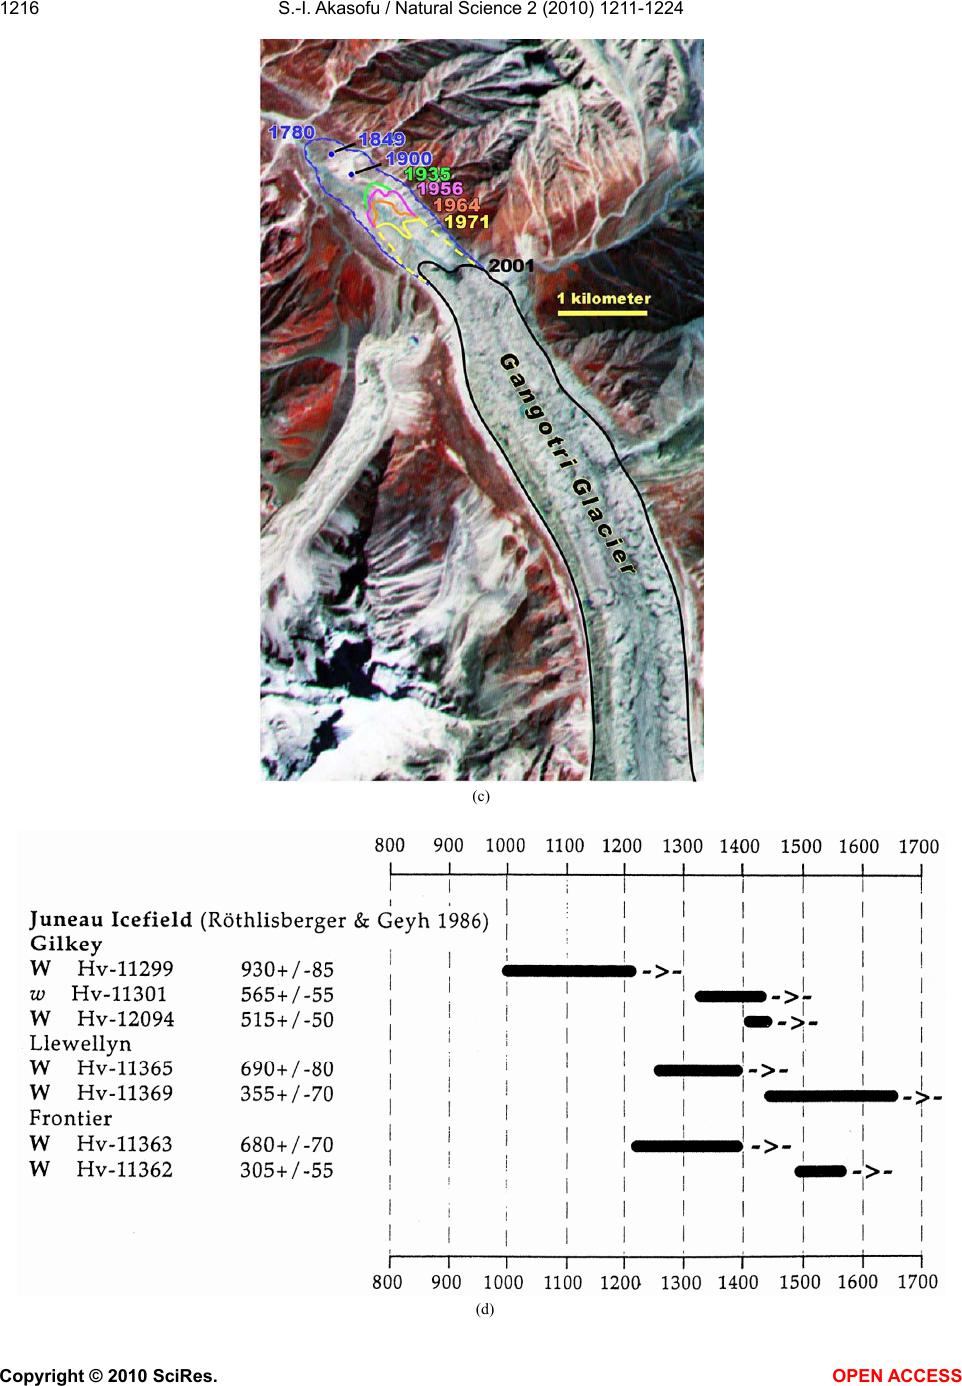 S.-I. Akasofu / Natural Science 2 (2010) 1211-1224 Copyright © 2010 SciRes. OPEN ACCESS 1216 (c) (d) 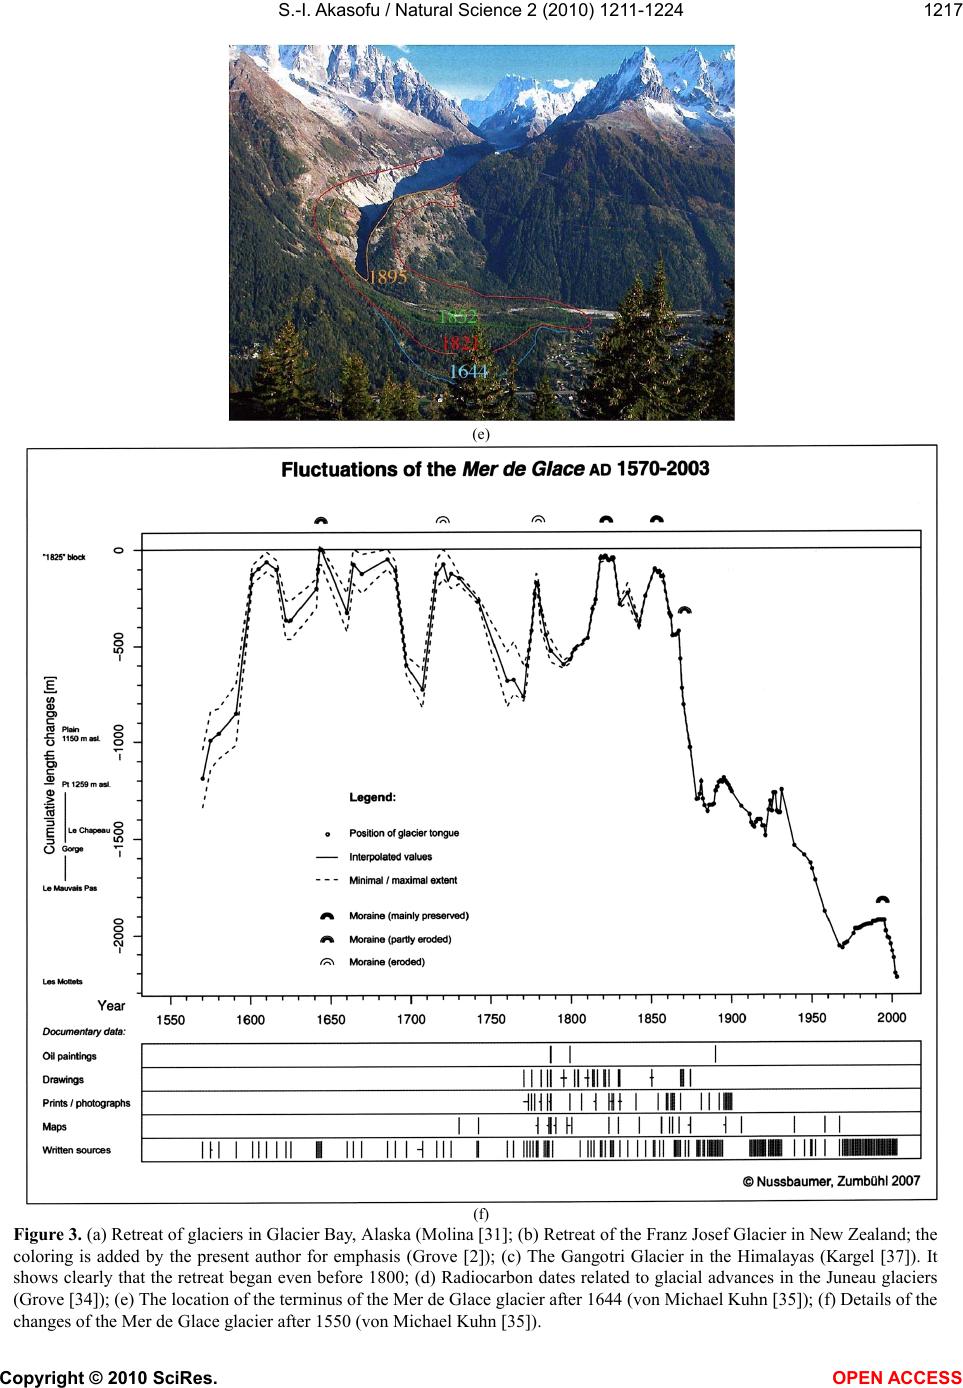 S.-I. Akasofu / Natural Science 2 (2010) 1211-1224 Copyright © 2010 SciRes. OPEN ACCESS 1217 (e) (f) Figure 3. (a) Retreat of glaciers in Glacier Bay, Alaska (Molina 31; (b) Retreat of the Franz Josef Glacier in New Zealand; the coloring is added by the present author for emphasis (Grove 2); (c) The Gangotri Glacier in the Himalayas (Kargel 37). It shows clearly that the retreat began even before 1800; (d) Radiocarbon dates related to glacial advances in the Juneau glaciers (Grove 34); (e) The location of the terminus of the Mer de Glace glacier after 1644 (von Michael Kuhn 35); (f) Details of the changes of the Mer de Glace glacier after 1550 (von Michael Kuhn 35). 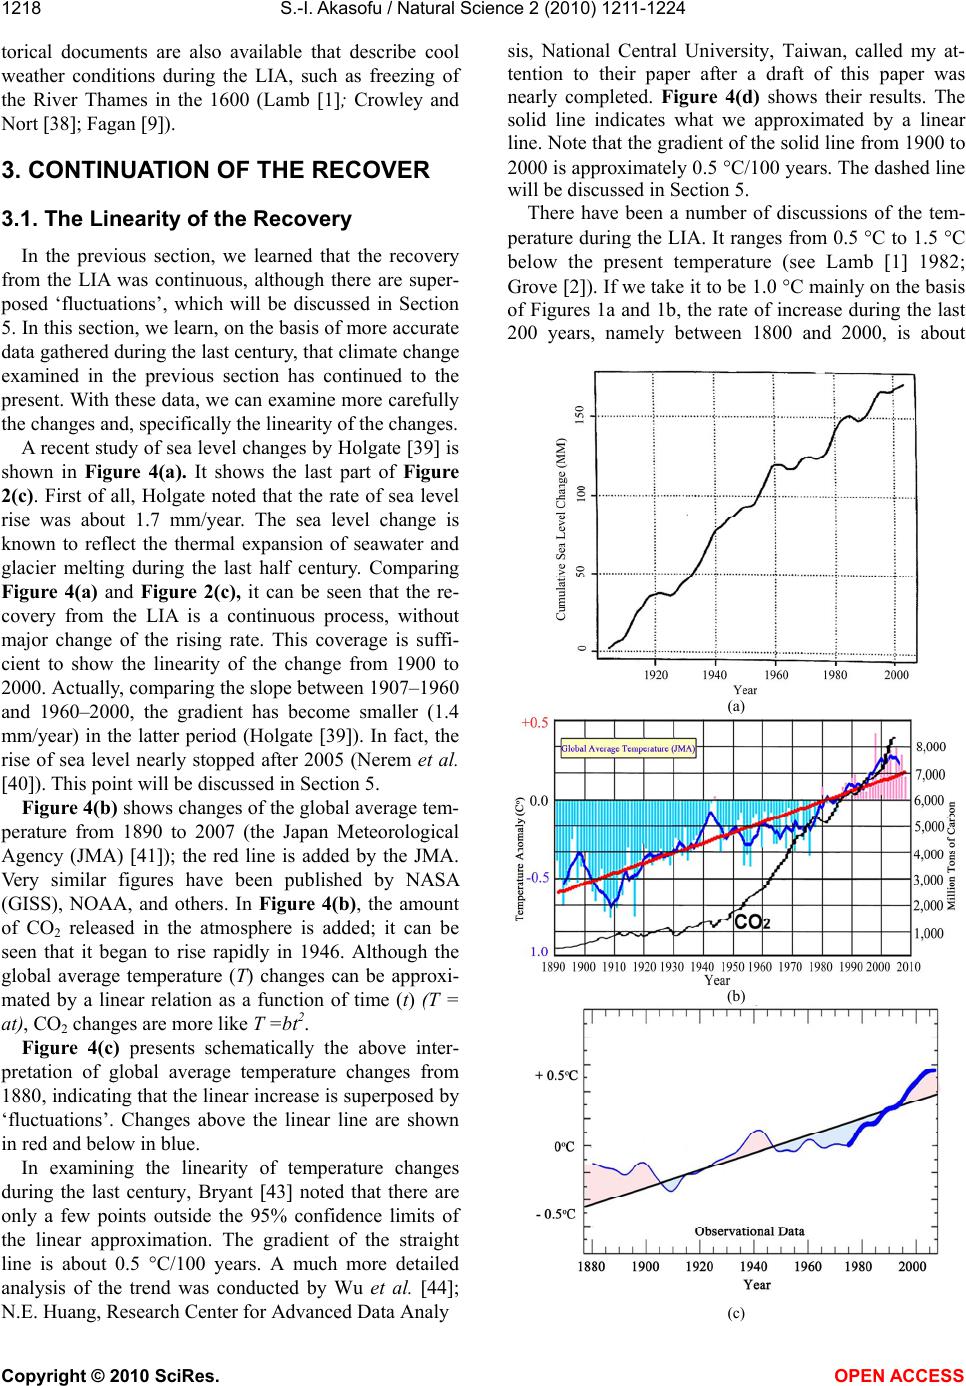 S.-I. Akasofu / Natural Science 2 (2010) 1211-1224 Copyright © 2010 SciRes. OPEN ACCESS 1218 torical documents are also available that describe cool weather conditions during the LIA, such as freezing of the River Thames in the 1600 (Lamb 1; Crowley and Nort 38; Fagan 9). 3. CONTINUATION OF THE RECOVER 3.1. The Linearity of the Recovery In the previous section, we learned that the recovery from the LIA was continuous, although there are super- posed ‘fluctuations’, which will be discussed in Section 5. In this section, we learn, on the basis of more accurate data gathered during the last century, that climate change examined in the previous section has continued to the present. With these data, we can examine more carefully the changes and, specifically the linearity of the changes. A recent study of sea level changes by Holgate 39 is shown in Figure 4(a). It shows the last part of Figure 2(c). First of all, Holgate noted that the rate of sea level rise was about 1.7 mm/year. The sea level change is known to reflect the thermal expansion of seawater and glacier melting during the last half century. Comparing Figure 4(a) and Figure 2(c), it can be seen that the re- covery from the LIA is a continuous process, without major change of the rising rate. This coverage is suffi- cient to show the linearity of the change from 1900 to 2000. Actually, comparing the slope between 1907–1960 and 1960–2000, the gradient has become smaller (1.4 mm/year) in the latter period (Holgate 39). In fact, the rise of sea level nearly stopped after 2005 (Nerem et al. 40). This point will be discussed in Section 5. Figure 4(b) shows changes of the global average tem- perature from 1890 to 2007 (the Japan Meteorological Agency (JMA) 41); the red line is added by the JMA. Very similar figures have been published by NASA (GISS), NOAA, and others. In Figure 4(b), the amount of CO2 released in the atmosphere is added; it can be seen that it began to rise rapidly in 1946. Although the global average temperature (T) changes can be approxi- mated by a linear relation as a function of time (t) (T = at), CO2 changes are more like T =bt2. Figure 4(c) presents schematically the above inter- pretation of global average temperature changes from 1880, indicating that the linear increase is superposed by ‘fluctuations’. Changes above the linear line are shown in red and below in blue. In examining the linearity of temperature changes during the last century, Bryant 43 noted that there are only a few points outside the 95% confidence limits of the linear approximation. The gradient of the straight line is about 0.5 °C/100 years. A much more detailed analysis of the trend was conducted by Wu et al. 44; N.E. Huang, Research Center for Advanced Data Analy sis, National Central University, Taiwan, called my at- tention to their paper after a draft of this paper was nearly completed. Figure 4(d) shows their results. The solid line indicates what we approximated by a linear line. Note that the gradient of the solid line from 1900 to 2000 is approximately 0.5 C/100 years. The dashed line will be discussed in Section 5. There have been a number of discussions of the tem- perature during the LIA. It ranges from 0.5 C to 1.5 C below the present temperature (see Lamb 1 1982; Grove 2). If we take it to be 1.0 C mainly on the basis of Figures 1a and 1b, the rate of increase during the last 200 years, namely between 1800 and 2000, is about (a) (b) (c) 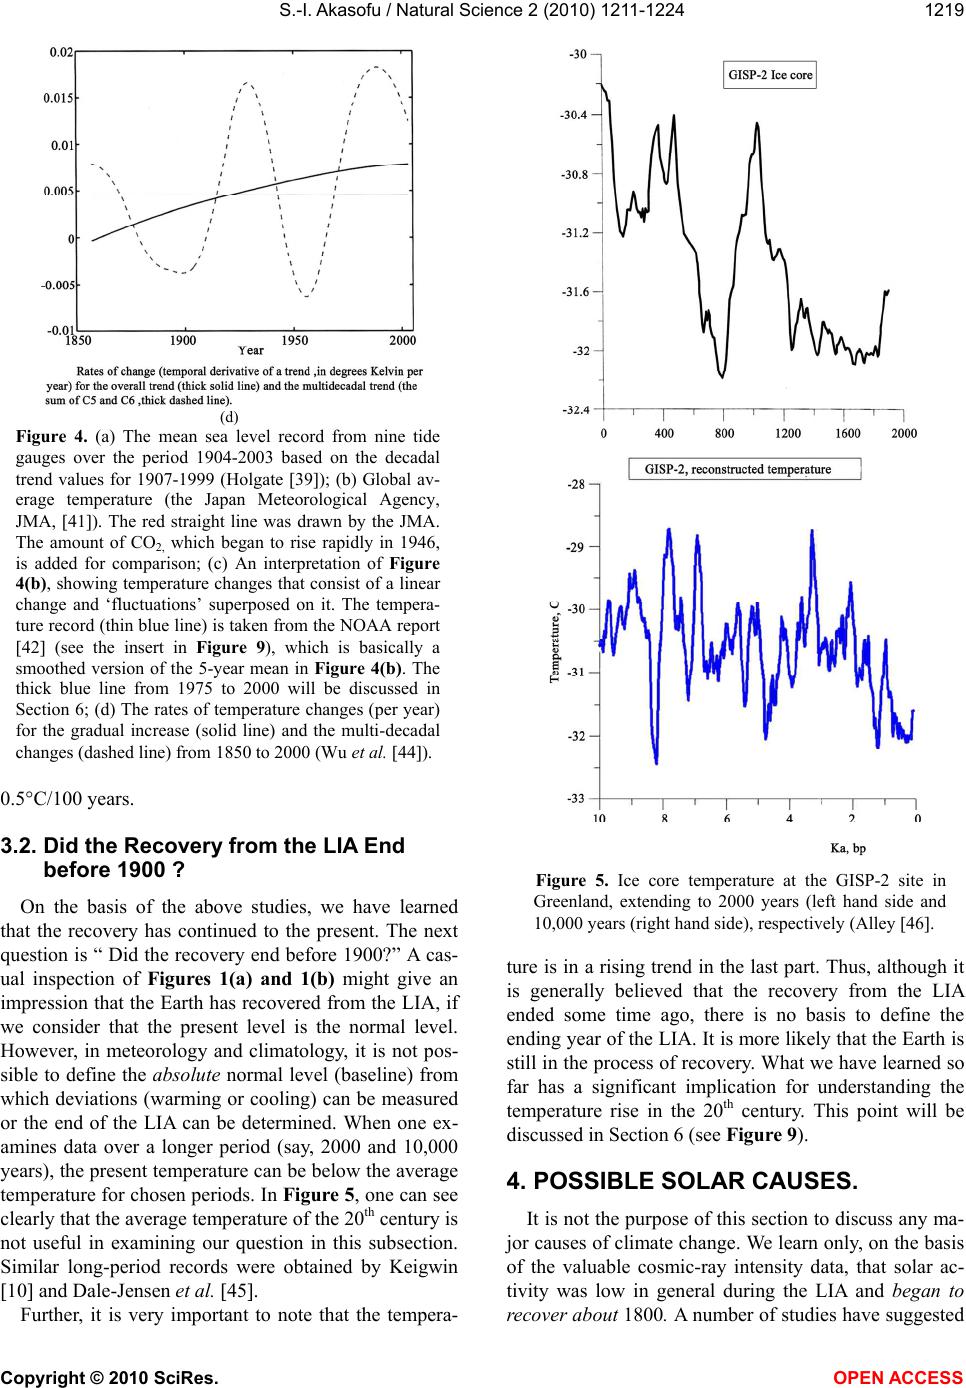 S.-I. Akasofu / Natural Science 2 (2010) 1211-1224 Copyright © 2010 SciRes. OPEN ACCESS 1219 (d) Figure 4. (a) The mean sea level record from nine tide gauges over the period 1904-2003 based on the decadal trend values for 1907-1999 (Holgate 39); (b) Global av- erage temperature (the Japan Meteorological Agency, JMA, 41). The red straight line was drawn by the JMA. The amount of CO2, which began to rise rapidly in 1946, is added for comparison; (c) An interpretation of Figure 4(b), showing temperature changes that consist of a linear change and ‘fluctuations’ superposed on it. The tempera- ture record (thin blue line) is taken from the NOAA report 42 (see the insert in Figure 9), which is basically a smoothed version of the 5-year mean in Figure 4(b). The thick blue line from 1975 to 2000 will be discussed in Section 6; (d) The rates of temperature changes (per year) for the gradual increase (solid line) and the multi-decadal changes (dashed line) from 1850 to 2000 (Wu et al. 44). 0.5C/100 years. 3.2. Did the Recovery from the LIA End before 1900 ? On the basis of the above studies, we have learned that the recovery has continued to the present. The next question is “ Did the recovery end before 1900?” A cas- ual inspection of Figures 1(a) and 1(b) might give an impression that the Earth has recovered from the LIA, if we consider that the present level is the normal level. However, in meteorology and climatology, it is not pos- sible to define the absolute normal level (baseline) from which deviations (warming or cooling) can be measured or the end of the LIA can be determined. When one ex- amines data over a longer period (say, 2000 and 10,000 years), the present temperature can be below the average temperature for chosen periods. In Figure 5, one can see clearly that the average temperature of the 20th century is not useful in examining our question in this subsection. Similar long-period records were obtained by Keigwin 10 and Dale-Jensen et al. 45. Further, it is very important to note that the tempera- Figure 5. Ice core temperature at the GISP-2 site in Greenland, extending to 2000 years (left hand side and 10,000 years (right hand side), respectively (Alley 46. ture is in a rising trend in the last part. Thus, although it is generally believed that the recovery from the LIA ended some time ago, there is no basis to define the ending year of the LIA. It is more likely that the Earth is still in the process of recovery. What we have learned so far has a significant implication for understanding the temperature rise in the 20th century. This point will be discussed in Section 6 (see Figure 9). 4. POSSIBLE SOLAR CAUSES. It is not the purpose of this section to discuss any ma- jor causes of climate change. We learn only, on the basis of the valuable cosmic-ray intensity data, that solar ac- tivity was low in general during the LIA and began to recover about 1800 . A number of studies have suggested 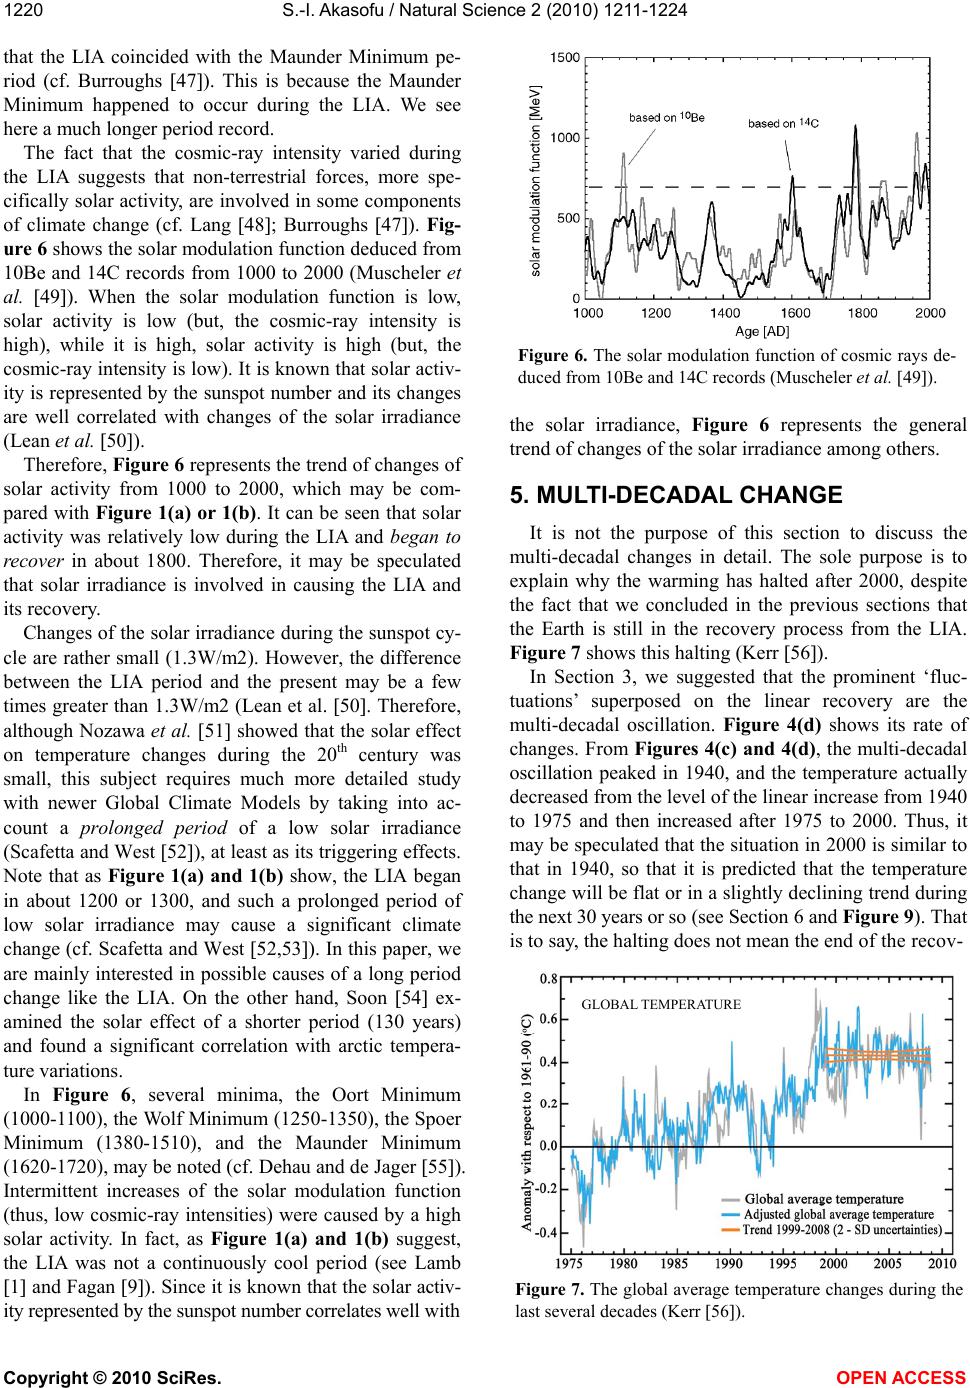 S.-I. Akasofu / Natural Science 2 (2010) 1211-1224 Copyright © 2010 SciRes. OPEN ACCESS 1220 that the LIA coincided with the Maunder Minimum pe- riod (cf. Burroughs 47). This is because the Maunder Minimum happened to occur during the LIA. We see here a much longer period record. The fact that the cosmic-ray intensity varied during the LIA suggests that non-terrestrial forces, more spe- cifically solar activity, are involved in some components of climate change (cf. Lang 48; Burroughs 47). Fig- ure 6 shows the solar modulation function deduced from 10Be and 14C records from 1000 to 2000 (Muscheler et al. 49). When the solar modulation function is low, solar activity is low (but, the cosmic-ray intensity is high), while it is high, solar activity is high (but, the cosmic-ray intensity is low). It is known that solar activ- ity is represented by the sunspot number and its changes are well correlated with changes of the solar irradiance (Lean et al. 50). Therefore, Figure 6 represents the trend of changes of solar activity from 1000 to 2000, which may be com- pared with Figure 1(a) or 1(b). It can be seen that solar activity was relatively low during the LIA and began to recover in about 1800. Therefore, it may be speculated that solar irradiance is involved in causing the LIA and its recovery. Changes of the solar irradiance during the sunspot cy- cle are rather small (1.3W/m2). However, the difference between the LIA period and the present may be a few times greater than 1.3W/m2 (Lean et al. 50. Therefore, although Nozawa et al. 51 showed that the solar effect on temperature changes during the 20th century was small, this subject requires much more detailed study with newer Global Climate Models by taking into ac- count a prolonged period of a low solar irradiance (Scafetta and West 52), at least as its triggering effects. Note that as Figure 1(a) and 1(b) show, the LIA began in about 1200 or 1300, and such a prolonged period of low solar irradiance may cause a significant climate change (cf. Scafetta and West 52,53). In this paper, we are mainly interested in possible causes of a long period change like the LIA. On the other hand, Soon 54 ex- amined the solar effect of a shorter period (130 years) and found a significant correlation with arctic tempera- ture variations. In Figure 6, several minima, the Oort Minimum (1000-1100), the Wolf Minimum (1250-1350), the Spoer Minimum (1380-1510), and the Maunder Minimum (1620-1720), may be noted (cf. Dehau and de Jager 55). Intermittent increases of the solar modulation function (thus, low cosmic-ray intensities) were caused by a high solar activity. In fact, as Figure 1(a) and 1(b) suggest, the LIA was not a continuously cool period (see Lamb 1 and Fagan 9). Since it is known that the solar activ- ity represented by the sunspot number correlates well with Figure 6. The solar modulation function of cosmic rays de- duced from 10Be and 14C records (Muscheler et al. 49). the solar irradiance, Figure 6 represents the general trend of changes of the solar irradiance among others. 5. MULTI-DECADAL CHANGE It is not the purpose of this section to discuss the multi-decadal changes in detail. The sole purpose is to explain why the warming has halted after 2000, despite the fact that we concluded in the previous sections that the Earth is still in the recovery process from the LIA. Figure 7 shows this halting (Kerr 56). In Section 3, we suggested that the prominent ‘fluc- tuations’ superposed on the linear recovery are the multi-decadal oscillation. Figure 4(d) shows its rate of changes. From Figures 4(c) and 4(d), the multi-decadal oscillation peaked in 1940, and the temperature actually decreased from the level of the linear increase from 1940 to 1975 and then increased after 1975 to 2000. Thus, it may be speculated that the situation in 2000 is similar to that in 1940, so that it is predicted that the temperature change will be flat or in a slightly declining trend during the next 30 years or so (see Section 6 and Figure 9). That is to say, the halting does not mean the end of the recov- GLOBAL TEMPERATURE Figure 7. The global average temperature changes during the last several decades (Kerr 56). 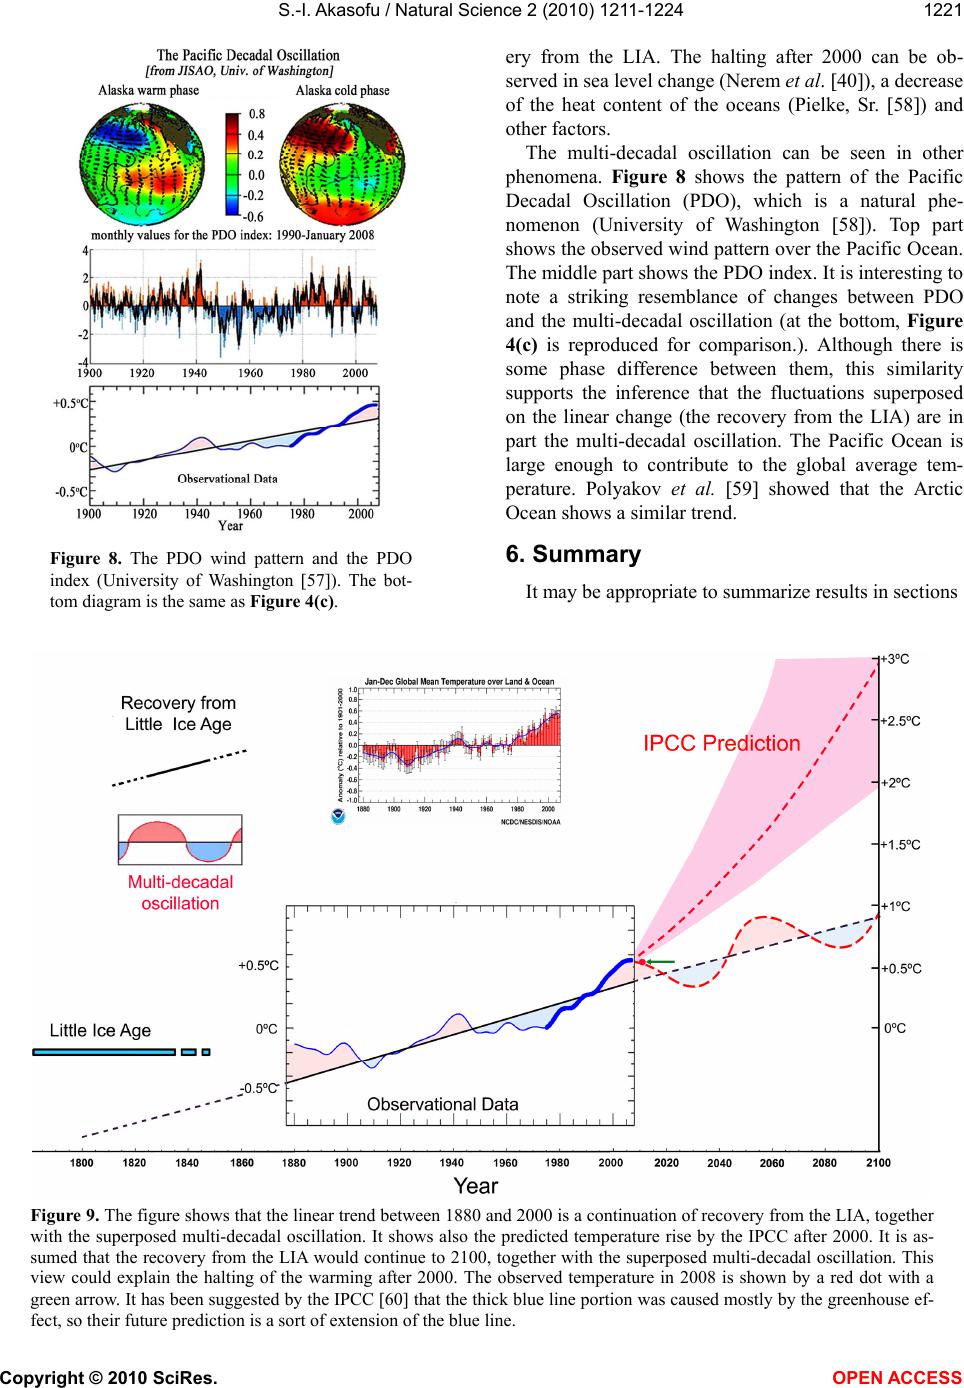 S.-I. Akasofu / Natural Science 2 (2010) 1211-1224 Copyright © 2010 SciRes. OPEN ACCESS 1221 Figure 8. The PDO wind pattern and the PDO index (University of Washington 57). The bot- tom diagram is the same as Figure 4(c). ery from the LIA. The halting after 2000 can be ob- served in sea level change (Nerem et al. 40), a decrease of the heat content of the oceans (Pielke, Sr. 58) and other factors. The multi-decadal oscillation can be seen in other phenomena. Figure 8 shows the pattern of the Pacific Decadal Oscillation (PDO), which is a natural phe- nomenon (University of Washington 58). Top part shows the observed wind pattern over the Pacific Ocean. The middle part shows the PDO index. It is interesting to note a striking resemblance of changes between PDO and the multi-decadal oscillation (at the bottom, Figure 4(c) is reproduced for comparison.). Although there is some phase difference between them, this similarity supports the inference that the fluctuations superposed on the linear change (the recovery from the LIA) are in part the multi-decadal oscillation. The Pacific Ocean is large enough to contribute to the global average tem- perature. Polyakov et al. 59 showed that the Arctic Ocean shows a similar trend. 6. Summary It may be appropriate to summarize results in sections Figure 9. The figure shows that the linear trend between 1880 and 2000 is a continuation of recovery from the LIA, together with the superposed multi-decadal oscillation. It shows also the predicted temperature rise by the IPCC after 2000. It is as- sumed that the recovery from the LIA would continue to 2100, together with the superposed multi-decadal oscillation. This view could explain the halting of the warming after 2000. The observed temperature in 2008 is shown by a red dot with a green arrow. It has been suggested by the IPCC 60 that the thick blue line portion was caused mostly by the greenhouse ef- fect, so their future prediction is a sort of extension of the blue line. 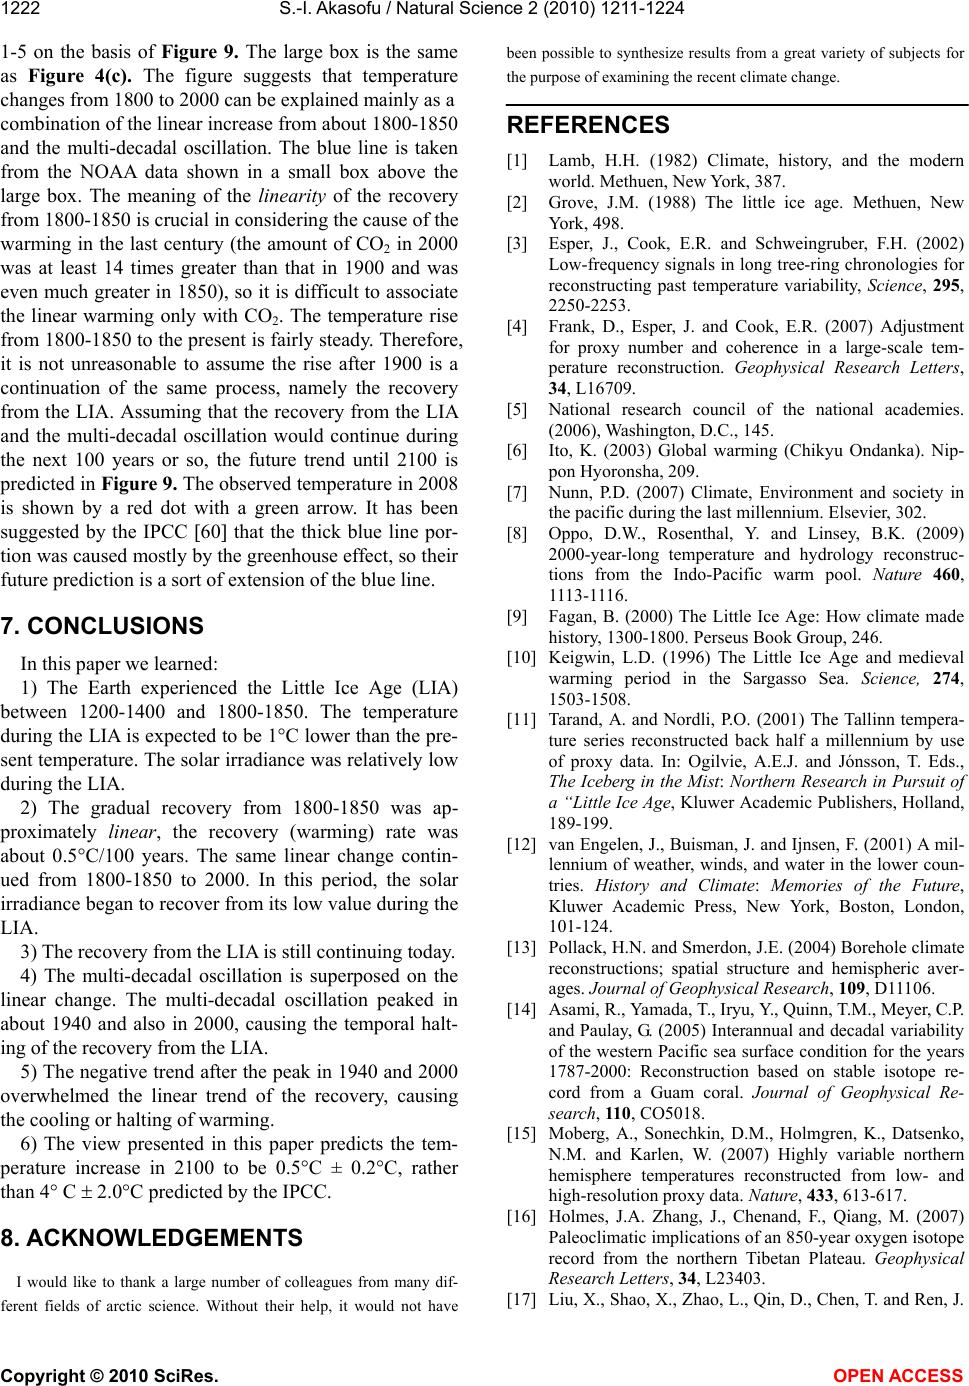 S.-I. Akasofu / Natural Science 2 (2010) 1211-1224 Copyright © 2010 SciRes. OPEN ACCESS 1222 1-5 on the basis of Figure 9. The large box is the same as Figure 4(c). The figure suggests that temperature changes from 1800 to 2000 can be explained mainly as a combination of the linear increase from about 1800-1850 and the multi-decadal oscillation. The blue line is taken from the NOAA data shown in a small box above the large box. The meaning of the linearity of the recovery from 1800-1850 is crucial in considering the cause of the warming in the last century (the amount of CO2 in 2000 was at least 14 times greater than that in 1900 and was even much greater in 1850), so it is difficult to associate the linear warming only with CO2. The temperature rise from 1800-1850 to the present is fairly steady. Therefore, it is not unreasonable to assume the rise after 1900 is a continuation of the same process, namely the recovery from the LIA. Assuming that the recovery from the LIA and the multi-decadal oscillation would continue during the next 100 years or so, the future trend until 2100 is predicted in Figure 9. The observed temperature in 2008 is shown by a red dot with a green arrow. It has been suggested by the IPCC 60 that the thick blue line por- tion was caused mostly by the greenhouse effect, so their future prediction is a sort of extension of the blue line. 7. CONCLUSIONS In this paper we learned: 1) The Earth experienced the Little Ice Age (LIA) between 1200-1400 and 1800-1850. The temperature during the LIA is expected to be 1C lower than the pre- sent temperature. The solar irradiance was relatively low during the LIA. 2) The gradual recovery from 1800-1850 was ap- proximately linear, the recovery (warming) rate was about 0.5°C/100 years. The same linear change contin- ued from 1800-1850 to 2000. In this period, the solar irradiance began to recover from its low value during the LIA. 3) The recovery from the LIA is still continuing today. 4) The multi-decadal oscillation is superposed on the linear change. The multi-decadal oscillation peaked in about 1940 and also in 2000, causing the temporal halt- ing of the recovery from the LIA. 5) The negative trend after the peak in 1940 and 2000 overwhelmed the linear trend of the recovery, causing the cooling or halting of warming. 6) The view presented in this paper predicts the tem- perature increase in 2100 to be 0.5°C ± 0.2C, rather than 4 C 2.0C predicted by the IPCC. 8. ACKNOWLEDGEMENTS I would like to thank a large number of colleagues from many dif- ferent fields of arctic science. Without their help, it would not have been possible to synthesize results from a great variety of subjects for the purpose of examining the recent climate change. REFERENCES [1] Lamb, H.H. (1982) Climate, history, and the modern world. Methuen, New York, 387. [2] Grove, J.M. (1988) The little ice age. Methuen, New York, 498. [3] Esper, J., Cook, E.R. and Schweingruber, F.H. (2002) Low-frequency signals in long tree-ring chronologies for reconstructing past temperature variability, Scienc e , 295, 2250-2253. [4] Frank, D., Esper, J. and Cook, E.R. (2007) Adjustment for proxy number and coherence in a large-scale tem- perature reconstruction. Geophysical Research Letters, 34, L16709. [5] National research council of the national academies. (2006), Washington, D.C., 145. [6] Ito, K. (2003) Global warming (Chikyu Ondanka). Nip- pon Hyoronsha, 209. [7] Nunn, P.D. (2007) Climate, Environment and society in the pacific during the last millennium. Elsevier, 302. [8] Oppo, D.W., Rosenthal, Y. and Linsey, B.K. (2009) 2000-year-long temperature and hydrology reconstruc- tions from the Indo-Pacific warm pool. Nature 460, 1113-1116. [9] Fagan, B. (2000) The Little Ice Age: How climate made history, 1300-1800. Perseus Book Group, 246. [10] Keigwin, L.D. (1996) The Little Ice Age and medieval warming period in the Sargasso Sea. Science, 274, 1503-1508. [11] Tarand, A. and Nordli, P.O. (2001) The Tallinn tempera- ture series reconstructed back half a millennium by use of proxy data. In: Ogilvie, A.E.J. and Jónsson, T. Eds., The Iceberg in the Mist: Northern Research in Pursuit of a “Little Ice Age, Kluwer Academic Publishers, Holland, 189-199. [12] van Engelen, J., Buisman, J. and Ijnsen, F. (2001) A mil- lennium of weather, winds, and water in the lower coun- tries. History and Climate: Memories of the Future, Kluwer Academic Press, New York, Boston, London, 101-124. [13] Pollack, H.N. and Smerdon, J.E. (2004) Borehole climate reconstructions; spatial structure and hemispheric aver- ages. Journal of Geophysical Research, 109, D11106. [14] Asami, R., Yamada, T., Iryu, Y., Quinn, T.M., Meyer, C.P. and Paulay, G. (2005) Interannual and decadal variability of the western Pacific sea surface condition for the years 1787-2000: Reconstruction based on stable isotope re- cord from a Guam coral. Journal of Geophysical Re- search, 110 , CO5018. [15] Moberg, A., Sonechkin, D.M., Holmgren, K., Datsenko, N.M. and Karlen, W. (2007) Highly variable northern hemisphere temperatures reconstructed from low- and high-resolution proxy data. Nature, 433, 613-617. [16] Holmes, J.A. Zhang, J., Chenand, F., Qiang, M. (2007) Paleoclimatic implications of an 850-year oxygen isotope record from the northern Tibetan Plateau. Geophysical Research Letters, 34, L23403. [17] Liu, X., Shao, X., Zhao, L., Qin, D., Chen, T. and Ren, J.  S.-I. Akasofu / Natural Science 2 (2010) 1211-1224 Copyright © 2010 SciRes. OPEN ACCESS 1223 (2007) Dendroclimatic temperature record derived from tree-ring width and stable carbon isotope chronologies in the Middle Qilian Mountains, China, Arctic. Antarctic, and Alpine Research, 39, 651-657. [18] Richey, J.N., Poore, R.Z., Flower, B.P. and Quinn, T.M. (2007) 1400 yr multi-proxy record of climate variability from the northern Gulf of Mexico. Geology, 35, 423. [19] Aono, Y. (2006) Climate reconstruction of spring-time temperature using phonological data flowering of cherry tree from old document. Grad. School of Life and Envi- ronmental Science, Osaka Prefecture University, 111. [20] Fritzsche, D., Schutt, R., Meyer, H., Miller, F., Wilhelms, T., Opel, T. and Savatyugin, L.M. (2006) Late Holocene ice core record from Akasemii Nauk Ice Cap, Severnaya Zemlya. Annals of Glaciology, 42, 361-366. [21] Polyakov, I.V., Alekseev, G.V., Bekryaev, R.V., Bhatt, U., Colony, R.L., Johnson, M.A., Karklin, V.P., Makshtas, A.P., Walsh, D. and Yulin, A.V. (2002) Observationally based assessment of polar amplification of global warm- ing. Geophysical Research Letters, 29, 4. [22] Isaksson, E., Hermanson, M., Hicks, S., Igarashi, M., Kamiyama, K., Moore, J., Motoyama, H., Muir, D., Pohjola, V., Vaikmäe, R., van de Wal , R.S.W. and Wata- nabe, O. (2003) Ice cores from Svalbard—useful ar- chives of past climate and pollution history. Physics and Chemistry of the Earth, 28, 1217-1228. [23] Alexeev, V.A., Langen, P.L. and Bates, J.R. (2005) Polar amplification of surface warming on an aquaplanet in “ghost forcing” experiments without sea ice feedbacks. Climate Dynamics, 24, 655-666. [24] Magnuson, J.J., Robertson, D.M., Benson, B.J., Wynne, R.H., Livingstone, D.M., Arai, T., Assel, R.A., Barry, G. R., Card, V., Kuusisto, E., Granin, N.G., Prowse, T.D., Stewart, K.M. and Vuglinski V.S. (2000) Historical trends in lake and river ice cover in the Northern hemi- sphere. Science, 289, 1743-1746. [25] Jevrejeva, S., Grinsted, A., Moore, J.C. and Holgate, S. (2006) Nonlinear trends and multiyear cycles in sea level records. Journal of Geophysical Research, 111, 11. [26] Jevrejeva, S., Moore, J.C., Grinsted. A. and Woodworth, P.L. (2008) Recent global sea level acceleration started over 200 years ago? Geophysical Research Letters, 35, L08715. [27] Vinje, T. (2001) Anomalies and trends of sea-ice extent and atmospheric circulation in the Nordic seas during the period 1864-1998. Journal of Climate, 14, 255-267. [28] Zhang, X., Lindsay, R., Steele. M. and Schweiger, A. (2008a) What drove the dramatic retreat of arctic sea ice during summer 2007? Geophysical Research Letters, 35, L11505. [29] Zhang, X., Sorteberg, A., Zhang, J., Gerdes, R. and Co- miso, J.C. (2008b) Recent radical shifts of atmospheric circulations and rapid changes in Arctic climate system. Geophysical Research Letters, 35, L22701. [30] Muskett, R. (2008) Personal communication. [31] Molnia, B. (2008) Glaciers of North America and Alaska. USGS, professional paper 1386K, 525. [32] ACIA (2005) Arctic Climate Impact Assessment. Cam- bridge University Press, UK, 1042. [33] Strom, R.G. (2007) Hot House: Global climate change and the human condition. Copernicus Books, 302. [34] Grove, J.M. (2001) The onset of the Little Ice Age. In: Jones, P.D., Ogilvie, A.E.J., Davies, T.D. and Briffa, K.R. Eds., History and Climate, Kluwer Academic/Plenum Publication, 153-185. [35] von Michael Kuhn, H. (2007) Fluctuations of the ‘Mer de Glace’ AD 1500-2000; an interdisciplinary approach us- ing new historical data and neural network simulations. Zeitschrift für Gletscherkunde und Glazialgeologie, 40, 183. [36] Holzhausen, H., Magny, M. and Zumbuühl, H.J. (2005) Glacier and lake-level variations in west-central Europe over the last 3500 years. The Holocene, 15, 789-801. [37] Kargel, J. (2008) Earth Observatory newsroom: New images-retreat of Gangotri Glacier USGS, 2008. http://earthobservatory.nasa.gov/Newsroom/NewImages/i mages.php3?img_id=16584 [38] Crowley. T.J. and North, G.R. (1991) Paleoclimatology. Oxford University Press, UK, 339. [39] Holgate, S.J. (2007) On the decadal rates of sea level change during the twentieth century. Geophys. Res. Lett., 34, L01602, doi:10.1029/2006GL028492. [40] Nerem, R., Chambers, D., Choe, J., Mitchum, G. and Ries, J. (2008) Building and understanding a climate data record of sea level change. http://sealevel.jpl.nasa.gov/ science/scientific-investigations-2008/nerem.html [41] Japan Meteorological Agency (JMA). http://www.data.kishou.go-jp/climate/cpinfo/temp/ay-wld .html [42] NOAA. http://www.ncdc.noaa.gov/oa/climate/research/ anomalies/index.html [43] Bryant, E. (1997) Climate Process & Change. Cambridge University Press, UK, 209. [44] Wu, Z., Huang, N.E., Long, S.R. and Peng, C.-H. (2007) On the trend, detrending, and variability of nonlinear and nonstationary time series. Proceedings of National A- cademy of Sciences, USA, 104, 14889-14894. [45] Dahl-Jensen, D., Mosegaard, K., Gundestrup, N., Clow, G.D., Johnson, S.J., Hansen, A.W. and Balling, N. (1998) Past Temperatures Directly from the Greenland Ice Sheet. Science, 282, 268-271. [46] Alley, R.B. (2000) The Younger Dryas cold interval as viewed from central Greenland. Quaternary Science Re- views, 19, 213-226. [47] Burroughs, W.J. (2001) Climate Change. Cambridge University Press, UK, 298. [48] Lang, K.R. (2000) The Sun from Space. Springer, New York, 357. [49] Musccheler, R., Joos, F., Beer, J., Vonmoos, M.S. and Snowball, I. (2007) Solar activity during last 1000yr in- ferred from radionuclide records. Quaternary Science Reviews, 26, 2682-2692. [50] Lean, J., Beer, J. and Bradley, R.S. (1995) Reconstruc- tion of solar irradiance since 1610: Implication for cli- mate change. Geophysical Research Letters, 22, 3195- 3198. [51] Nozawa, T., Nagashima, T., Shiogama, H. and Crooks, S.A. (2005) Detecting natural influence on surface air temperature change in the early twentieth century. Geo- physical Research Letters, 32, L20719. [52] Scafetta, N. and West, B.J. (2006) Phenomenological solar contribution to the 1900-2000 global surface warming. Geophysical Research Letters 33, Lo5708. [53] Scafetta, N. and West, B.J. (2006) Phenomenological  S.-I. Akasofu / Natural Science 2 (2010) 1211-1224 Copyright © 2010 SciRes. OPEN ACCESS 1224 solar signature in 400 years of reconstructed Northern Hemisphere temperature records. Geophysical Research Letters, 33, L17718. [54] Soon, W. (2005) Variable solar irradiance as a plausible agent for multi-decadal variations in the Arctic-wide sur- face air temperature record of the past 130 years. Geo- physical Research Letters, 32, L16712, 5. [55] Duhau, S. and de Jager, C. (2008) The solar dynamo and Its phase transitions during the last millennium. Solar Phys. 250, 1-15. [56] Kerr, R.A. (2009) What happened to global warming? Scientists say just wait a bit. Science, 326, 28-29. [57] University of Washington (2008). http://jisao.washington.edu/pdo/ [58] Pielke Sr., R.A. (2008) A broader view of the role of humans in the climate system. Physics Today, 11, 54-55. [59] Polyakov, I.V., Bekryaev, R.V., Alexseev, G.V., Bhatt, U., Colony, R.L., Johnson, M.A., Makshtas, A.P., and Walsh, D. (2003) Variability and trends of air temperature and pressure in the Maritime Arctic, 1875-2000. Journal of Climate, 16, 2067-2077. [60] IPCC (Intergovernmental Panel on Climate Change) (2007). http://www.ipcc.ch
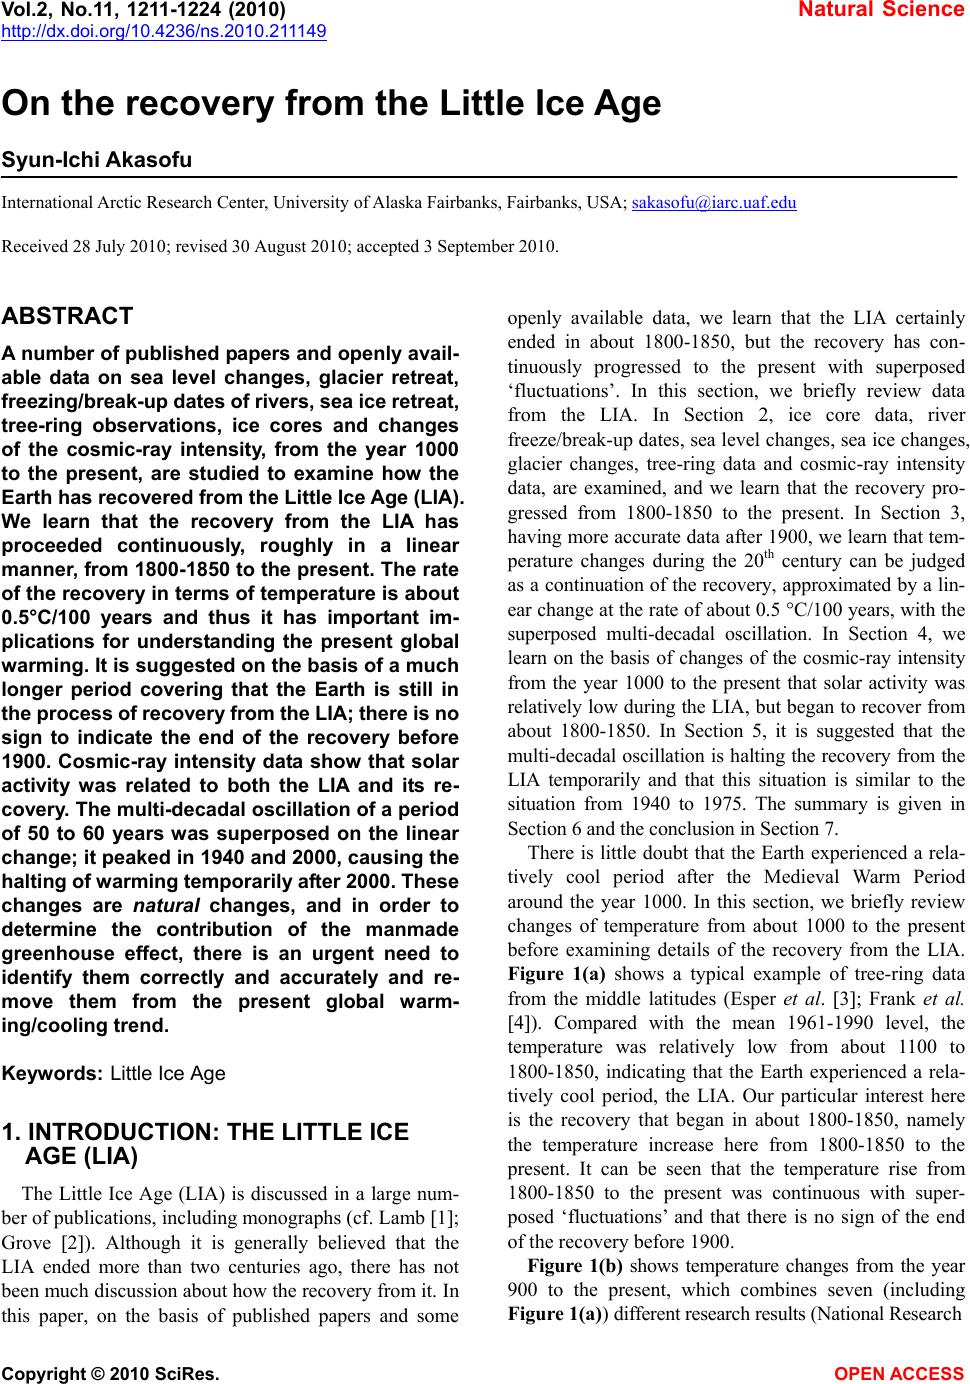
|