Applied Mathematics
Vol.3 No.10A(2012), Article ID:24110,9 pages DOI:10.4236/am.2012.330208
Dynamic Optimization of Bioprocesses
1Nexant Limited, 1 King’s Arms Yard, London, UK
2Centre for Process Systems Engineering, Department of Chemical Engineering, Imperial College London, South Kensington Campus, London, UK
Email: cleo.kontoravdi@imperial.ac.uk
Received July 10, 2012; revised August 10, 2012; accepted August 17, 2012
Keywords: Animal Cell Culture; Antibody Production; Dynamic Optimization
ABSTRACT
The Bioprocessing industry delivers high-value protein-based pharmaceutical products produced using microbial or animal cells. Animal cell culture, the only method currently available for the production of proteins with human-like post-translational modifications, is an expensive and labor-intensive process, as animal cells have complex nutrient requirements. Optimization studies have typically been limited to experimental studies, although there has recently been increased interest in combined experimental and computational approaches. In this work, we present the results of a dynamic optimization approach to improving animal cell bioprocesses. We have based this on a model validated over batch and fed-batch conditions and have examined four possible objective functions. Our results indicate that the maximization of the product concentration or the integral of viable cell concentration over time give equivalent results and can improve the product titer up to 70% over non-optimized fed-batch cultures.
1. Introduction
The Bioprocessing industry is responsible for the production of several hundred therapeutic agents and diagnostic tools of biological origin. In their majority, these products are high-value protein-based drugs, such as antibodies, growth factors, hormones, which are used in the treatment of diseases such as cancer, autoimmune disorders, severe anemia, as well as the prevention of transplant rejection. They represent the fastest growing field within the pharmaceutical sector with a growth rate of 6.5% in the USA. in 2010 and account for over $50 billion in sales [1].
Unlike the chemicals and petrochemicals industries, process optimization within the Bioprocessing industry remains empirical. This has two main disadvantages: first, it relies heavily on costly and time-consuming experimentation and sample analysis. Secondly, it does not formally consider interactions between operating parameters. Model-based approaches can provide a platform for system analysis and process optimization, based on the organization and interpretation of experimental measurements through their integration with fundamental biological knowledge expressed in mathematical terms. A prerequisite for such an exercise is a robust model structure and reliable parameter values.
Recent studies combining experimentation with mathematical modeling in cell culture systems have demonstrated the benefit of such an integrated approach.
Nolan and Lee [2] presented a new kinetic model of metabolism for a Chinese hamster ovary (CHO) cell line producing a recombinant monoclonal antibody and a novel framework for simulating the dynamics of metabolic and biosynthetic pathways of these cells grown in fed-batch culture. Their simulation results demonstrate that the model can accurately predict the effects of temperature shift, seeding density, and nutrient concentrations on cell and product concentrations. Similarly, Selvarasu et al. [3] complemented modelling with metabolomic analysis to gain a deeper insight into the metabolic behaviour and stress responses in CHO cells grown in fed-batch culture. This combined approach enabled them to identify major growth-limiting factors including the oxidative stress and depletion of lipid metabolites, therefore providing valuable information for process development.
In a previous study [4], we presented the development and validation of a model of antibody-producing mammalian cell cultures. The model and the underlying assumptions are presented Appendix A. Cell growth depends on the availability of two key nutrients, glucose and glutamine, and is inhibited by the accumulation of two toxic metabolites, lactate and ammonia. Cell death depends on the accumulation of ammonia due to glutamine metabolism and spontaneous degradation in the medium. The synthesis of IgG1 antibody product is described starting from the gene copy number, the synthesis of heavyand light-chain mRNA molecules, followed by their translation into heavy and light chains and the assembly of these to form the antibody molecule in the endoplasmic reticulum. The antibody is then transported to the Golgi apparatus before being secreted into the extracellular environment. This model was validated using the methodology outlined in Figure 1, as described in the next section.
In this work, we present the results of dynamic optimisation studies based on the aforementioned model. We have sought to evaluate the optimisation results for four objective functions of relevance to this system: the specific antibody production rate, qMAb, the extracellular antibody concentration, [MAb], the viable cell concentration, Xv, and the integral of viable cell concentration over time, IVCC. The latter gives an indication of the total number of viable cell hours, which are available for antibody production. The results are compared on the basis of typical cell culture performance indicators, including the final antibody concentration in the extracellular environment, the production of which is the ultimate goal of industrial bioprocesses.
2. Methodology
2.1. Experimental Materials and Methods
2.1.1. Cell Line Maintenance
Hybridoma cell line HFN7.1 expressing IgG1 against fibronectin from human plasma (CRL-1606, ATCC) was cultured in high-glucose DMEM (Gibco), which contains 29.1 mM glucose and 4.9 mM glutamine, supplemented with 2.5% bovine calf serum (ATCC). Batch cultures were carried out in triplicate flasks 1L Erlenmeyer flasks with a working volume of 200 mL and seeding density of 2 × 10⁸ cells/L, at 37˚C and 5% CO2. Fed-batch cultures were carried out in duplicate flasks 1 L Erlenmeyer flasks with a working volume of 200 mL and seeding density of 2 × 10⁸ cells/L. The initial formulation contained 25.1 mM glucose and 5.01 mM glutamine. The feed consisted of concentrated medium which was rich in glucose (500 mM) and glutamine (100 mM). The maximum total volume of feed was fixed at 8.75 mL, which represents less than 5% of the total culture volume (200 mL), so as to avoid dilution effects. The viable cell concentration was determined by the Trypan blue dye exclusion method using a Neubauer hemacytometer.
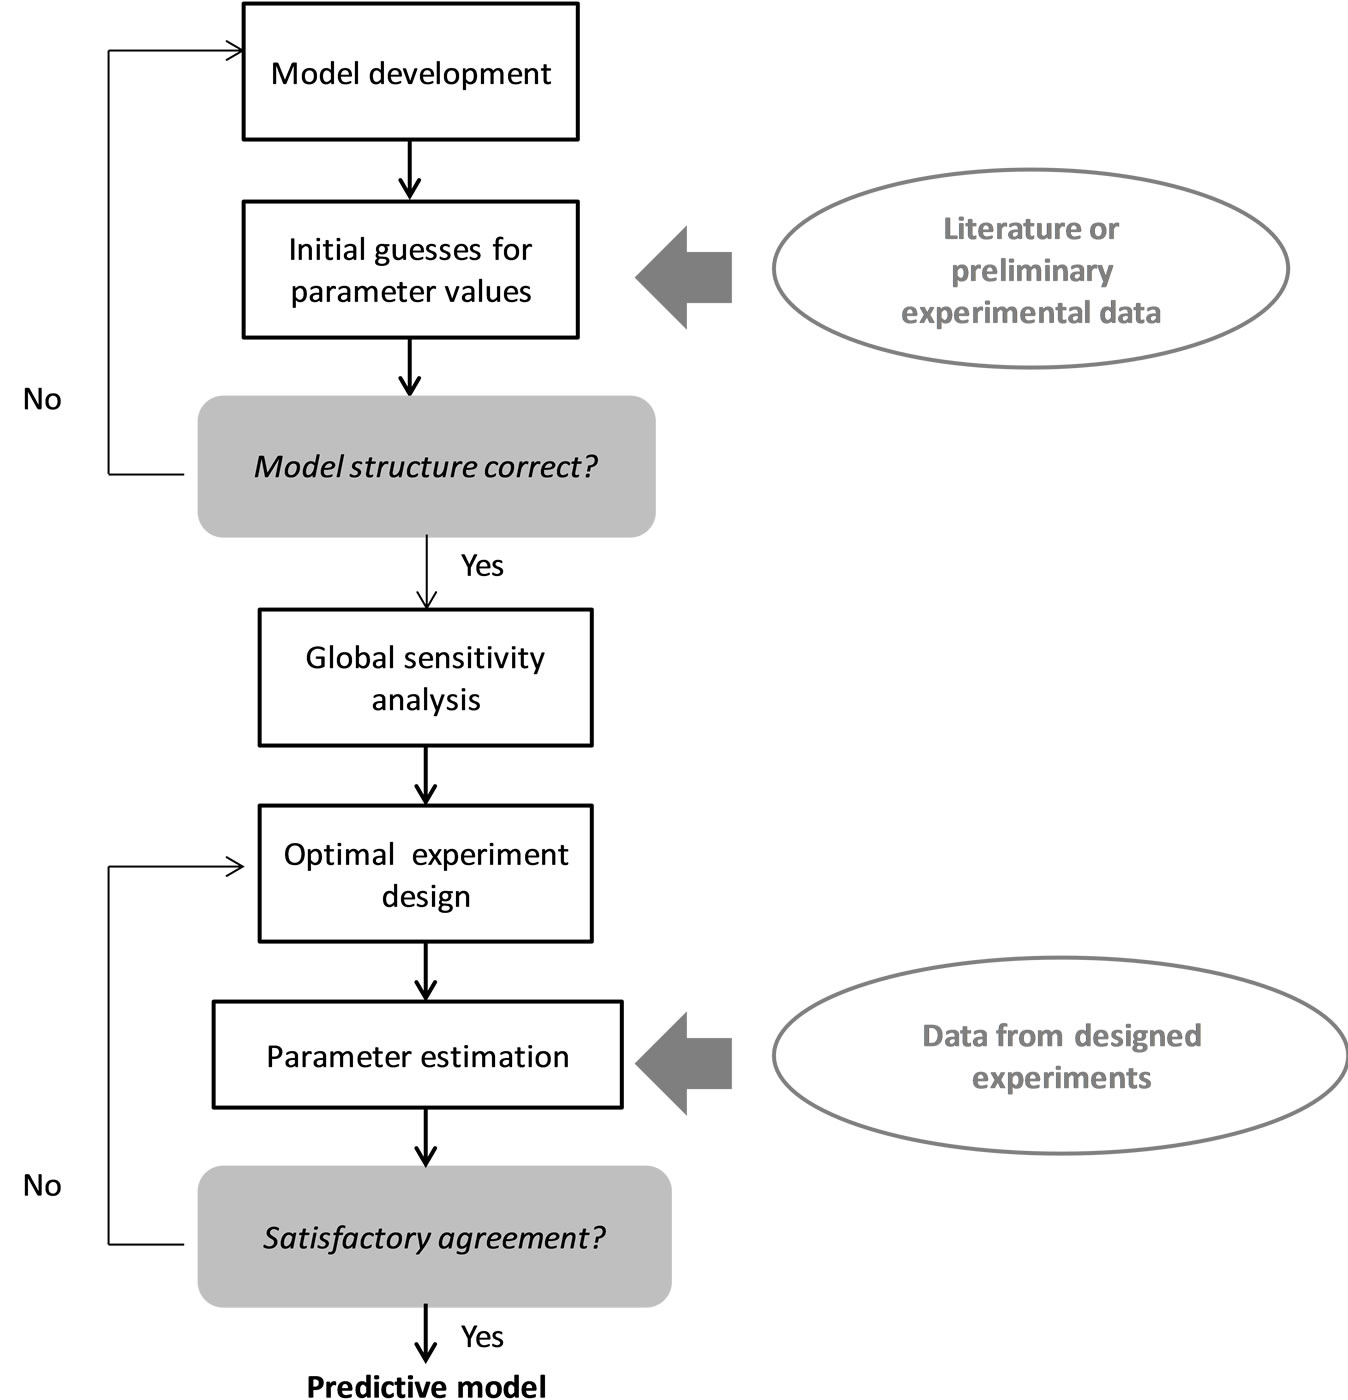
Figure 1. Model development and validation framework.
2.1.2. Assays
Samples of 1.5 mL were withdrawn from the cultures and centrifuged at 104 g for 5 minutes. The supernatant was removed and stored at −20˚C for further analysis. Extracellular glucose, glutamine, lactate and ammonia concentrations were determined using the YSI Bioprofiler 200 (Nova Biomedical, UK). Antibody concentration in the supernatant was determined by indirect sandwich enzyme-linked immunosorbent assay (ELISA). The coating buffer was 0.05 M sodium bicarbonate, pH 9.6 with 1 μg/mL anti-human fibronectin antibody from rabbit (Sigma) and the washing buffer was phosphate buffered saline with 0.05% Tween. Non-specific binding was blocked with coating buffer supplemented with cassein hammerstein (Sigma). The antigen was mouse anti-human fibronectin antibody (Sigma) diluted in PBS at a ratio of 1:5000 and the secondary antibody was antimouse Fc antibody from goat (supplied at a concentration of 6.4 mg/mL, Sigma) diluted in PBS at a ratio of 1:10,000. Visualisation of the reaction was achieved by addition of 3,3’,5,5’-tetramethylbenzene kit (TMB; Sigma-Aldrich T3405) as per the manufacturer’s instructions and the absorbance was read at 450 nm on a microplate reader (BioTek Instruments, Inc., USA).
2.2. Model Development and Validation Methodology
Model development followed the framework outlined in Figure 1 and described in detail in [4]. Specifically, once the initial mechanistic model was formulated based on knowledge about the underlying biological phenomena, the model structure was verified by comparison to literature or preliminary experimental data. This model structure is presented in Appendix A and consists of 28 differential and algebraic equations and 30 parameters. The experimental data also provided initial guesses for parameter values. Following this, the Sobol’ global sensitivity analysis method along with a one-at-a-time screening with respect to all other measured variables was employed to identify the model parameters to which the model output (antibody concentration in this case) was most sensitive, prompting the need for their accurate estimation from experimental data. The results helped narrow down the number of important parameters to just seven, namely the yield of cells on glucose (Yx,glc), the yield of cells on glutamine (Yx,gln), the yield of lactate on glucose (Ylac,glc), the yield of ammonia on glutamine (Yamm,gln), the rate of dead cell lysis (Klysis), the maximum specific cell growth rate (μmax), and the gene copy number of antibody heavy chains (NH).
The accurate estimation of these parameters was targeted through D-optimal experimental design, while the remaining parameters were set at their nominal values.
The D-optimal dynamic experiments were designed based on fed-batch culture operation (semi-continuous process), which also enabled us to extend the validity of the model. The design was conducted in the gPROMS modelling environment [5], which uses a SRQPD sequential quadratic programming code. The resulting experimental results were used for parameter estimation, which was again conducted using gPROMS based on the maximum likelihood formulation. This determines values for the uncertain physical and variance model parameters that maximise the probability that the model will predict the measurement values obtained from the experiments. The statistical model of constant variance was used in this case and the validation process was successful after one fed-batch experiment as the 95% confidence intervals were deemed satisfactory at ±10% of the final parameter values.
2.3. Model-Based Optimization Strategy
Our optimization studies were performed within the time horizon for which the model has been validated and for the same volume range. Specifically, the time horizon was allowed to vary between 96.5 h, which was the duration of the batch culture experiments, and 186.6 h, which was the duration of the fed-batch experiments. In order to avoid dilution effects, the maximum allowable inlet volume was limited to 20% of initial volume, i.e. 40 mL. This volume is achievable within the experimental set-up for which the model was validated, i.e. Erlenmeyer flasks. Extrapolating to a volume of 1 L and beyond was deemed to be outside the predictive range of the model, since such cell culture volume are handled in lab-scale bioreactors, in which the culture behavior can be significantly different. Finally, the inlet glucose and glutamine concentrations kept constant at 500 mM and 100 mM, respectively, as in the fed-batch experiments conducted for parameter estimation and model validation.
We chose to compare the results for four biologically-meaningful objective functions; the specific antibody production rate, qMAb, the extracellular antibody concentration, [MAb], the viable cell concentration, Xv, and the integral of viable cell concentration over time (IVCC). The dynamic optimisation studies were performed using the relevant entity in the gPROMS modelling environment [5], based on the SRQPD solver, which employs a sequential quadratic programming method for the solution of the nonlinear programming problem. In the formulation of the optimization problem, the control variable was the inlet flow rate, which was assumed to be piece-wise constant, since feeds are usually supplemented in bolus additions experimentally. The feed could be introduced every 13.7 h to 24 h at amounts varying between 0mL and 6.7 mL. All aforementioned objective functions were sought to be maximized independently.
3. Results and Discussion
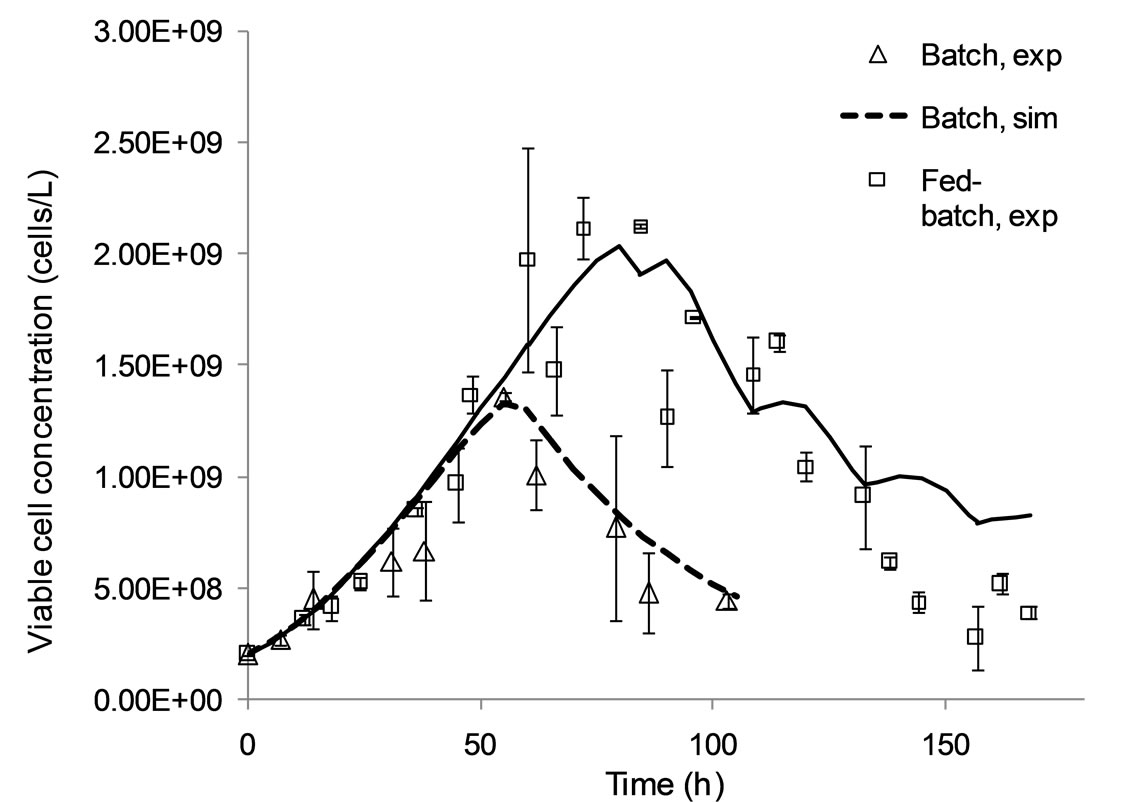
The model presented in Appendix A has been validated for batch and fed-batch cell culture operation as demonstrated in Figures 2 and 3, and its parameter values estimated as in Table 1. Specifically, Figure 2 compares model simulation results for the viable cell concentration and the extracellular antibody concentrations with experimental data. In batch mode, model predictions are in close alignment with the data. In fed-batch mode, the model closely tracks the data for viable cell concentration during the first 70 hours of the culture, i.e. during the lag and exponential growth phases (top), but under-predicts the peak in concentration. However, later predictions match the data and the IVCC is equivalent. Simulation results for antibody concentration are consistently in agreement with experimental data.
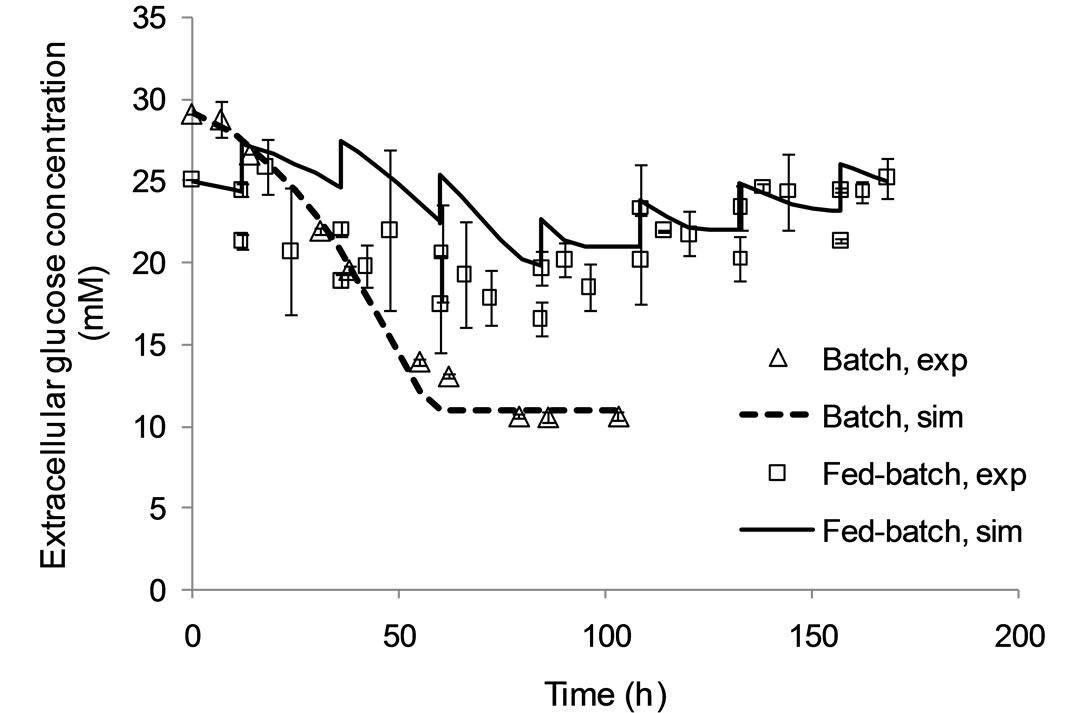
Figure 3 shows the agreement of model results with experimental data for glucose (top) and glutamine (bottom) concentrations in the extracellular environment. Reliable predictions for these variables is essential, as these nutrients are growth-limiting and their addition to the culture during fed-batch operation is a means for prolonging viability and enhancing antibody production.
As shown in this Figure, the model simulation results are in agreement with experimental data for both these variables. The proposed model is therefore suitable for optimisation studies.
Following the strategy outlined in the previous section, we performed dynamic optimization studies where we sought to optimize key performance indicators of cell culture processes. We examined four potential indicators as objective functions, the specific antibody production rate (qMAb), the extracellular antibody concentration
 (a)
(a)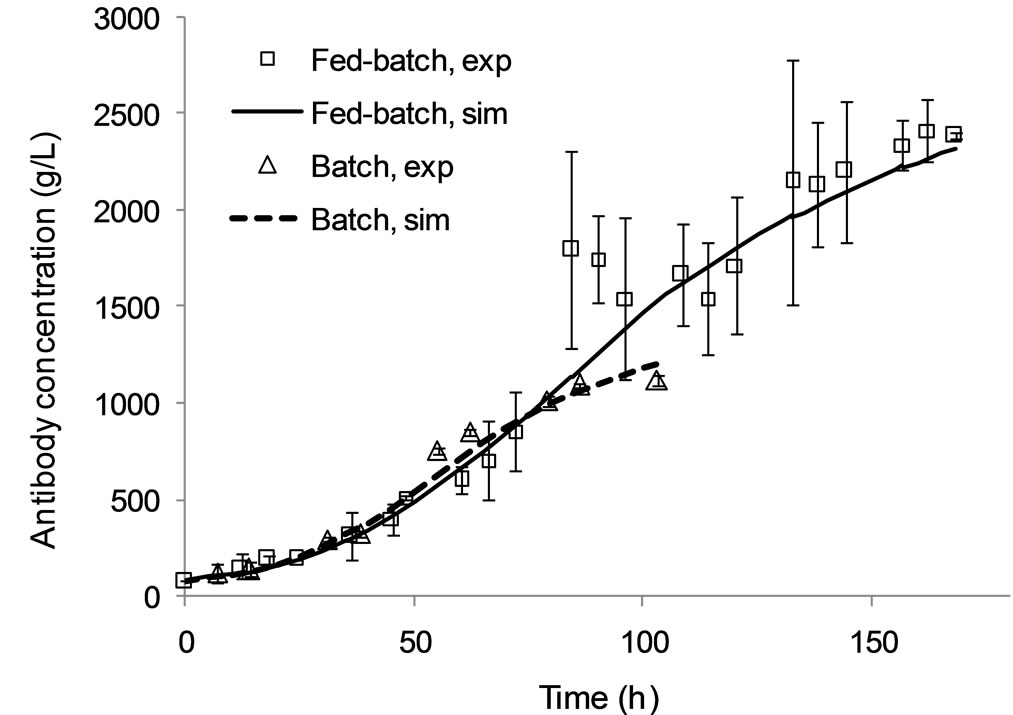 (b)
(b)
Figure 2. Model simulation results and experimental data for the viable cell (a) and extracellular antibody (b) concentrations under batch and fed-batch culture conditions.
 (a)
(a)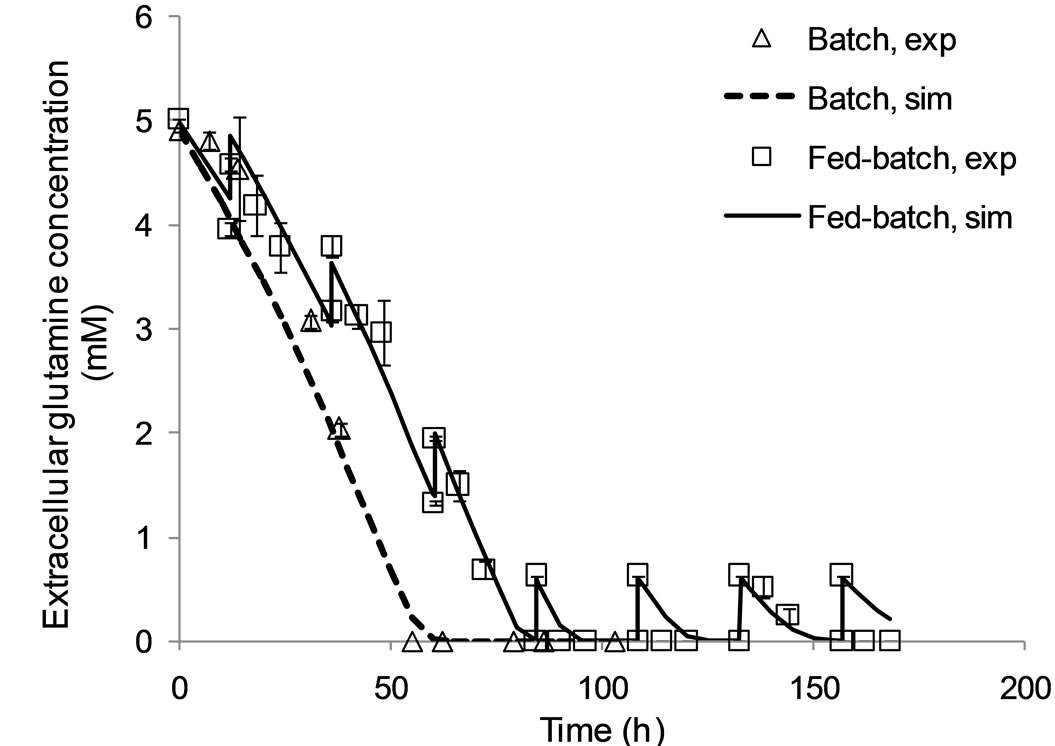 (b)
(b)
Figure 3. Model simulation results and experimental data for the extracellular glucose (a) and glutamine (b) concentrations under batch and fed-batch culture conditions.
([MAb]), the viable cell concentration (Xv), and the IVCC.
The results are shown in Table 2, where they are compared in terms of the final antibody titre, the IVCC, the maximum specific antibody production rate achieved, and operating parameters, namely the time horizon and the volume of feed added.
The time profile of the extracellular antibody concentration achieved under each optimal feeding schedule is presented in Figure 4. It can be seen that optimization of the viable cell concentration or the specific antibody production rate yields significantly lower IVCC values and product titers than the other two functions considered, although product titers are improved compared to the non-optimized fed-batch culture by 23% and 13%, respectively. The optimal time horizon for both sets of results is short, at 135 and 133 hours, respectively. Interestingly, the maximum specific antibody production rate is 6.28 × 10⁻⁹ mg/viable cell-h, which as shown in Table 2, is achieved for all objective functions and appears to be an inherent limitation of the cell line used in this study.
When comparing the results for optimising the IVCC and the antibody concentration, it can be seen that both are significantly higher than the values achieved in non-optimised conditions. The former objective function achieves an IVCC of 3.33 × 10¹¹ viable cell-h/L and a final antibody concentration of 3.975 g/L, while the latter yields an IVCC of 3.32 × 10¹¹ viable cell-h/L and 4 g/L of product. These two sets of results are within 10% of each other, a percentage which is within the limit of experimental error associated with the techniques used for their quantification. The two objective functions can therefore be considered to perform equivalently. When compared to the non-optimised fed-batch culture used for model validation, the antibody titre improvement
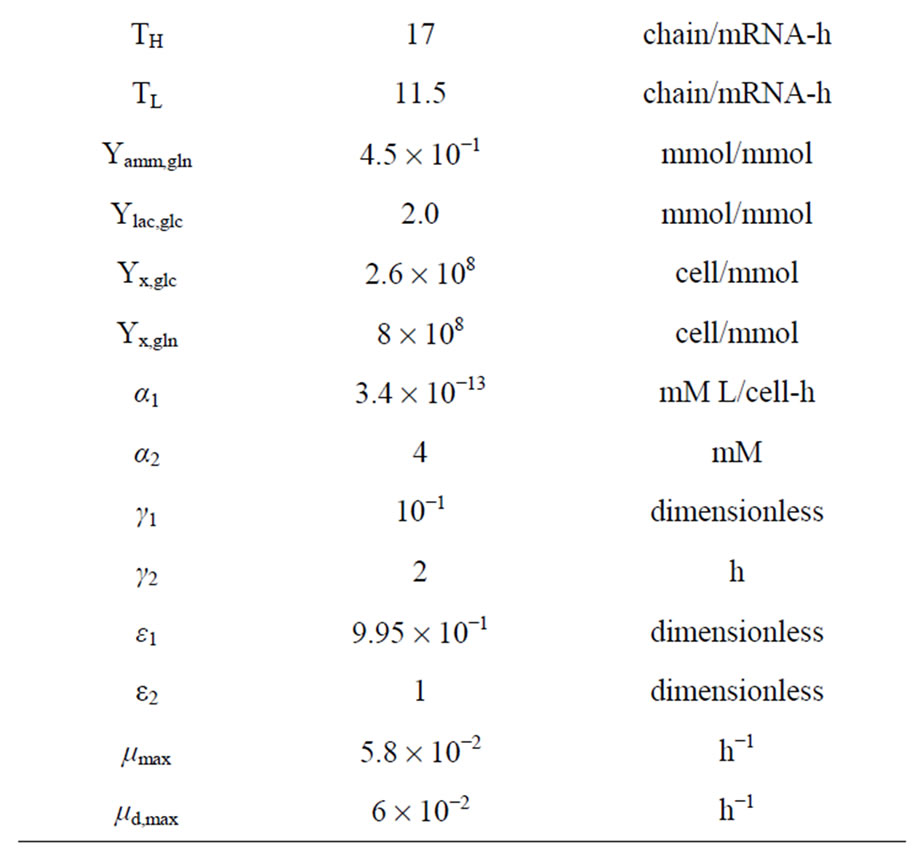
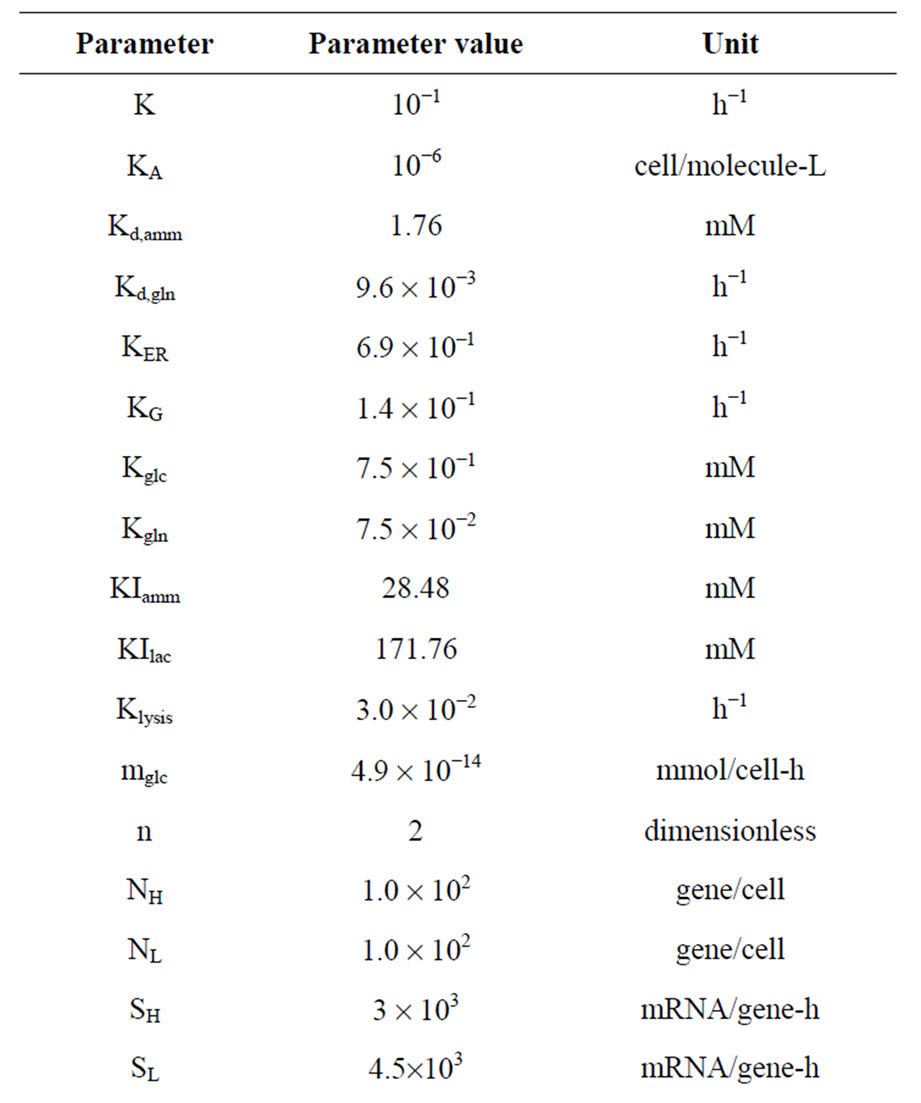
Table 1. Parameter values estimated for fed-batch culture operations.
reaches 70% within an equivalent time horizon (169 h). It is also interesting to note that although neither strategy used the full volume of feed available. This limits the accumulation of metabolites lactate and ammonia associated with the metabolism of the two key nutrients (glucose and glutamine, respectively), which would inhibit cell growth.
Overall, this study demonstrates the usefulness of using model-based tools for guiding experimentation. Our approach allows us to evaluate various operating conditions and optimisation strategies in silico, and refine our experimental plan. The model presented herein can be extended to describe other important process variables that can act as controls. Examples include cell culture temperature, which can enhance the protein productivity [2,6], culture pH, which can affect cell growth and viability [7], and medium osmolarity, which can influence specific antibody production rates [8].
4. Conclusion
A model-based dynamic optimization approach of fedbatch animal cell culture processes for the production of high-value antibody-based pharmaceuticals was presented. The results pinpoint the integral of viable cell concentration with time and the extracellular antibody concentration as being the most appropriate objective functions for optimizing cell culture performance with
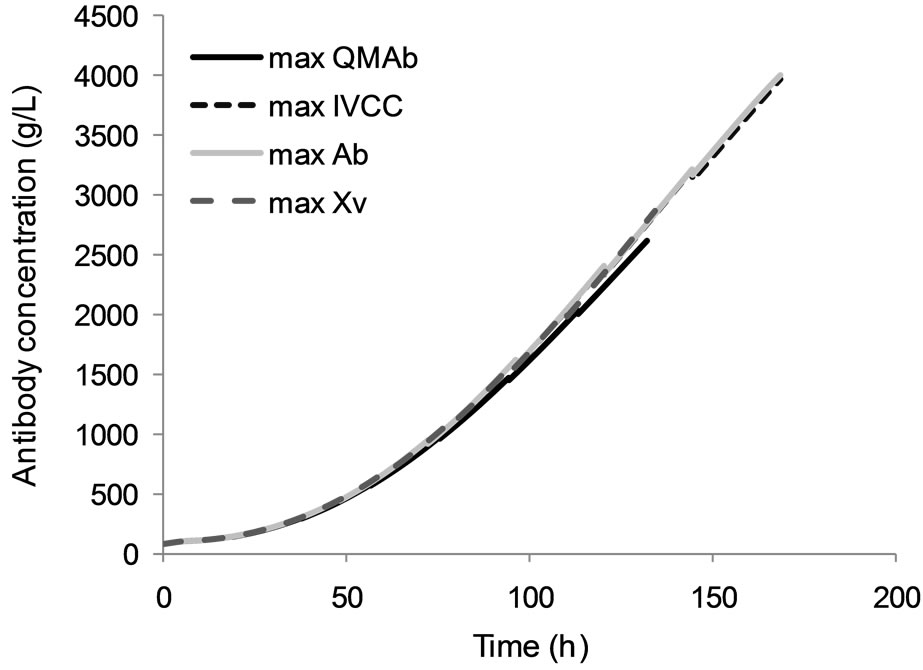
Figure 4. Optimal antibody concentration profile for each objective function.
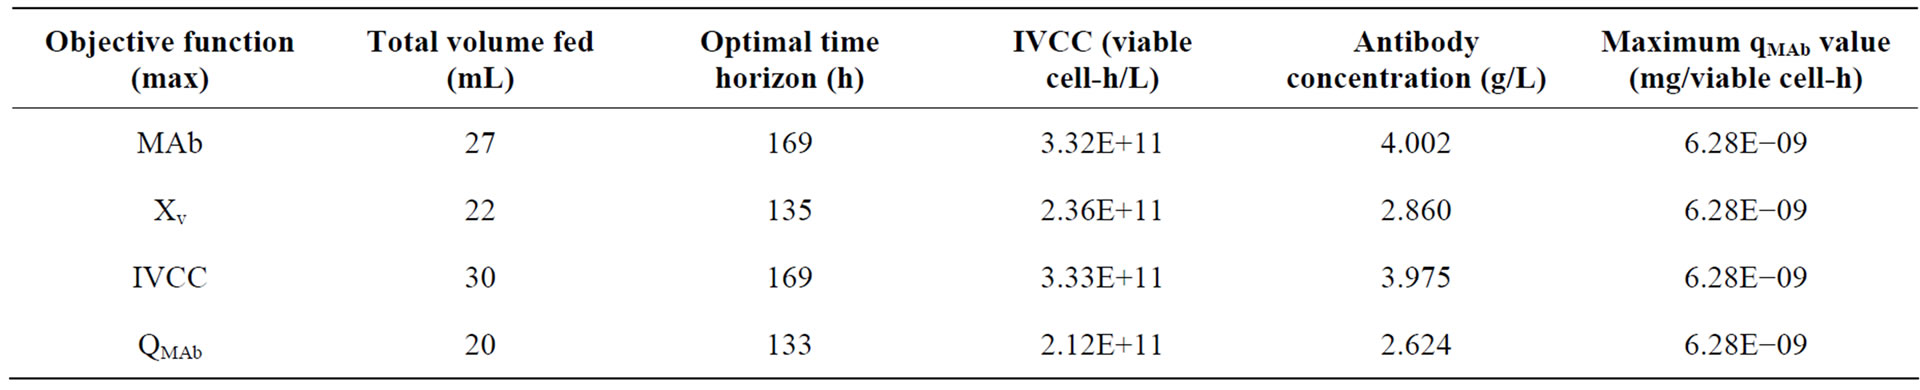
Table 2. Summary of optimisation results.
respect to several key indicators. Optimization results indicate that the final antibody titer can be improved by up to 70%, although this remains to be experimentally confirmed. These findings can help guide experimental work in this area by indicating most promising dynamic feeding profiles and thus avoiding unnecessary expenditure on trial-and-error experiments.
REFERENCES
- S. Aggarwal, “What’s Fueling the Biotech Engine— 2010-2011,” Nature Biotechnology, Vol. 29, No. 12, 2011, pp. 1083-1089. doi:10.1038/nbt.2060
- R. P. Nolan and K. Lee, “Dynamic Model of CHO Cell Metabolism,” Metabolic Engineering, Vol. 13, No. 1, 2011, pp. 108-124. doi:10.1016/j.ymben.2010.09.003
- S. Selvarasu, Y. S. Ho, W. P. K. Chong, N. S. C. Wong, F. N. K. Yusufi, Y. Y. Lee, M. G. S. Yap and D. Y. Lee, “Combined in Silico Modeling and Metabolomics Analysis to Characterize Fed-Batch CHO Cell Culture,” Biotechnology and Bioengineering, Vol. 109, No. 6, 2012, pp. 1415-1429. doi:10.1002/bit.24445
- C. Kontoravdi, E. N. Pistikopoulos and A. Mantalaris, “Systematic Development of Predictive Mathematical Models for Animal Cell Cultures,” Computers and Chemical Engineering, Vol. 34, No. 8, 2010, pp. 1192-1198. doi:10.1016/j.compchemeng.2010.03.012
- Process Systems Enterprise Ltd., “gPROMS Advanced User Guide,” Process Systems Enterprise Ltd., London, 2011, United Kingdom, http://www.psenterprise.com/
- S. L. Chong, D. G. Mou, S. H. Lim, A. Alib and B. T. Tey, “Enhancement of Monoclonal Antibody Productivity by Promoting Active Hypothermic Growth in Hybridoma Cells,” Journal of Chemical Technology and Biotechnology, Vol. 84, No. 11, 2009, pp. 1674-1680. doi:10.1002/jctb.2228
- S. J. Hwang, S. K. Yoon, G. Y. Koh and G. M. Lee, “Effects of Culture Temperature and pH on Flag-Tagged COMP Angiopoietin-1 (FCA1) Production from Recombinant CHO Cells: FCA1 Aggregation,” Applied Microbiology and Biotechnology, Vol. 91, No. 2, 2011, pp. 305-315. doi:10.1007/s00253-011-3266-7
- Y. Ho, J. Varley, A. Mantalaris, “Development and Analysis of a Mathematical Model for Antibody-Producing GS-NS0 Cells under Normal and Hyperosmotic Culture Conditions,” Biotechnology Progress, Vol. 22, No. 6, 2006, pp. 1560-1569.
Notation
[MAb]: extracellular antibody concentration (g/L)
[AMM]: extracellular ammonia concentration (mM)
Fin: inlet flow rate (L/h)
finh: cell growth rate inhibiting function
flim: cell growth
rate limiting functionFout: outlet flow rate (L/h)
[GLC]: extracellular glucose concentration (mM)
[GLC]in: glucose concentration in the feed (mM)
[GLN]: extracellular glutamine concentration (mM)
[GLN]in: glutamine concentration in the feed (mM)
[H]: free heavy chain concentration in the ER (chain/cell)
[H2], [H2L]: concentrations of assembly intermediates in the ER (molecule/cell)
[H2L2]ER: monoclonal antibody concentration in the ER (molecule/cell)
[H2L2]G: monoclonal antibody concentration in the Golgi apparatus (molecule/cell)
IVCC: integral viable cell concentration (viable cell-h/L)
K: heavyand light-chain mRNA decay rate (h−1)
KA: assembly rate constant (cell/molecule/h)
Kd,amm: ammonia constant for cell death (mM)
Kd,gln: constant for glutamine degradation (h−1)
KER: rate constant for ER-to-Golgi transport (h−1)
KG: rate constants for Golgi-to-medium antibody transport (h−1)
Kglc: Monod constant for glucose (mM)
Kgln: Monod constant for glutamine (mM)
KIamm: Monod constant for ammonia (mM)
KIlac: Monod constant for lactate (mM)
[LAC] : extracellular Lactate concentration (mM)
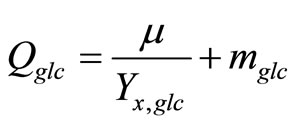
mglc: maintenance coefficient of glucose (mmol/cell/h)
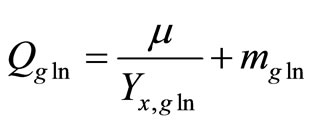
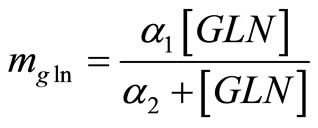
mgln: maintenance coefficient of glutamine (mmol/ cell/h)
mH, mL: intracellular heavyand light-chain mRNA
concentrations (mRNA/cell), respectively
NH, NL: heavyand light-chain gene copy number (gene/cell)
Qamm: specific ammonia production rate (mmol/cell-h)
Qglc: specific glucose uptake rate (mmol/cell-h)
Qgln: specific glutamine uptake rate (mmol/cell-h)
Qlac: specific lactate production rate (mmol/cell-h)
QMAb: specific monoclonal antibody production rate (mg/viable cell-h)
RH, RL: rates of heavyand light-chain consumption in assembly (chain/cell/h)
SH, SL: heavyand light-chain gene specific transcription rates (mRNA/gene/h)
TH, TL: heavyand light-chain specific translation rates (chain/mRNA/h)
V: culture volume (L)
Xv: viable cell concentration (cells/L)
Xt: total cell concentration (cells/L)
Yamm,gln: yield of ammonia from glutamine (mmol/ mmol)
Ylac,glc: yield of lactate from glucose (mmol/mmol)
Yx,glc: yield of cells on glucose (cell/mmol)
Yx,gln: yield of cells on glutamine (cell/mmol)
Greek letters a1, a2: constants of glutamine maintenance coefficient
(mM L/cell/h and mM, respectively)
g1: constant for antibody production (h)
g2: constant for antibody production (dimensionless)
e1: ER glycosylation efficiency factor (dimensionless)
e2: Golgi apparatus glycosylation efficiency factor (dimensionless)
m: specific cell growth rate (h−1)
md: specific cell death rate (h−1)
mdmax: maximum specific cell death rate (h−1)
mmax: maximum specific cell growth rate (h−1)
Appendix A: List of Model Equations from [4]
The total mass balance around the bioreactor envelope is:
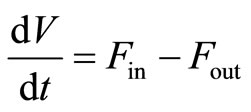 . (1)
. (1)
The mass balances on the viable and total cell populations, assuming perfect mixing and negligible dilution effect, are:
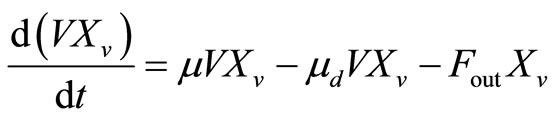 , (2)
, (2)
 . (3)
. (3)
The specific cell growth rate is limited by the concentration of nutrients glucose and glutamine, and inhibited by the accumulation of toxic metabolites lactate and ammonia. Assuming it follows Monod kinetics, the specific cell growth rate can be calculated by:
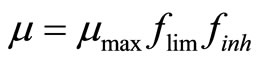 , (4)
, (4)
where
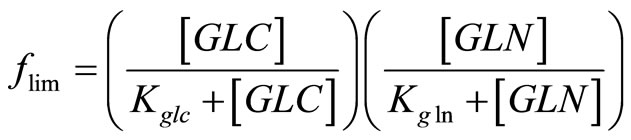 (5)
(5)
and
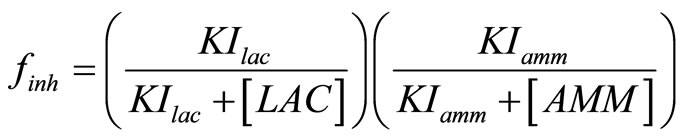 . (6)
. (6)
The specific cell death rate is assumed to depend on the accumulation of ammonia in the extracellular environment and is given by:
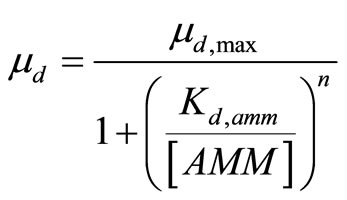 , (7)
, (7)
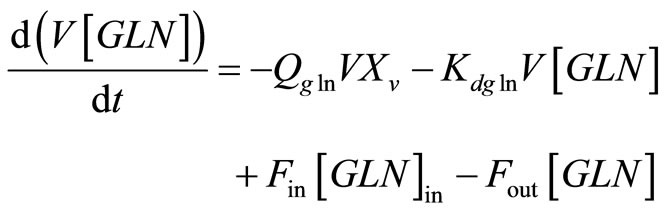
where n > 1. The mass balances on glucose and glutamine around the bioreactor are:
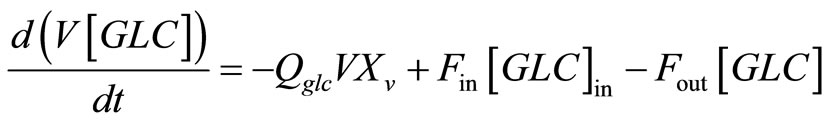 , (8)
, (8)
where
 , (9)
, (9)
and
 , (10)
where
 , (11)
 . (12)
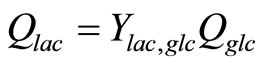
The mass balances for lactate and ammonia are:
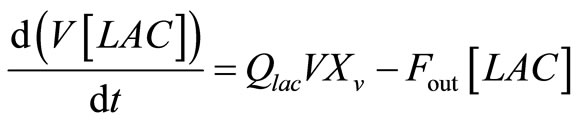 , (13)
where
 , (14)
and
 , (15)
where
 . (16)
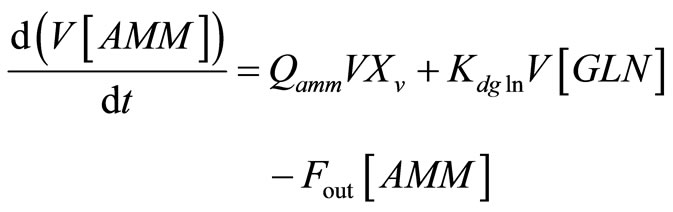
The mass balance of the heavyand light-chain mRNA in the endoplasmic reticulum are:
 , (17)
 . (18)
The intraER heavyand light-chain balances are:
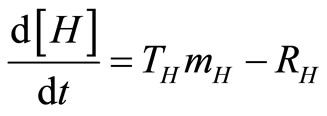 , (19)
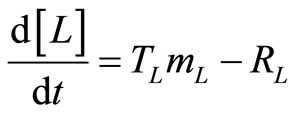 , (20)
where the rates of heavy and light chain assembly are:
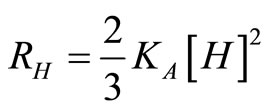 , (21)
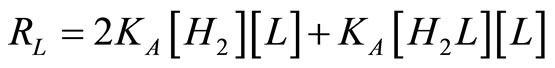 , (22)
And the balances on assembly intermediates are:
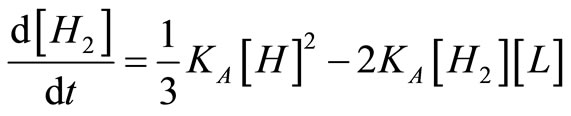 , (23)
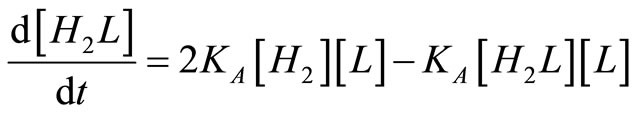 . (24)
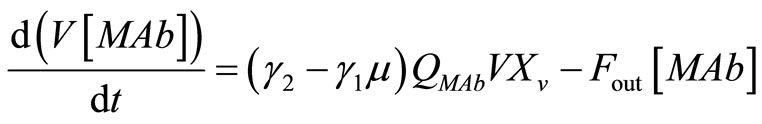
The antibody balance in the endoplasmic reticulum is:
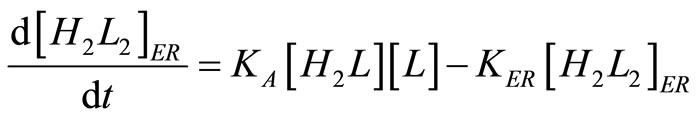 . (25)
Similarly, the antibody balance for the Golgi apparatus is:
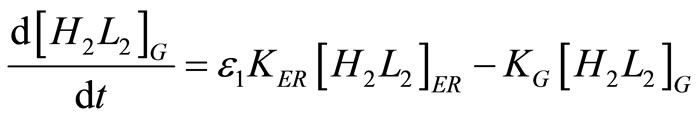 . (26)
Finally, the rate of antibody secretion is:
 , (27)
where
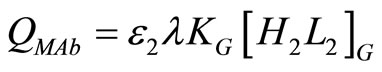 . (28)