Paper Menu >>
Journal Menu >>
 Chinese Studies 2013. Vol.2, No.2, 92-95 Published Online May 2013 in SciRes (http://www.scirp.org/journal/chnstd) http://dx.doi.org/10.4236/chnstd.2013.22014 Copyright © 2013 SciRes. 92 Factor Analysis of Satisfactory Degree on Improvement of Rural Latrines in Shanxi Province—A Perspective of Social Gender Zhou Xionghong, Shao Zirui, Liu Xue Department of Public Management, Tongji University, Shanghai, China Email: nianwei20@163.com Received December 7th, 2012; revised February 27th, 2013; accepted March 14th, 2013 Copyright © 2013 Zhou Xionghong et al. This is an open access article distributed under the Creative Commons Attribution License, which permits unrestricted use, distribution, and reproduction in any medium, provided the original work is properly cited. Through exploring the titled research topic and examining the influence of social gender, we suggest some adjustments to a project of toilet amelioration. The approach of factor analysis was used to analyze 448 rural villagers’ questionnaires collected in an investigation in Shanxi province. Most rural villagers are satisfied with the said project. Women’s satisfaction level with regard to the convenience and diseases control is lower than men’s. But their satisfaction with the objective factors of the toilet itself is higher than men’s. Policy-making should consider the needs of these two different groups. Keywords: Toilets Amelioration Project; Satisfactory Level; Factor Analysis Introduction Along with the development of the current rural toilet reform project, farmers’ (final beneficial group) evaluation of the re- form directly influences government’s support to the sanitation work of toilet reform and confirmation on the capability in the government. To ensure social gender equality, it is important to analyze levels of public satisfaction with sanitary toilet from the perspective of social gender and to discuss the difference between male and female rural citizens with regard to the dis- tribution of sanitary resource and phenomenon cognition. This paper reports on an investigation we carried out in northwest China to study public satisfaction with available sanitary facil- ity (sanitary toilet). A comparative analysis is conducted on different gender samples’ satisfaction with sanitary resource with its theoretical and practical implications evaluated. Theoretical Basis Social Gender The present paper comparatively analyzes men’s and women’s understanding of resource allocation the purpose is twofold, namely, to discuss social gender’s role in economic growth, poverty reduction, and efficiency development, and to explore how to accomplish gender fair. A study by World Bank in 2006 shows that the equality between men and women will quicken economic development, improve peoples’ physical and mental health, and to reduce poverty faster (Word Bank, 2006). Of all the eight United Nations Millennium Development Goals (MDGs), at least 7 are directly related with gender. Due to the long-term influence of gender discrimination, women, relative to men have fewer rights in decision-making when it comes to health resource allocation and health resource availability. Ac- cording to WHO’s 2000 annual “World Health Report”, China ranks 188th of all the world’s 191 members in the equity of financing for health systems (MeMichael, 1998). Joan, a theo- rist concentrate on feminism made the definition of social gen- der. It is said gender is a part of many social relationships, and it is a basic way to present the relationship of power. Social gender refers to four interrelated aspects including variety forms of culture symbols; normative concept for explaining the symbolic significance; political and Historical Construction of social organization (Scott, 1986). In short, social gender em- phasizes the social construction of gender. Culture and society make a difference in gender differentiation. This is a sociologi- cal term which often used to study the social phenomenon be- tween two gender groups. Based on the theory of social gender, this study investigates the degree of public satisfaction with the availability of health facilities (wash room) in undeveloped Northwest China. Gender samples’ degrees of satisfaction with the health resources are compared in the project. Basic Principle and Mathematical Model of Factor Analysis Factor Analysis method was first introduced by psycholo- gists. The method aims to explain human behavior and ability by extracting common factors to represent different characters and behavior orientations. Specifically, it examines internal depen- dencies of many variables are studied and, in so doing, explores basic structure of observation data. And there are some abstract variables that represent the basic data structure. These variables, known as “factors”, can reflect the main information of many variables (Fu Jianhua & Fan Jinli, 2008). This method also solves the multi-collinearity among variables without los- ing the main information. Factor analysis is briefly described as follows: Suppose there are n variables X1, X2,···, Xn, The observation results of n variables in p samples form one p × n order original matrix: 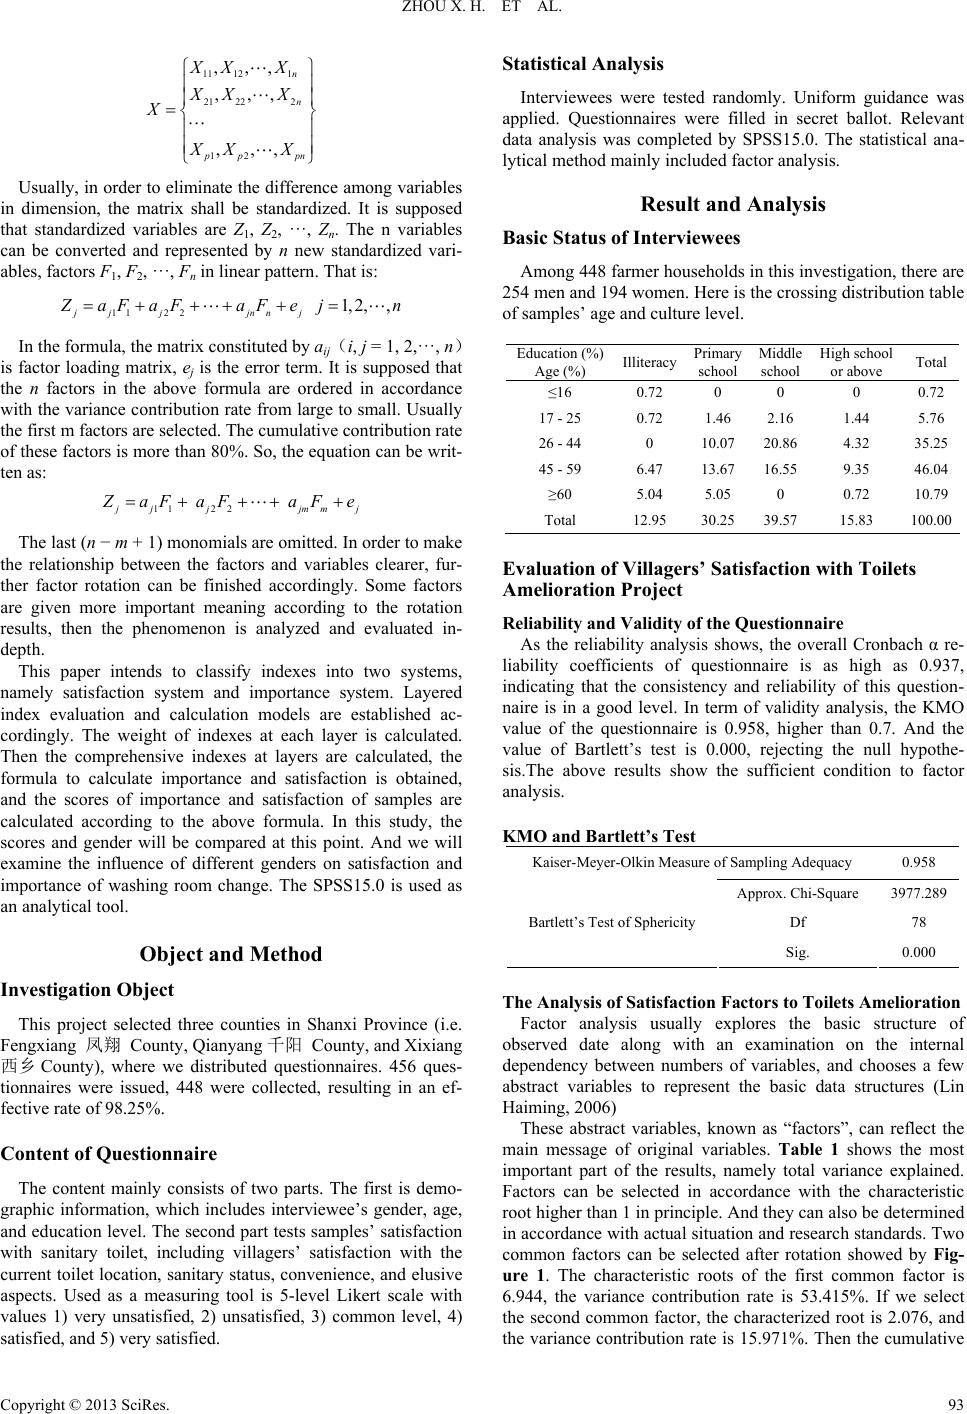 ZHOU X. H. ET AL. 11 121 21 222 12 ,,, ,,, ,,, n n pp pn XX X XX X X XX X Usually, in order to eliminate the difference among variables in dimension, the matrix shall be standardized. It is supposed that standardized variables are Z1, Z2, ···, Zn. The n variables can be converted and represented by n new standardized vari- ables, factors F1, F2, ···, Fn in linear pattern. That is: 112 2 1,2,, jj jjnnj Z aF aFaFe jn In the formula, the matrix constituted by aij(i, j = 1, 2,···, n) is factor loading matrix, ej is the error term. It is supposed that the n factors in the above formula are ordered in accordance with the variance contribution rate from large to small. Usually the first m factors are selected. The cumulative contribution rate of these factors is more than 80%. So, the equation can be writ- ten as: 112 2 j jj jmmj Z aFaFaFe The last (n − m + 1) monomials are omitted. In order to make the relationship between the factors and variables clearer, fur- ther factor rotation can be finished accordingly. Some factors are given more important meaning according to the rotation results, then the phenomenon is analyzed and evaluated in- depth. This paper intends to classify indexes into two systems, namely satisfaction system and importance system. Layered index evaluation and calculation models are established ac- cordingly. The weight of indexes at each layer is calculated. Then the comprehensive indexes at layers are calculated, the formula to calculate importance and satisfaction is obtained, and the scores of importance and satisfaction of samples are calculated according to the above formula. In this study, the scores and gender will be compared at this point. And we will examine the influence of different genders on satisfaction and importance of washing room change. The SPSS15.0 is used as an analytical tool. Object and Method Investigation Object This project selected three counties in Shanxi Province (i.e. Fengxiang 凤翔 County, Qianyang千阳 County, and Xixiang 西乡 County), where we distributed questionnaires. 456 ques- tionnaires were issued, 448 were collected, resulting in an ef- fective rate of 98.25%. Content of Questionnaire The content mainly consists of two parts. The first is demo- graphic information, which includes interviewee’s gender, age, and education level. The second part tests samples’ satisfaction with sanitary toilet, including villagers’ satisfaction with the current toilet location, sanitary status, convenience, and elusive aspects. Used as a measuring tool is 5-level Likert scale with values 1) very unsatisfied, 2) unsatisfied, 3) common level, 4) satisfied, and 5) very satisfied. Statistical Analysis Interviewees were tested randomly. Uniform guidance was applied. Questionnaires were filled in secret ballot. Relevant data analysis was completed by SPSS15.0. The statistical ana- lytical method mainly included factor analysis. Result and Analysis Basic Status of Interviewees Among 448 farmer households in this investigation, there are 254 men and 194 women. Here is the crossing distribution table of samples’ age and culture level. Education (%) Age (%) Illiteracy Primary school Middle school High school or above Total ≤16 0.72 0 0 0 0.72 17 - 25 0.72 1.46 2.16 1.44 5.76 26 - 44 0 10.07 20.86 4.32 35.25 45 - 59 6.47 13.67 16.55 9.35 46.04 ≥60 5.04 5.05 0 0.72 10.79 Total 12.95 30.25 39.57 15.83 100.00 Evaluation of Villag ers’ Satisfactio n wit h Toilet s Amelioration Project Reliability and Validity of the Questionnaire As the reliability analysis shows, the overall Cronbach α re- liability coefficients of questionnaire is as high as 0.937, indicating that the consistency and reliability of this question- naire is in a good level. In term of validity analysis, the KMO value of the questionnaire is 0.958, higher than 0.7. And the value of Bartlett’s test is 0.000, rejecting the null hypothe- sis.The above results show the sufficient condition to factor analysis. KMO and Bartlett’s Test Kaiser-Meyer-Olkin Measure of Sampling Adequacy 0.958 Approx. Chi-Square 3977.289 Df 78 Bartlett’s Test of Sphericity Sig. 0.000 The Analysis of Satisfaction Factors to Toilets Amelioration Factor analysis usually explores the basic structure of observed date along with an examination on the internal dependency between numbers of variables, and chooses a few abstract variables to represent the basic data structures (Lin Haiming, 2006) These abstract variables, known as “factors”, can reflect the main message of original variables. Table 1 shows the most important part of the results, namely total variance explained. Factors can be selected in accordance with the characteristic root higher than 1 in principle. And they can also be determined in accordance with actual situation and research standards. Two common factors can be selected after rotation showed by Fig- ure 1. The characteristic roots of the first common factor is 6.944, the variance contribution rate is 53.415%. If we select the second common factor, the characterized root is 2.076, and he variance contribution rate is 15.971%. Then the cumulative t Copyright © 2013 SciRes. 93  ZHOU X. H. ET AL. Copyright © 2013 SciRes. 94 Table 1. Total variance explained. Component Initial Eigenvalues Rotation Sums of Squared Loadings Total % of Variance Cumulative % Total % of Variance Cumulative % 1 8.158 62.757 62.757 6.944 53.415 53.415 2 0.862 6.629 69.386 2.076 15.971 69.386 3 0.667 5.132 74.518 4 0.625 4.806 79.324 5 0.421 3.239 82.563 6 0.411 3.158 85.722 7 0.337 2.593 88.315 8 0.333 2.560 90.875 9 0.295 2.270 93.146 10 0.278 2.141 95.286 11 0.232 1.783 97.069 12 0.205 1.575 98.645 13 0.176 1.355 100.000 Table 2. Component matrix. 2.70% 16.50% 53.30% 26% 1.60% 0-1011-20 21-30 31-40大于40 >40 Component 1 2 1. Odor and mosquitoes (X1) 0.6520.416 2. The secretiveness of latrine (X2) 0.6340.494 3. The shorter distance between toilet and house (X3) 0.6490.483 4. The convenience of guests to use the toilet (X4) 0.7570.373 5. The hygiene condition of latrine (X5) 0.7470.365 6. The prophylaxis of diseases (X6) 0.7480.273 7. The odor around the house (X7) 0.6930.310 8. The convenience of children to use the toilet (X8) 0.8100.217 9. The convenience to use the toilet at night (X9) 0.8580.209 10. The convenience to use the toilet at night on rainy day (X10) 0.840 0.198 11. Toilet cleaning convenience (X11) 0.8240.133 12. The convenience for aged people to use the toilet (X12) 0.860 0.139 13. The location for toilet (X13) 0.1070.903 Figure 1. The distribution of satisfaction degree. variance contribution rate is 69.386%. In order to explain the variables, this article intends to select two common factors. In order to facilitate the interpretation and analysis of princi- pal component to the practical problems, we need to rotate the factor loading matrix with data analysis, and thereby reflect the load of influence factors on each factor and the meaning of different factor represented. The results of maximizing devia- tions orthogonal rotation of factor loading matrix are shown in Table 2. The two factors can be explained significantly by the following indicators: Factor 1 by the index 5-7, 9-13, which belong to the evaluation factors of convenience and the pro- phylaxis of diseases; and Factor 2 by thes index 1-4 and 8, which belong to the evaluation factors of the objective condi- tion of the toilets. examined comprehensive scores in order to get the compre- hendsive evaluation of the farmers’ satisfaction with the sani- tary latrines. The calculation formula for common factors can be drawn by factor loading matrix: 1123 567 8910 11 1213 0.107 0.6520.6340.649 0.757 0.747 0.748 0.693 0.8100.858 0.840 0.8240.860 FXX X XXX XXX XXX 4 X (1) The Overall Evaluation of the Farmer’s Satisfaction Considering the different impact of each factor on satisfac- tion, we determined weights of various indicators, and then  ZHOU X. H. ET AL. 2123 567 8910 11 1213 0.903 0.4160.4940.483 0.373 0.365 0.273 0.310 0.217 0.209 0.1980.1330.139 FXXX XXX XXX XX X 4 X (2) Let us choose the proportion of each factor’s variance con- tribution in the total variance of two factors as weights, then sum weighted. 12 53.415 15.97169.386FFF (3) The comprehensive score of each sample’s satisfaction have been got according to the simultaneous Equations (1)-(3). The highest score is 40.53, the lowest score is 0.29. The satisfaction scores are divided into five intervals: 0 - 10, 11 - 20, 21 - 30, 31 - 40, over 40. As shown in the graph above, satisfaction scores is mainly between 21 and 40. The proportion of the scores more than 40 is only 1.6%, and the proportion of the scores less than 10 is only 2.7%. Therefore, the distribution of lavatories satisfaction in Shaanxi Province presents a normal distribution and high scores offset trend. The total satisfaction degree is relatively high. Analysis of Gender Dimension of Farmers’ Satisfaction Based on the overall satisfaction scores, gender characteris- tics are analyzed. The impact of gender on satisfaction, as the results show, is statistically significant ( = 22.178, p = 0.086). In order to compare the difference and relation among villagers of different sexes, cross analysis is conducted to study the satisfaction intervals and gender. The results show that the degree of male satisfaction is more than 30, accounting for 26.77%, while that of female satisfaction is 28.09%, about 2 percentage more than males’. After the toilets amelioration project, the female satisfaction was slightly higher than males’. At the same time, 2 χ female satisfaction with convenience and the prophylaxis of diseases is lower than its male counterpart, but higher than male satisfaction with the objective factors of the toilet itself. Therefore, women can be said to be more con- cerned about the influence of toilet improvement on indirect factors, such as living condition and convenience, while men more concerned about the influence of toilet objective condi- tion. Conclusion The Comprehensive Evaluation of Villagers’ Satisfaction with Toilets Amelioration According to the above analysis, comprehensive scores of villagers’ satisfaction with toilets amelioration are mainly be- tween 21 and 40, which present a normal distribution. In addi- tion, the total scores tend to be relatively high; indicating that toilet reform basically reached the required effect. Toilet reform promoted villagers’ sanitation with the improved cognition. Meanwhile, villagers’ demand and satisfaction are directed more to toilet convenience than to all other factors in the re- form. Evaluation on Gender Influencing Factors for Toilet Reform Satisfacti on Observed in the comprehensive scoring evaluation on satis- fac- tion factor analysis are higher scores among women in both aspects than among men. This indicates that women and men, due to their gender difference, perceive the sanitation im- provement differently. One explanation could be that previ- ously, due to the physiological conditions of the toilet, women who used the toilet were vulnerable to invasion and severe sanitation problems. By that we mean women’s privacy was invaded; and women were more prone to fall victim to intes- tines problem than men. That is why, after the improvement of the environment, the improved sanitary conditions were sig- nificantly better received among women than among men. Specifically, among men, a higher degree of satisfaction with the objective conditions of toilet is observed. In addition, women show higher satisfaction with indirect advantages of toilet reform (including disease reduction) and stronger under- standing of the importance of the reform than men. This could mean that during the process of toilet reform, men and women paid attention to different aspects. Whereas men paid more attention to visual and direct changes caused by the reform, women paid more attention to indirect advantage and im- provement in their feelings what this confirms to us is that dur- ing a reform like this one, we should take into consideration of the demand of both gender groups when we do specific works (Zhou Xianghong & Zhou Tingting, 2008). REFERENCES Fu Jianhua 符建华, & Fan Jinli 樊晋利 (2008). Yinzi fenxi fangfa zai guke manyidu ceping zhong de yingyong 因子分析方法在顾客满 意度测评中的应用. Beifang Jingmao, 10, 65-66. Lin Haiming 林海明 (2006). Yinzi fenxi jingque moxing de jiben sixiang yu fangfa 因子分析精确模型的基本思想与方法. Tongji Yu Xinxi Luntan, 21, 23-25. MeMichael, A. J. (1998). The role of epidemiologists in eradication of poverty? Lancet, 352, 810-812. Scott, J. W. (1986). Gender: A useful category of historical analysis. The American Historical Review, 91, 1053. World Bank (2006). Gender equality as smart economics: A World Bank Group gender action plan. Zhou Xianghong周向红, & Zhou Tingting周婷婷 (2008). Huanjing weisheng gaishan zhang’ai ji duice yanjiu环境卫生改善障碍及对 策研究. Zhongguo Nongcun Weisheng, 12, 34-36 Copyright © 2013 SciRes. 95 |