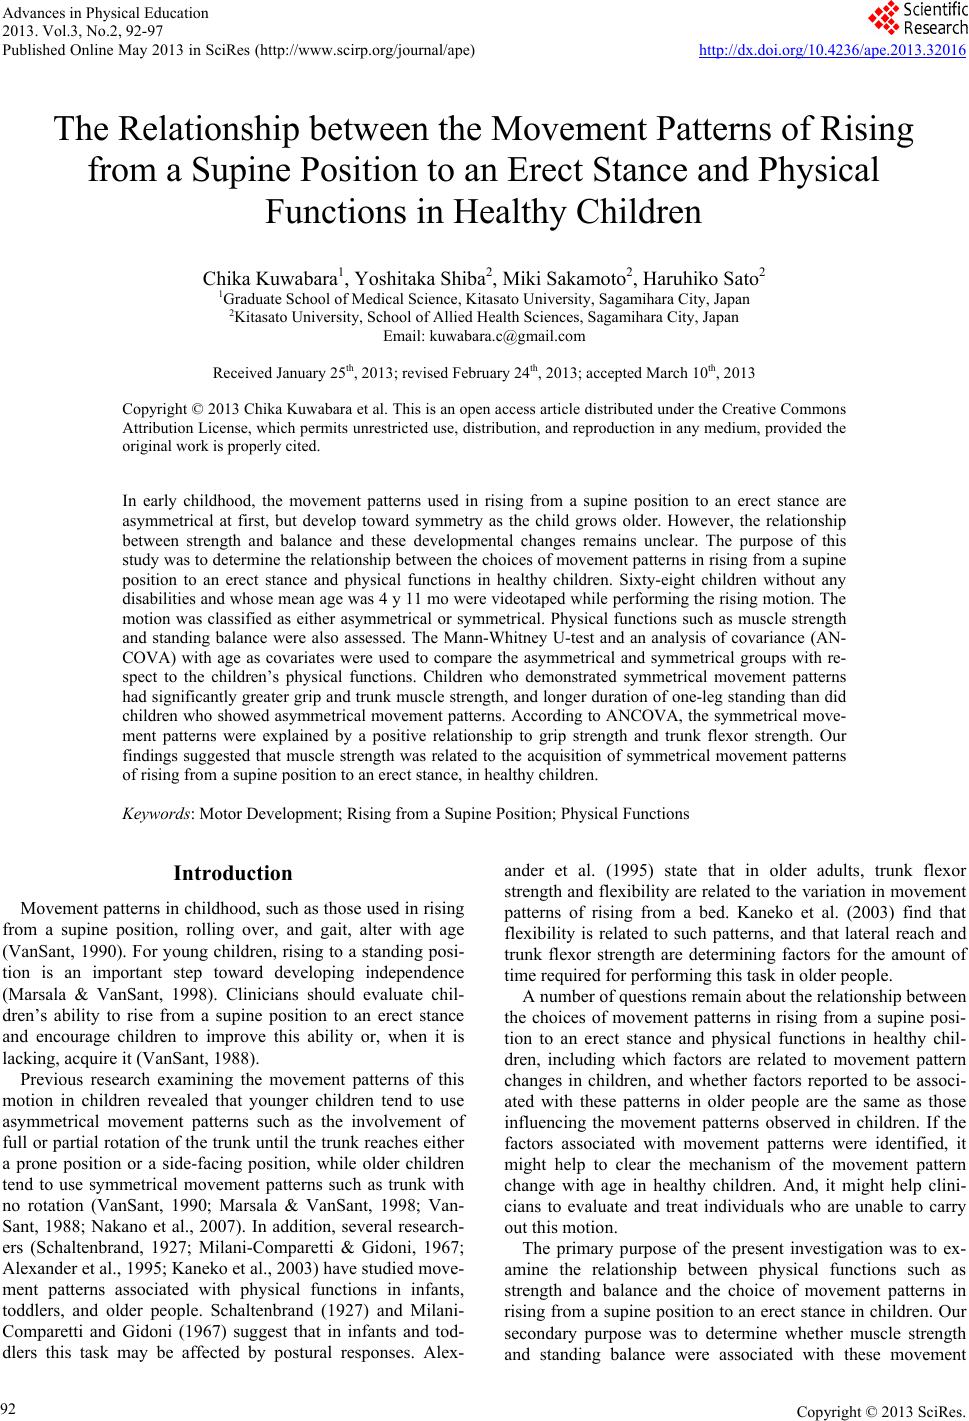
 Advances in Physical Education 2013. Vol.3, No.2, 92-97 Published Online May 2013 in SciRes (http://www.scirp.org/journal/ape) http://dx.doi.org/10.4236/ape.2013.32016 Copyright © 2013 SciRes. 92 The Relationship between the Movement Patterns of Rising from a Supine Position to an Erect Stance and Physical Functions in Healthy Children Chika Kuwabara1, Yoshitaka Shiba2, Miki Sakamoto2, Haruhiko Sato2 1Graduate School of Medical Science, Kitasato University, Sagamiha r a City , Japan 2Kitasato University, School of Allied Health Sciences, Sagamihara City, Japan Email: kuwabara.c@gmail.com Received January 25th, 2013; revised Febr uary 24th, 2013; accepted March 10th, 2013 Copyright © 2013 Chika Kuwabara et al. This is an open access article distributed under the Creative Commons Attribution License, which permits unrestricted use, distribution, and reproduction in any medium, provided the original work is properly cited. In early childhood, the movement patterns used in rising from a supine position to an erect stance are asymmetrical at first, but develop toward symmetry as the child grows older. However, the relationship between strength and balance and these developmental changes remains unclear. The purpose of this study was to determine the relationship between the choices of movement patterns in rising from a supine position to an erect stance and physical functions in healthy children. Sixty-eight children without any disabilities and whose mean age was 4 y 11 mo were videotaped while performing the rising motion. The motion was classified as either asymmetrical or symmetrical. Physical functions such as muscle strength and standing balance were also assessed. The Mann-Whitney U-test and an analysis of covariance (AN- COVA) with age as covariates were used to compare the asymmetrical and symmetrical groups with re- spect to the children’s physical functions. Children who demonstrated symmetrical movement patterns had significantly greater grip and trunk muscle strength, and longer duration of one-leg standing than did children who showed asymmetrical movement patterns. According to A NCOVA, the symmetrical move- ment patterns were explained by a positive relationship to grip strength and trunk flexor strength. Our findings suggested that muscle strength was related to the acquisition of symmetrical movement patterns of rising from a supine position to an erect stance, in healthy children. Keywords: Motor Development; Rising from a Supine Position; Physical Functions Introduction Movement patterns in childhood, such as those used in rising from a supine position, rolling over, and gait, alter with age (VanSant, 1990). For young children, rising to a standing posi- tion is an important step toward developing independence (Marsala & VanSant, 1998). Clinicians should evaluate chil- dren’s ability to rise from a supine position to an erect stance and encourage children to improve this ability or, when it is lacking, acquire it (VanSant, 1988). Previous research examining the movement patterns of this motion in children revealed that younger children tend to use asymmetrical movement patterns such as the involvement of full or partial rotation of the trunk until the trunk reaches either a prone position or a side-facing position, while older children tend to use symmetrical movement patterns such as trunk with no rotation (VanSant, 1990; Marsala & VanSant, 1998; Van- Sant, 1988; Nakano et al., 2007). In addition, several research- ers (Schaltenbrand, 1927; Milani-Comparetti & Gidoni, 1967; Alexander et al., 1995; Kaneko et al., 2003) have studied move- ment patterns associated with physical functions in infants, toddlers, and older people. Schaltenbrand (1927) and Milani- Comparetti and Gidoni (1967) suggest that in infants and tod- dlers this task may be affected by postural responses. Alex- ander et al. (1995) state that in older adults, trunk flexor strength and flexibility are related to the variation in movement patterns of rising from a bed. Kaneko et al. (2003) find that flexibility is related to such patterns, and that lateral reach and trunk flexor strength are determining factors for the amount of time required for performing this task in older people. A number of questions remain about the relationship between the choices of movement patterns in rising from a supine posi- tion to an erect stance and physical functions in healthy chil- dren, including which factors are related to movement pattern changes in children, and whether factors reported to be associ- ated with these patterns in older people are the same as those influencing the movement patterns observed in children. If the factors associated with movement patterns were identified, it might help to clear the mechanism of the movement pattern change with age in healthy children. And, it might help clini- cians to evaluate and treat individuals who are unable to carry out this motion. The primary purpose of the present investigation was to ex- amine the relationship between physical functions such as strength and balance and the choice of movement patterns in rising from a supine position to an erect stance in children. Our secondary purpose was to determine whether muscle strength and standing balance were associated with these movement 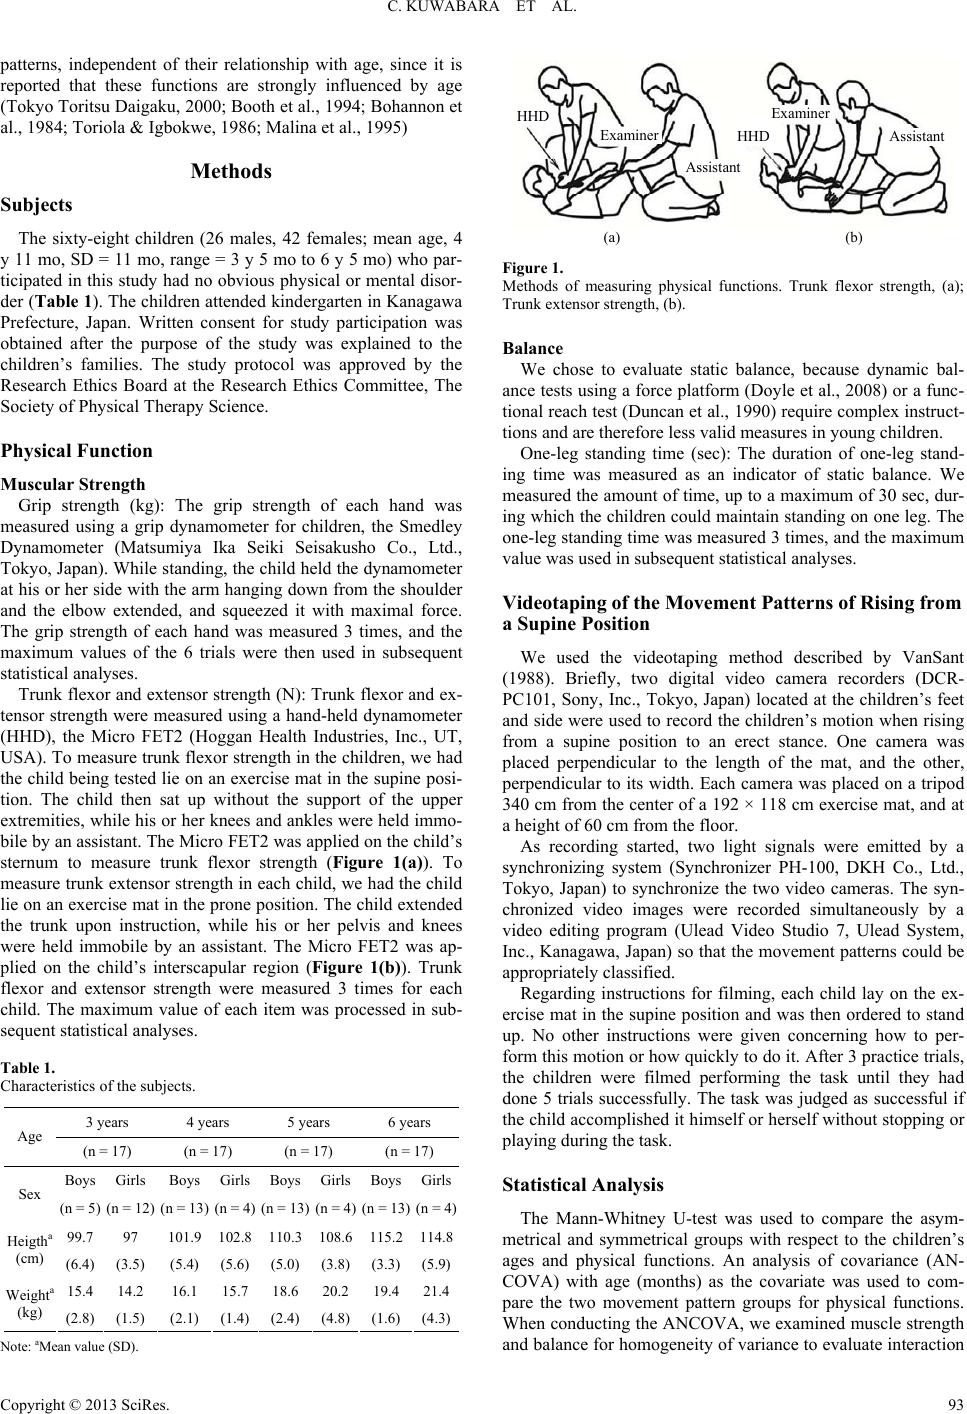 C. KUWABARA ET AL. patterns, independent of their relationship with age, since it is reported that these functions are strongly influenced by age (Tokyo Toritsu Daigaku, 2000; Booth et al., 1994; Bohannon et al., 1984; Toriola & Igbokwe, 1986; Malina et al., 1995) Methods Subjects The sixty-eight children (26 males, 42 females; mean age, 4 y 11 mo, SD = 11 mo, range = 3 y 5 mo to 6 y 5 mo) who par- ticipated in this study had no obvious physical or mental disor- der (Table 1). The children attended kindergarten in Kanagawa Prefecture, Japan. Written consent for study participation was obtained after the purpose of the study was explained to the children’s families. The study protocol was approved by the Research Ethics Board at the Research Ethics Committee, The Society of Physical Therapy Science. Physical Function Muscular Strength Grip strength (kg): The grip strength of each hand was measured using a grip dynamometer for children, the Smedley Dynamometer (Matsumiya Ika Seiki Seisakusho Co., Ltd., Tokyo, Japan). While standing, the child held the dynamometer at his or her side with the arm hanging down from the shoulder and the elbow extended, and squeezed it with maximal force. The grip strength of each hand was measured 3 times, and the maximum values of the 6 trials were then used in subsequent statistical analyses. Trunk flexor and extensor strength (N): Trunk flexor and ex- tensor strength were measured using a hand-held dynamometer (HHD), the Micro FET2 (Hoggan Health Industries, Inc., UT, USA). To measure trunk flexor strength in the children, we had the child being tested lie on an exercise mat in the supine posi- tion. The child then sat up without the support of the upper extremities, while his or her knees and ankles were held immo- bile by an assistant. The Micr o FET2 was applied on the child’s sternum to measure trunk flexor strength (Figure 1(a)). To measure trunk extensor strength in each child, we had the child lie on an exercise mat in the prone position. The child extended the trunk upon instruction, while his or her pelvis and knees were held immobile by an assistant. The Micro FET2 was ap- plied on the child’s interscapular region (Figure 1(b)). Trunk flexor and extensor strength were measured 3 times for each child. The maximum value of each item was processed in sub- sequent statistical analyses. Table 1. Characteristics of the subjects. 3 years 4 years 5 years 6 years Age (n = 17) (n = 17) (n = 17) (n = 17) Boys Girls Boys GirlsBoys Girls BoysGirls Sex (n = 5) (n = 12) (n = 13) (n = 4) (n = 13) (n = 4) (n = 13)(n = 4) 99.7 97 101.9 102.8110.3 108.6 115.2114.8 Heigtha (cm) (6.4) (3.5) (5.4) (5.6)(5.0) (3.8) (3.3)(5.9) 15.4 14.2 16.1 15.718.6 20.2 19.421.4 Weighta (kg) (2.8) (1.5) (2.1) (1.4)(2.4) (4.8) (1.6)(4.3) Note: aMea n value (SD). HHD Examine Assistant HHD Examiner Assist ant (a) (b) Figure 1. Methods of measuring physical functions. Trunk flexor strength, (a); Trunk extensor strength, (b). Balance We chose to evaluate static balance, because dynamic bal- ance tests using a force platform (Doyle et al., 2008) or a func- tional reach test (Duncan et al., 1990) require complex instruct- tions and are therefore less valid measures in young children. One-leg standing time (sec): The duration of one-leg stand- ing time was measured as an indicator of static balance. We measured the amount of time, up to a maximum of 30 sec, dur- ing which the children could maintain standing on one leg. The one-leg standing time was measured 3 times, and the maximum value was used in subsequent statistical analyses. Videotaping o f the Mo vement Patterns of Risi ng from a Supine Position We used the videotaping method described by VanSant (1988). Briefly, two digital video camera recorders (DCR- PC101, Sony, Inc., Tokyo, Japan) located at the children’s feet and side were used to record the children’s motion when rising from a supine position to an erect stance. One camera was placed perpendicular to the length of the mat, and the other, perpendicular to its width. Each camera was placed on a tripod 340 cm from the center of a 192 × 118 cm exercise mat, and at a height of 60 cm from the floor. As recording started, two light signals were emitted by a synchronizing system (Synchronizer PH-100, DKH Co., Ltd., Tokyo, Japan) to synchronize the two video cameras. The syn- chronized video images were recorded simultaneously by a video editing program (Ulead Video Studio 7, Ulead System, Inc., Kanagawa, Japan) so that the movement patterns could be appropriately classified. Regarding instructions for filming, each child lay on the ex- ercise mat in the supine position and was then ordered to stand up. No other instructions were given concerning how to per- form this motion or how quickly to do it. After 3 practice trials, the children were filmed performing the task until they had done 5 trials successfully. The task was judged as successful if the child accomplished it himself or herself without stopping or playing during the task. Statistical Analysis The Mann-Whitney U-test was used to compare the asym- metrical and symmetrical groups with respect to the children’s ages and physical functions. An analysis of covariance (AN- COVA) with age (months) as the covariate was used to com- pare the two movement pattern groups for physical functions. When conducting the ANCOVA, we examined muscle strength and balance for homogeneity of variance to evaluate interaction Copyright © 2013 SciRes. 93 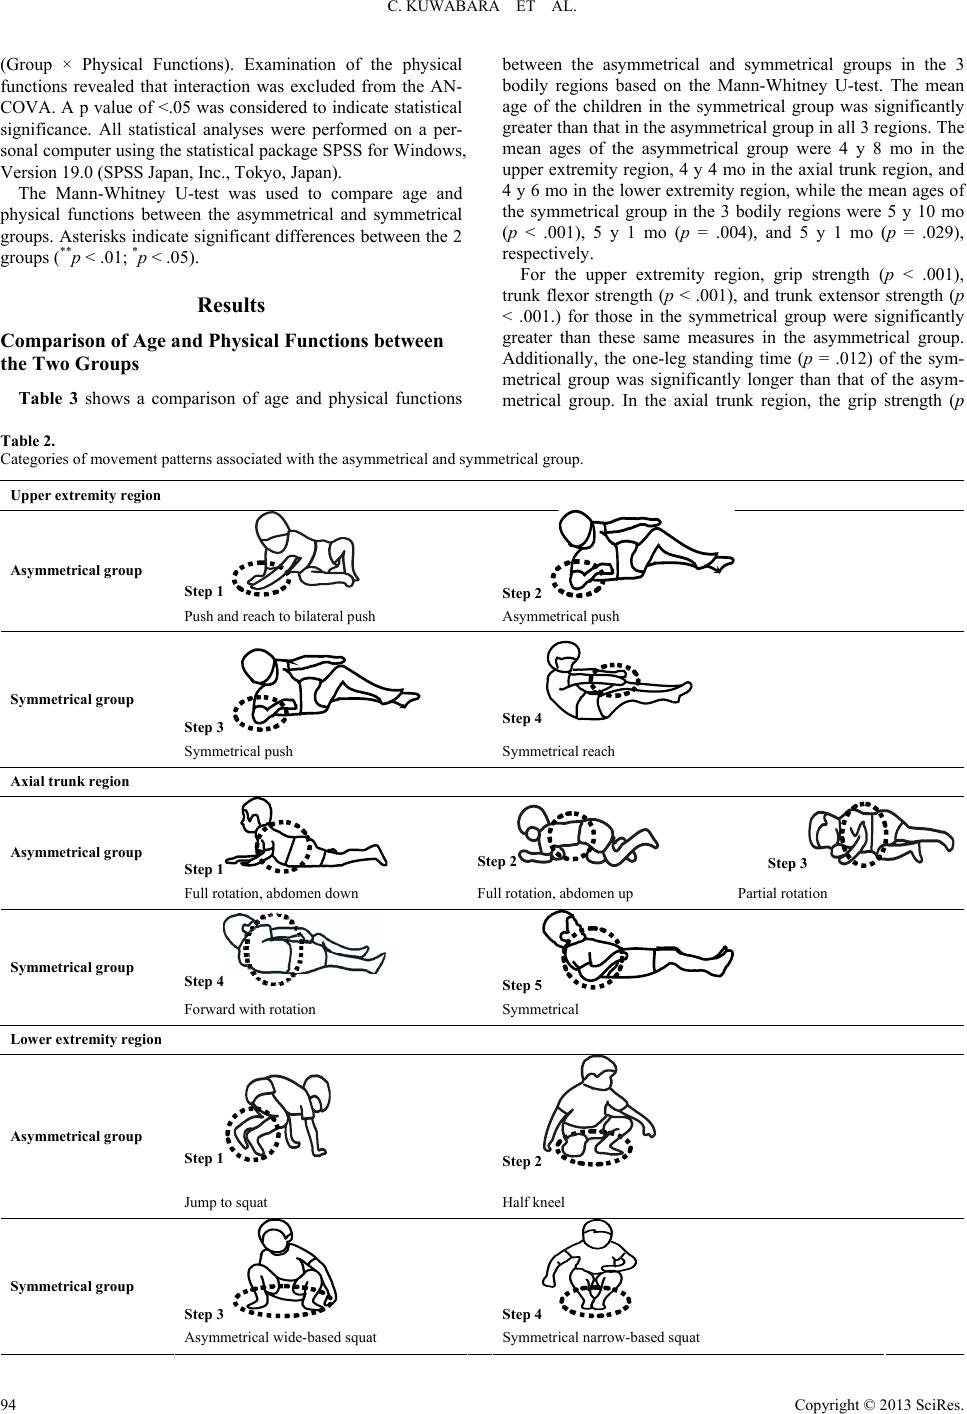 C. KUWABARA ET AL. Copyright © 2013 SciRes. 94 between the asymmetrical and symmetrical groups in the 3 bodily regions based on the Mann-Whitney U-test. The mean age of the children in the symmetrical group was significantly greater than that in the asymmetrical group in all 3 regions. The mean ages of the asymmetrical group were 4 y 8 mo in the upper extremity region, 4 y 4 mo in the axial trunk region, and 4 y 6 mo in the lower extremity region, while the mean ages of the symmetrical group in the 3 bodily regions were 5 y 10 mo (p < .001), 5 y 1 mo (p = .004), and 5 y 1 mo (p = .029), respectively. (Group × Physical Functions). Examination of the physical functions revealed that interaction was excluded from the AN- COVA. A p value of <.05 was considered to indicate statistical significance. All statistical analyses were performed on a per- sonal computer using the statistical package SPSS for Windows, Version 19.0 (SPSS Japan, Inc., Tokyo, Ja pan). The Mann-Whitney U-test was used to compare age and physical functions between the asymmetrical and symmetrical groups. Asterisks indicate significant differences between the 2 groups (**p < .01; *p < .05). For the upper extremity region, grip strength (p < .001), trunk flexor strength (p < .001), and trunk extensor strength (p < .001.) for those in the symmetrical group were significantly greater than these same measures in the asymmetrical group. Additionally, the one-leg standing time (p = .012) of the sym- metrical group was significantly longer than that of the asym- metrical group. In the axial trunk region, the grip strength (p Results Comparison of Age and Physical Functions between the Two Groups Table 3 shows a comparison of age and physical functions Table 2. Categories of movement patterns associated with the asymmetri ca l and symmetrical group. Upper extremity region Step 1 Step 2 Asymme trical group Push and reach to bila teral push Asymmetrical push Step 3 Step 4 Symmetrical group Symmetrical push Symmetrical reach Axial trunk region Step 1 Step 2 Step 3 Asymme trical group Full rotati on, abdomen down Full rotati on, abdomen up Partial rotation Step 4 Step 5 Symmetrical group Forward with rotation Symmetrical Lower extremity region Step 1 Step 2 Asymme trical group Jump to squat Half kneel Step 3 Step 4 Symmetrical group Asymmetrical wide-based squat Symmetrical narrow-based squat  C. KUWABARA ET AL. Table 1. Comparison of age and physical functions between the asymmetrical and symmetrical groups in the 3 bodily regions. Upper extremity region Axial trunk region Lower extremity region Asymmetrical SymmetricalAsymmetricalSymmetricalAsymmetrical Symmetrical Age and phy s ical func ti ons (n = 56) (n = 12) (n = 19) (n = 49) (n = 21) (n = 47) 4 y 9 mo 5 y 8 mo* 4 y 9 m o 5 y 0 mo* 4 y 6 mo 5 y 1 mo* Age (2.0 mo) (2.2 mo) (6.5 mo) (1.9 mo) (4.2 mo) (1.9 mo) 4.4 6.9** 4.5 5.1** 5 5 Grip strength (kg) (0.3) (0.4) (1.0) (0.3) (0.6) (0.4) 41.1 65.2** 45.5 46.9** 42.8 47.8 Trunk flexor s trengtha ( N) (2.9) (4.4) (7.9) (3.2) (6.8) (3.3) 72.6 95.8** 72.6 78.7** 72 79.7 Trunk extens or strengtha (N) (4.7) (3.5) (14.0) (4.3) (10.5) (4.3) 14.2 24.4** 14.2 16.9 15.2 17 One-leg standing timea (sec) (1.8) (3.1) (5.6) (1.8) (3.8) (1.9) Note: aMea n value (SD). = .001), trunk flexor strength (p = .002), and trunk extensor strength (p = .008) of the symmetrical group were significantly greater than those of the asymmetrical group, but there were no significant differences between the two groups in one-leg stand- ing time (p = .080). In the lower extremity region, the children in the symmetrical group were older than those in the asym- metrical group, but no significant differences in physical functions were identified. Comparison of the Physical Functions of the Two Groups Using an ANCOVA with Age as the Covariate An ANCOVA with age (months) as the covariate was per- formed on the muscle strength and balance factors that showed significant differences on the Mann-Whitney U-test for the upper extremity and axial trunk regions. In the upper extremity region, one-leg standing time was excluded from the analysis, because there was interaction (Group × One-leg standing time, p = .026) in the homogeneity of variance. Because there were no significant differences between movement patterns and physical functions in the lower extremity region, this region was excluded from the ANCOVA. The results of the ANCOVA showed that grip strength (p = .004) and trunk flexor strength (p < .001) were significantly different for the two groups showing symmetrical or asymme- trical patterns in the upper extremity region, while trunk exten- sor strength did not differ between the groups showing sym- metrical or asymmetrical patterns (Figure 2). No significant differences in physical functions were detected between the symmetrical and asymmetrical groups in the axial trunk region (Figure 3). Discussion Comparison of Age and Physical Functions between the Symmetrical and Asymmetrical Groups The mean age of the children demonstrating symmetry of movement patterns was significantly greater than that of the asymmetrical group for all 3 bodily regions, at 5 y 8 mo in the P = .004**P = .001** Asymmetrical Group (n = 56) Symmetrical Group (n = 12) Asymmetrical Group (n = 56) Symmetrical Group (n = 12) Asymmetrical Group (n = 56) Symmetrical Group (n = 12) 100 80 60 40 20 0 100 80 60 40 20 0 8 6 4 2 0 Grip strength (kg) Trunk flexor strength (N) Trunk extensor strength (N) Figure 2. Co mp ar ison b y an analysis of cova riance (ANC OVA) with age (mo n th s ) as the covariate physical function values, between the asymmetrical and symmetrical groups in the upper extremity regions. Mean ± SD was estimated by ANCOVA. One-leg standing time was excluded from the analysis, because there was interaction (Group × One-leg standing time, p = .026) in the homogeneity of variance. upper extremity region, 5 y 0 mo in the axial trunk region, and 5 y 1 mo in the lowe r extremi ty region , vs. 4 y 9 mo, 4 y 9 mo, and 4 y 6 mo, respectively, in the asymmetrical group. Mi- lani-Comparetti and Gidoni (1967) state that in healthy children, symmetrical movement patterns emerge around 5 years of age. In the present study, it was clear that the movement patterns were related to age; thus, it was important to adjust for age in considering the movement patterns. With respect to the relationship between muscle strength and balance and movement patterns, our findings revealed that the muscle strength and balance function were significantly differ- ent between the asymmetrical and symmetrical groups. In the upper extremity and axial trunk regions, the muscular strength and balance measures of the symmetrical group were signifi- cantly greater than those of the asymmetrical group. Several Copyright © 2013 SciRes. 95  C. KUWABARA ET AL. Asymmetrical Group (n = 19) Symmetrical Group (n = 49) Asymmetrical Group (n = 19) Symmetrical Group (n = 49) 100 80 60 40 20 0 7 6 5 4 3 2 1 0 Grip strength (kg) Trunk flexor strength (N) Trunk extensor strength (N) Asymmetrical Group (n = 19) Symmetrical Group (n = 49) 100 80 60 40 20 0 Figure 3. Co mpa r is on b y an analysis of covariance (ANCOVA) with age (months) as the covariate physical function values, between the asymmetrical and symmetrical groups in the axial trunk regions. Mean ± SD was esti- mated by ANCOVA based on the values o f t h e p h ysical functions. researchers (Alexander et al., 1995; Kaneko et al., 2003) who have studied movement patterns associated with rising in older people found that muscle strength and balance are related to movement patterns in these populations as well. In the present study, symmetrical movement patterns of rising from a supine position were found to be related to muscle strength and bal- ance in healthy children. In the lower extremity region, only age affected movement pattern changes; physical functions were not significantly dif- ferent between the two groups. In the present study, we did not measure the lower-limb muscle strength, but we speculated that the movement patterns in the lower extremity region were af- fected by the lower-limb muscle strength. We measured one-leg standing time as a measure of static balance. If we had meas- ured dynamic balance, we might have found a relationship be- tween movement pattern differences in the lower extremity region. Because individuals were reported to show great vari- ability with regard to the movement pattern in the lower ex- tremity region (Nakano et al., 2007), we speculated that this movement pattern was affected by various physical functions such as muscular strength, balance, and flexibility. Comparison of Physical Functions between the Symmetrical and Asymmetrical Groups Using an ANCOVA with Age as the Covariate We used ANCOVA to clarify what physical functions other than movement patterns are affected by age, because the de- velopment of muscle strength and balance shows a strong cor- relation with age (Bohannon et al., 1984; Toriola & Igbokwe, 1986; Malina et al., 1995; Doyle et al., 2008). Our results re- vealed that only grip strength and trunk flexor strength corre- lated with the movement patterns in the upper extremity region. Nishimoto et al. (1989) analyzed surface electromyography of healthy adults moving to sitting from the supine, side lying, and prone positions and found that the muscle activity of the ster- nocleidomastoideus and abdominals is greatest when the sub- jects are rising from the supine position. The authors hypothe- sized that weakness of these two axial trunk region muscles causes vicarious motions of the deltoids and triceps to produce weight-bearing in the upper limbs. Their results suggested that if healthy children had sufficient trunk muscle strength, they could rise without weight-bearing on the upper limbs, but if they were deficient in muscle strength in this area, the upper extremities would be used to compensate. In the present study, movement patterns in the upper extremity region were found to be related to muscle strength, independent of their relationship with age. In the trunk axial region, the muscular strength of members of the symmetrical group tended to be greater than that of members of the symmetrical group, but the difference was not significant. Milani-Comparetti and Gidoni (1967) wrote that the degree of trunk rotation in the movement patterns of the axial trunk region was explained by age. We speculated that the movement pattern differences in the trunk axial region were influenced a great deal by age. The results of this study suggest that muscular strength af- fected the process of acquiring a symmetrical movement pattern when rising from a supine position. We believe that children should be taught that improved muscle strength is important for acquiring the rising motion. Additionally, instruction on how to perform asymmetrical movement patterns is very useful for those with weak muscles who are acquiring or re-acquiring the ability to rise from the supine position. Limitations The present study had several limitations. First, it was a correlation analysis, and no cause-and-effect relationship be- tween muscle strength and movement patterns could be con- firmed. A longitudinal analysis would be needed to clarify the influence of muscle strength on movement pattern changes during childhood. The factors that were measured were also limited, and muscle strength of the lower extremity region and overall flexibility were not assessed. More factors that may relate to the performance of the rising motion need to be identified. Although we found great individual differences in muscle strength and balance among the children studied, we only tested 68 subjects between the ages of 3 y 5 mo and 6 y 5 mo; thus, the third limitation was the number of subjects as well as the subjects’ limited age range. The ability to rise from a supine position to an erect stance is established during the first 12 months of life (Milani-Comparetti & Gidoni, 1967; Ueda, 1983; Illingworth, 1991). The present study, however, did not include children under 3 years of age or older than 6 years 5 months. In future research, the relationship between muscle strength and movement patterns in this task must be studied in younger and older subjects as well as in children with disabilities. Acknowledgements We would like to thank the kindergarten teachers and chil- dren who participated in this study, as well as their parents. We would also like to thank our research assistants, especially Sa- toshi Takemoto and Naoki Mihara, who were students at Kita- sato University at the time we conducted this study REFERENCES Alexander, N. B., Fry-Welch, D. K., Marshall, L. M., Chung, C. C., & Kowalski, A. M. (1995). Healthy young and old women differ in Copyright © 2013 SciRes. 96  C. KUWABARA ET AL. Copyright © 2013 SciRes. 97 their trunk elevation and hip pivot motions when rising from supine to sitting. Journal of the American Geriatrics Socie ty, 43, 338-343. Bohannon, R. W., Larkin, P. A., Cook, A. C., Gear, J., & Singer, J. (1984). Decrease in timed balance test scores with aging. Physical Therapy, 64, 1067-1070. Booth, F. W., Weeden, S. H., & Tseng, B. S. (1994). Effect of aging on human skeletal muscle and motor function. Medicine & Science in Sports & Exercise, 26, 556-560. doi:10.1249/00005768-199405000-00006 Choen, J. (1960). A coefficient of agreement for nominal scale. Educa- tional and Psychologic a l Measurement, 20, 37-46. doi:10.1177/001316446002000104 Doyle, R. J., Ragan, B. G., Rajendran, K., Rosengren, K. S., & Hsiao- Wecksler, E. T. (2008). Generalizability of stabilogram diffusion analysis of center of pressure measures. Gait Posture, 27, 223-230. doi:10.1016/j.gaitpost.2007.03.013 Duncan, P. W., Weiner, D. K., Chandler, J., & Studenski, S. (1990). Functional reach: A new clinical measure of balance. The Journals of Gerontology, 45, M192-M197. doi:10.1093/geronj/45.6.M192 Illingworth, R. S. (1991). The normal child (10th ed.). New York: Liv- ingstone Inc. Kaneko, J., Morala, D., & Kurosawa, K. (2003). Relationship between movement patterns and physical fitness elements during rising from the supine to sitting position in community-dwelling elderly persons. Journal of Physical Therapy Science, 15, 87- 91. doi:10.1589/jpts.15.87 Landis, J. R., & Koch, G. G. (1977). The measurement of observer agreement for categorical data. Biometrics, 33 , 159-174. doi:10.2307/2529310 Malina, R. M., Beunen, G. P., Classens, A. L., Lefevre, J., Vanden, B. V., Renson, R., Vanreusel, B., & Simons, J. (1995). Fatness and physical fitness of g i rls 7 to 17 years. Obesity Research, 3, 221-231. doi:10.1002/j.1550-8528.1995.tb00142.x Marsala, G., & VanSant, A. F. (1998). Age-related differences in movement patterns used by toddlers to rise from a supine position to erect stance. Physical Therapy, 78, 149-159. Milani-Comparetti, A. &, Gidoni, E. A. (1967). Routine developmental examination in normal and retarded children. Developmental Medi- cine & Child Neurology, 9, 631-638. doi:10.1111/j.1469-8749.1967.tb02335.x Nakano, C., Shiba, Y., Sakamoto, M., Sato, H., & Mihara, N. (2007). A-two year longitudinal study on the movement patterns of healthy children: Assessment of rising from a supine position to an erect stance. Rigakuryohogaku, 34, 21-28 (In Japanese with English Ab- stract). Nishimoto, K., Kobayashi, S., Hashimoto, T., Okubo, M., Ohori, T., Kikunaga, H., Nishimoto, H., & Koda, T. (1989). Surface electro- myographic analysis for sitting from supine, side lying and prone po- sitions. Rigakuryohogaku, 16, 317-322 (In Japanese with English Abstract). Schaltenbrand, G. (1927). The development of human motility and motor disturbances. Archives of Neurology and Psychiatry, 18, 720- 730. Tokyo Toritsu Digaku Tairyoku hyojunchi kenkyu-kai (2000). Stan- dard value of Japanese physical capacities. Tokyo: Fumaido Pub- lishing (In Japanese). Toriola, A. L. &, Igbokwe, N. U. (1986). Age and sex differences in motor performance of pre-school Nigerian children. Journal of Sports Science, 4, 219-227. doi:10.1080/02640418608732120 Ueda, R. (1983). Japanese edition denver developmental screening test. Tokyo: Ishiyaku Publishers (In Japanese). VanSant, A. F. (1988). Age differences in movement patterns used by children to rise from a supine position to erect stance. Physical Therapy, 68, 1330-1339. VanSant, A. F. (1990). Life-span development in functional tasks. Physical Therapy, 70, 788-798.
|