Paper Menu >>
Journal Menu >>
 Vol.1, No.3, 131-142 (2010) Agricultural Sciences doi:10.4236/as.2010.13016 Copyright © 2010 SciRes. Openly accessible at http://www.scirp.org/journal/AS/ Comparative evaluation of maize inbred lines (zea mays l.) according to dus testing using morphological, physiological and molecular markers Vinod Kumar Yadav*, Indra Sen Singh Department of Genetics and Plant Breeding, G.B. Pant University of Agriculture and Technology, Pantangar, India; *Corresponding Author: vinodbreeder@in.com Received 22 June 2010; revised 3 August 2010; accepted 7 August 2010. ABSTRACT A major challenge facing those involved in the testing of new plant varieties for Distinctness, Uniformity and Stability (DUS) is the need to compare them against all those of ‘common knowledge’. A set of maize inbred lines was used to compare how morphological, physio- logical characterization and RAPD molecular marker described variety relationships. All the inbred lines were confirmed as morphologically and physiologically distinct. At morphological level the maximum genetic distance (10.8) and least genetic distance (1.6) were found. For physiological characters distance varied from 0.35 to 1.92 and results from dendrogram, which was made on the basis of dissimilarity matrix, were grouped into five major clusters. From RAPD, random primers provide polymorphic amplification products; the distance varying 0.42 to 0.65 and dendrogram showed that these lines formed close clusters due to the less variation in these lines at molecular level. In the present study, the molecular markers also ex- posed useful genetic diversity and the visual displays appeared to disperse the lines some- what more evenly over the plot than the mor- phological and physiological methods. Key words: DUS; Inbred Lines; Maize; Markers; Genetic Distance; Diversity 1. INTRODUCTION Maize is grown world wide on an approximately 161 million ha annually with a production of 685 million metric tonnes [1]. It occupies an important position in the world economy and trade as a food, feed and an in- dustrial grain crop. Several million people in the devel- oping world consume maize as a staple food and derive their protein and calories requirement form it. Develop- ment of high yielding hybrids is the most important ob- jective of any maize breeder to enhance productivity. For developing hybrids, better inbred lines with high mean performance are required. DUS Testing is one of the important criteria to test in- bred lines for distinctness, uniformity and stability. DUS Testing of cultivars is one of the requirements for granting Plant Breeders Rights (PBR) and it is con- ducted according to national guidelines prepared on the basis of UPOV guidelines. The system accepted and in operation in a large number of countries is as provided by UPOV. Information is, thus, generated on the basis of internationally accepted and followed norms, thereby providing a basis for appropriate comparison of materials identified under the national agricultural re- search system (NARS) along side materials from other sources. Maize inbred lines represent a fundamental resource for studies in genetics and breeding and are used exten- sively in hybrid corn production [2,3]. Inbreds have also been critical for molecular evaluation [4,5]. Knowledge of genetic diversity in maize germplasm helps to ensure that a broad genetic base of breeding materials is main- tained, not just for sustaining genetic improvement but also for reducing genetic vulnerability to pests and dis- eases. This information may be obtained from pedigree and test cross data, morphological and biochemical traits or molecular markers and it is important for maximizing heterosis because molecular markers can characterize lines directly and precisely at the DNA level. They can help maize breeders in efficiently assigning lines to het- erotic groups and guide them in the choice of parents for the development of new hybrids. Several types of mo-  V. K. YADAV et al. / Agricultural Sciences 1 (2010) 131-142 Copyright © 2010 SciRes. Openly accessible at http://www.scirp.org/journal/AS/ 132 lecular markers are available for evaluating the extent of genetic diversity in maize. These include (RFLP, RAPD, AFLP, SSR, etc). The assessment of genetic diversity within and among populations has been the concern of several researchers in the past and it is especially impor- tant for plant genetic resource management [6,7]. The objective of this study was to determine the po- tential utility of morphological, physiological and RAPD markers for application in research, product develop- ment, seed production, intellectual property right (IPR), and genetic resource conservation management in maize. To accomplish this goal, we report molecular profile and pedigree data for a set of 30 inbred lines. We assessed the discrimination ability of data obtained from mor- phology, physiology and RAPD; and compared inbred lines that are revealed by these data with association that would be expected on the basis of known pedigrees. We also discuss the cost of effectiveness of acquiring RAPD data with respect to the potential use of this technology by breeders and conservators. 2. MATERIALS AND METHODS Morpho-agronomic studies and RAPD characteriza- tion of maize inbred lines on UPOV harmonized charac- teristics, generally as per DUS test guideline [8,9] were undertaken. 1) Seed material used and test conditions The experimental material used for the present study comprised 30 maize inbreeds (data not shown) devel- oped under the auspices of GBPUA&T, Pantnagar and used in hybrid breeding programme, were grown at the Crop Research Centre, G. B. Pant University of Agricul- ture and Technology, Pantnagar. Two evaluation trials were conducted during Kharif, 2002 and Kharif, 2003. In addition, these lines were selfed and selfed seed was harvested separately, for molecular analysis. Recom- mended package of agronomic practices and plant pro- tection measures were adopted. 2) Characteristics used for morphological and physio- logical evaluation UPOV’s DUS test guidelines [10,11] were generally followed beginning from the trial layout to recording of the last field related observation. In UPOV [11] 34 mor- phological and physiological characteristics to be re- corded in maize at different stages of plant growth are given. Out of these, 12 characteristics are marked with asterisk (*), which means that characteristics have to be compulsorily observed in every environment. Keeping this in view, a total number of 27 characteristics were selected for observations. Characters considered for testing of inbred lines [12] are given in Table 1. 3) Molecular characterization The same set of 30 inbred lines used in the morpho- logical & physiological study, were used for molecular characterization by RAPD analysis. Leaves from 6-8 plants (3-4 leaf stage) were bulked and ground to a fine powder with liquid nitrogen using a mortar and pestle. DNA was extracted using a modified CTAB procedure [13]. Chemicals, glasswares and instruments used for this study were as per standardized source. 2.1. Amplification and Detection Conditions Approximately 10 ng of DNA was used as template for PCR in 25 µl reaction containing 1X PCR buffer, 200 µM each dNTPs, 0.76 U Tag polymerase and 30 ng of primer (PCR buffer, dNTPmix, Taq polymerase and primers were from Bangalore Genei Pvt. Ltd.). The de- tails of lot number and sequence of primers are given in Table 2. Amplification was carried out using eppendorf thermocycler by the following amplification conditions i.e., initial denaturation at 94°C (5 min.); 36 cycles of 94°C (30 sec.) denaturation, 34°C (1min) annealing, and 72°C (1 min) extension; and then a final extension at 72°C (5 min). 2% Agarose gel was prepared for frac- tionation of RAPD markers. During preparation of Aga- rose gel 5 µl Ethidium bromide stack (10 mg/ml) was added. DNA template and dye were loaded in 5:1 ratio and electrophoresis was done at 60 V for 4-5 hrs in 1X TBE buffer. 2.2. Gel Scoring The amplification products were scored separately for each primer. The bands observed on the gel were com- pared across the lanes for products with similar molecu- lar weight, based on specific molecular weight marker. The bands were scored for the presence or absence by binary coding, i.e., assigning a value of 1 for presence and 0 for absence in a lane. 2.3. Data Analysis To determine the relationships among lines, we calcu- lated similarities (dissimilarities) between inbred lines from different data sets as follows: 1) Pair-wise comparisons for understanding ‘clear distinguishability’ among inbreds: The single values obtained for each characteristic for each plant were compared with each other inbred over the set of seven characteristics. A characteristic was con- sidered to be clearly distinct between the pair of inbreds under comparison, if there was no overlapping of the description and there was a clear difference of at least 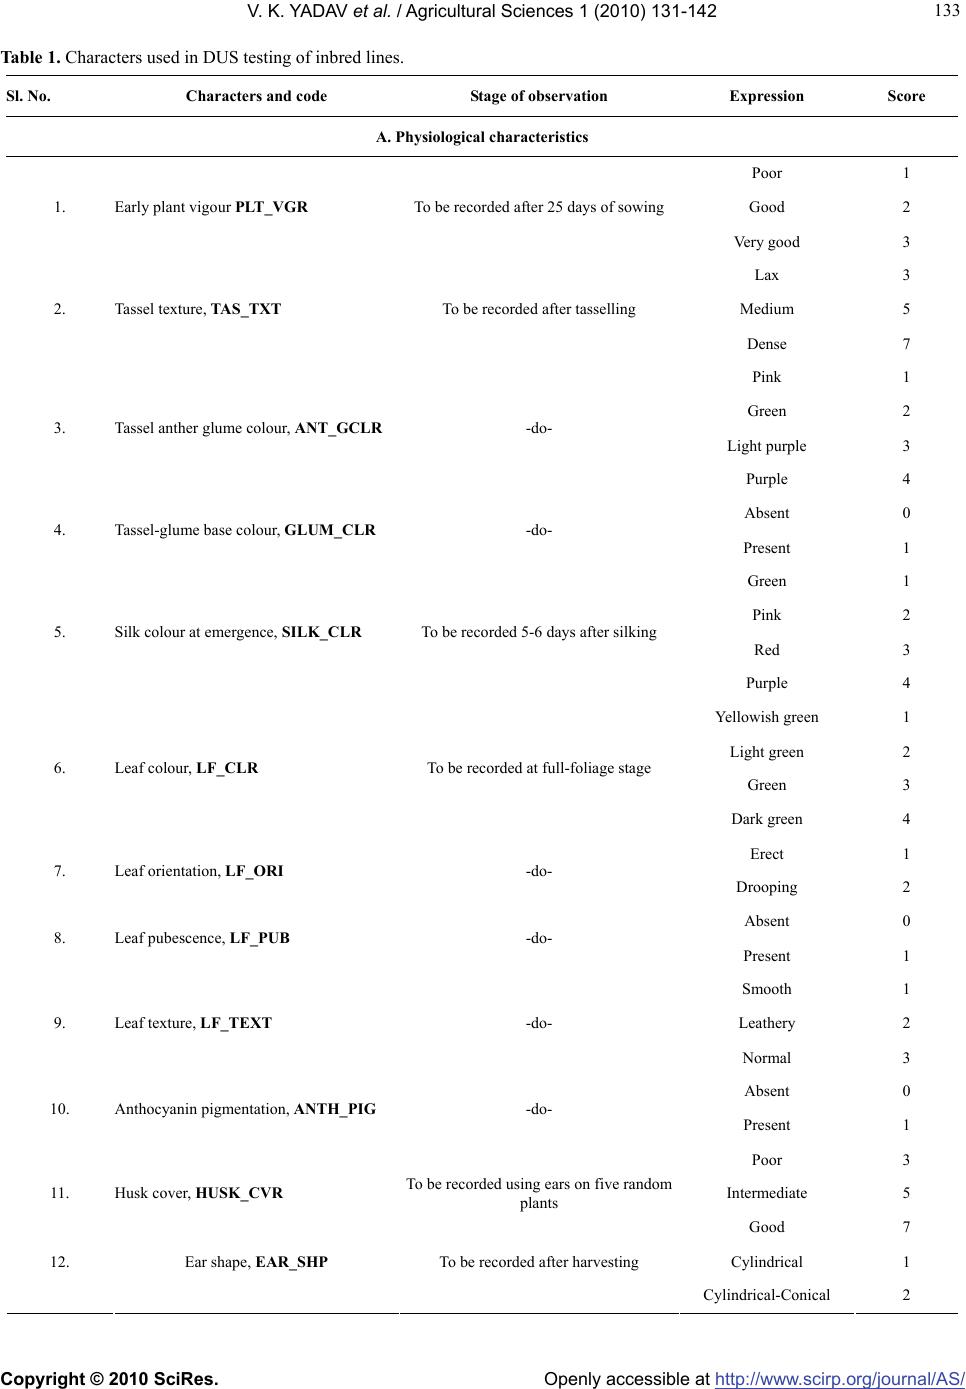 V. K. YADAV et al. / Agricultural Sciences 1 (2010) 131-142 Copyright © 2010 SciRes. Openly accessible at http://www.scirp.org/journal/AS/ 133 133 Table 1. Characters used in DUS testing of inbred lines. Sl. No. Characters and code Stage of observation Expression Score A. Physiological characteristics Poor 1 Good 2 1. Early plant vigour PLT_VGR To be recorded after 25 days of sowing Very good 3 Lax 3 Medium 5 2. Tassel texture, TAS_TXT To be recorded after tasselling Dense 7 Pink 1 Green 2 Light purple 3 3. Tassel anther glume colour, ANT_GCLR -do- Purple 4 Absent 0 4. Tassel-glume base colour, GLUM_CLR -do- Present 1 Green 1 Pink 2 Red 3 5. Silk colour at emergence, SILK_CLR To be recorded 5-6 days after silking Purple 4 Yellowish green 1 Light green 2 Green 3 6. Leaf colour, LF_CLR To be recorded at full-foliage stage Dark green 4 Erect 1 7. Leaf orientation, LF_ORI -do- Drooping 2 Absent 0 8. Leaf pubescence, LF_PUB -do- Present 1 Smooth 1 Leathery 2 9. Leaf texture, LF_TEXT -do- Normal 3 Absent 0 10. Anthocyanin pigmentation, ANTH_PIG -do- Present 1 Poor 3 Intermediate 5 11. Husk cover, HUSK_CVR To be recorded using ears on five random plants Good 7 Cylindrical 1 12. Ear shape, EAR_SHP To be recorded after harvesting Cylindrical-Conical 2  V. K. YADAV et al. / Agricultural Sciences 1 (2010) 131-142 Copyright © 2010 SciRes. Openly accessible at http://www.scirp.org/journal/AS/ 134 Conical 3 Round 4 Regular 1 Irregular 2 Straight 3 13. Kernel row arrangement, KER_ARR -do- Spiral 4 14. Kernel colour, KER_CLR -do- White 1 Yellow 2 Variegated 3 Orange 4 15. Grain shape, GRN_SHP -do- Shrunken 1 Round 2 Indented 3 Pointed 4 16. Grain size, GRN_SIZ -do- Small 3 Medium 5 Bold 7 B. Morphological/Quantitative characters 17. Days to tasseling, DAY_TASS To be recorded as number of days from sowing to when 50% of the plants have shed pollen. Pollen shading on the central axis is recorded as tassel emergence 18. Days to silking, DAS_SILK Number of days from sowing to when silks have emerged on 50% of the plants. Silk emergence in plants is recorded as days to silk 19. Tassel branching, TASS_BRN To be recorded after tasseling 20. Plant height (cm), PLT_HGT To be measured from ground level to the base of the tassel (after milk stage) 21. Ear height (cm), EAR_HGT To be measured from base of the plant to the point bearing the first ear 22. Ear length (cm), EAR_LT To be measured as distance from the base of the tip of the ear 23. Ear width (cm), EAR_WD To be measured at the central part of the upper most ear as maximum girth of the ear 24. Number of kernel rows, KER_ROW To be recorded as number of kernel – rows in the central part of the uppermost ear 25. Number of kernels/row, KER_PROW To be recorded as average number of ker- nels/five – rows of five respective ears 26. 100 seed weight (g), SED_WGT To be recorded after harvesting 27. Grain yield / plant (g), YLD_PLT Average yield of five random plants are scored  V. K. YADAV et al. / Agricultural Sciences 1 (2010) 131-142 Copyright © 2010 SciRes. Openly accessible at http://www.scirp.org/journal/AS/ 135 135 Table 2. Primer codes and sequence. Sl. No. Primer code Sequence 1. OPP-01 GTAGCACTCC 2. OPP-02 TCGGCACGCA 3. OPP-04 GTGTCTCAGG 4. OPP-07 GTCCATGCCA 5. OPP-08 ACATCGCCCA 6. OPP-14 CCAGCCGAAC 7. OPP-15 GGAAGCCAAC 8. OPP-16 CCAAGCTGCC 9. OPE-14 TGCGGCTGAG 10. OPC-15 GACGGATCAG one character-state, another criterion for clear distin- guishability in UPOV guidelines [10]. 2) Morphological and physiological comparison of inbred lines: The mean values for eleven morphological characters and scaling values for physiological characters were used to assess dissimilarity between inbred lines. The matrix of all the characteristics was standardized and used to calculate euclidean distances among the inbreds. A dendrogram was constructed using Sequential Ag- golomerative Hierarchical and Nested clustering Analy- sis (SAHN) to provide a general visualization of rela- tionship between inbreds on morphological and physi- cogical characteristics. 3) RAPD analysis to establish distinctness: From the presence/absence of bands, matrix of data on the basis of their Rm values, similarity coefficients among the inbreds were calculated following [14]. As shown in (1). PCR amplification data from the samples that were inconsistent were not included in the final statistical analysis. The similarity matrix was also subjected to SAHN clustering analysis to construct dendrogram. All the numerical taxonomic analyses with respect to morpho-agronomic and RAPD were performed using the SAS software, and NTSYS-pc software [15]. 3. RESULTS 3.1. Pair-Wise Comparison for Understanding ‘Clear Distinguishability’ among Inbreds Data on each plant from different inbred lines were subjected to measure clear distinguishability by a dif- ference of at least one character-state in different pos- sible pairs of 30 inbreds. Table 3 shows number of in- bred pairs in which different characteristics appeared to contribute towards ‘clear distinguishability’ provid- ing the final ranking of different characteristics for dis- crimination among different inbreds. There was a wide range of distinguishability across the inbred lines. Tas- sel branching, which is the key characteristic for use of different inbreds as male parents in hybrid production occupied first position. Other characteristics, such as plant height, kernels/row, ear height, ear length and ear width for which good degree of uniformity has been maintained also occupied good position in ‘clear distin- guishability’. 3.2. Morphological Characters The mean values for 11 morphological characters were subjected to dissimilarity analysis. The dissimilarity ma- trix Table 4 and on the basis of matrix dendrogram was constructed Figure 1 to provide general visualization. Given this diversity, all 30 lines were found to differ Table 3. Importance of different characteristics in terms of their contribution towards ‘clear distinguishbility’. SL. NO. Characteristics Number of pairs separated rank 1. TASS_BRN 396 1 2. PLT_HGT 384 2 3. EAR_HGT 367 4 4. EAR_LT 364 5 5. EAR_WD 333 6 6. KER_ROW 311 7 7. KER_PROW 383 3  V. K. YADAV et al. / Agricultural Sciences 1 (2010) 131-142 Copyright © 2010 SciRes. Openly accessible at http://www.scirp.org/journal/AS/ 136 N o. ofmatchingbandsintwolanescompared Similarity Index =Total number ofbands (1) from each other industrial. The genetic distance between inbred 2 and inbred 12 was the least (1.6). The maxi- mum genetic distance was noted between inbred 17 and 25 followed by inbred 10 and 17; and 15 and 17. Den- drogram resulting from cluster analysis of 30 inbred lines could be primarily divided into three major groups. 3.3. Physiological Characters For physiological characters different scaling values were used to assess dissimilarity between inbred lines. The results obtained by this analysis is presented in Ta- ble 5 (dissimilarity matrix) and Figure 2. (dendrogram) respectively. Genetic distance varied from 0.35 to 1.92 for 30 inbred lines. The minimum distance indicating closely related inbred lines was between inbred 13 and 23 (0.35). Two inbred lines that highly differed from each other were 2 and 20 (1.92). Dendrogram made on the basis of dissimilarity matrix showed five main clus- ters, and within these clusters different number of lines were present. 3.4. Feasibility to Establish Distinctness Using Rapd The bands generated from the 10 primer combinations across 30 inbred lines were used to work out genetic distance. Random primers provide highly polymorphic amplification product. The distance varied from 0.42 to 0.65 Table 6. Between inbred lines 27 and 29 it was the least (0.42). The farthest genetic distance was found between inbred lines 2 and 20; 2 and 28; and 3 and 16. In general, inbred 2 was genetically more distinct and diverse from other lines under study. The dendrogram of 30 lines is shown in Figure 3. These lines formed closed clusters due to reduced amount of variation between them. Lines did not cluster according to source population, which has been reported in other studies also showing large amount of diversity within the source populations relative to between popu- lations [16] 3.5. Discussion The question of Plant Variety Protection (PVP) has been brought into worldwide focus by the agreement on Trade Related Aspects of Intellectual Property Right (TRIPS), which is a part of GATT (General Agreement on Tariffs and Trade) Agreement establishing the World Trade Organization (WTO) in 1995. The PBR concept is based on the realization that if commercial plant breed- ing is to be encouraged for the benefit of agriculture and society, measures have to be taken to allow breeders to profit from their product [17]. Further, it makes possible to define a plant grouping with sufficient specificity to allow the unambiguous assignment and enforcement of property rights. Analysis of genetic diversity and of relationship among the elite breeding materials can significantly aid in crop improvement [18]. In maize, this information is useful in planning for hybrid and line development, as- signing lines to heterotic groups and in plant variety protection [19], molecular markers are more powerful in assessing genetic diversity in comparison with the mor- phological data, pedigree data and biochemical data, because these markers reveal differences at the level of DNA [20]. The lines used in this study were a small but representative sample of existing commercial hybrids, and so typified the kind of diversity encountered by the testing authorities conducting registration tests. They were all morphologically and physiologically distinct, as would be expected. In the present study, the molecular markers also ex- posed useful genetic diversity, and the visual displays appeared to disperse the line somewhat more evenly over the plot than the morphological and physiological method. However, there was little agreement on variety relationships between the morphology, physiology and the molecular methods. Other workers have reported a distances [21-24]. Lines that display high phenotypic dissimilarity need not be genetically dissimilar. The pur- pose of pre-screening would be to subdivide candidate varieties into groups, so reducing the number of controls and pair-wise comparisons that have to be examined in the morphology test. However, this process assumes that the pre-screening characters guarantee that varieties placed in different groups are distinct in the morpho- logical characters used for registration. Clearly, this would not be the case as the present study showed that molecular and morphological differences were not cor- related. Therefore, using molecular markers as grouping- characters would by default, require acceptance of their use as a distinguishing characters, at least for the most- divergent inbred lines. An alternative way to deal with the poor correlation between genetic and morphological distances could be to select only molecular markers  V. K. YADAV et al. / Agricultural Sciences 1 (2010) 131-142 Copyright © 2010 SciRes. Openly accessible at http://www.scirp.org/journal/AS/ 137 137 Table 4. Pair-wise dissimilarity matrix of 30 inbred lines based upon morphological variables.  V. K. YADAV et al. / Agricultural Sciences 1 (2010) 131-142 Copyright © 2010 SciRes. Openly accessible at http://www.scirp.org/journal/AS/ 138 Table 5. Pair-wise dissimilarity matrix of 30 inbred lines based upon physiological variables.  V. K. YADAV et al. / Agricultural Sciences 1 (2010) 131-142 Copyright © 2010 SciRes. Openly accessible at http://www.scirp.org/journal/AS/ 139 139 Table 6. Pair-wise dissimilarity matrix based upon Jaccard’s coefficient of 30 inbred lines by RAPD analysis.  V. K. YADAV et al. / Agricultural Sciences 1 (2010) 131-142 Copyright © 2010 SciRes. Openly accessible at http://www.scirp.org/journal/AS/ 140 Figure 1. Dendrogram of 30 inbred lines based upon mean of 11 morphological variables. Figure 2. Dendrogram of 30 inbred lines based upon mean of 16 physiological variables.  V. K. YADAV et al. / Agricultural Sciences 1 (2010) 131-142 Copyright © 2010 SciRes. Openly accessible at http://www.scirp.org/journal/AS/ 141 141 Figure 3. Dendrogram of 30 inbred lines based upon RAPD analysis. linked to phenotypic traits in DUS testing. The diversity patterns of the inbred lines revealed a large amount of diversity that did not allow a clear-cut distinction between groups. This case is similar to that of the CIMMYT populations, which served as germplasm sources for many of the Asian lines [16], where a large amount a diversity within, relative to between, source populations was observed. On the other hand, the het- erotic groups in the US and European temperate maize were clearly differentiated in previous studies using RFLPs and SSRs [23-27]. This study is an initial attempt to characterize the breadth of germplasm diversity, from which we con- cluded that breeding activity at Pantnagar has not caused a decline in the overall amount of diversity in the inbred lines. In sum and substance, it can be stated that al- though the work had concentrated on DUS testing, it is myth and less a reality. There are only small number of descriptors available in released and notified cultivars in India and their parental lines. If an attempt is made by considering a large number of descriptors, establishment of ‘clear distinguishability for each material may not be difficult. Morphological markers and molecular markers with insufficient primers do not generate sufficient di- versity in the population. So sufficient primers which cover whole genome should be used in the further stud- ies on DUS testing. REFERENCES [1] (2008) FAOSTAT, Food and Agricultural Organization, Rome. [2] Anderson, E. and Brown, W.L. (1952) Origin of corn belt maize and its genetic significance, In: Heterosis - A Re- cord of Researches Directed toward Explaining and Util- izing the Vigor of Hybrids, Gowen, J.W., Ed., Iowa State College Press, Ames, 124-148. [3] Troyer, A.F. (2001) Temperate corn. In: Hallauer, A., Ed., Specially Corns, CRC Press, Boca Raton. [4] Henry, A. and Damerval, C. (1997) High rates of ploy- morphism and recombination at the Opaque-2 locus in cultivated maize. Molecular and General Genetics, 256, 147-157. [5] Ching, A., Caldwell, K.S., Jung, M., Dolan, M. and Smith, O.S. (2002) SNP frequency, haplotype structure and linkage disequilibrium in elite maize inbred lines. BMC Genet, 3(19), 1-14. [6] Bretting, P.K. and Widrlechner, M.P. (1995) Genetic markers and plant genetic resource management. Plant  V. K. YADAV et al. / Agricultural Sciences 1 (2010) 131-142 Copyright © 2010 SciRes. Openly accessible at http://www.scirp.org/journal/AS/ 142 Breeding Reviews, 13, 11-86. [7] Hamrick, J.L. and Godt, M.J.W. (1989) Allozyme diver- sity in plant species. In: Brown, A.H.D., Clegg, M.T., Kahler, A.L. and Weir, B.S., Eds., Plant Population Ge- netics, Breeding, and Genetic Resources, Sinouer Asso- ciation, Sunderland, 43-63. [8] UPOV (1979) Revised general introduction to the guide- lines for the conduct of tests for distinctness, homogene- ity and stability of new varieties of plants. UPOV TG/1/2, 11. [9] UPOV (1980) Guidelines for the conduct of tests for distinctness, homogeneity and stability – maize (Zea mays L.). UPOV TG/2/4, 14. [10] UPOV (1991) UPOV Publication No. 221(E) of 1992 on international convention for the protection of new varie- ties of plants of December 23, 1978; and on March 19, 1991. 31. [11] UPOV (1994a) Guidelines for the conduct of tests for distinctness, homogeneity and stability-maize (Zea mays L.). UPOV TG/2/6, 63. [12] Sujay, R. and Singh, N.N. (2001) Guidelines for conduct of test for distinctness, uniformity and stability in maize (Zea mays L.). Directorate of maize Research, New Delhi. [13] (2001) The applied biotechnology center’s manual of laboratory protocols. CIMMYT, Mexico. [14] Jaccard, P. (1908) Nouvelles researches sur la distribu- tion florale. Bulletin de la Société vaudoise des sciences naturelles, 44, 223-270. [15] Rohlf, F.J. (1992) NTSYS-pc Numerical taxonomy and multivariate analysis system. Exeter Software, New York. [16] Warburton, M.L., Xianchun, X., Crossa, J., Franco, J., Melchinger, A.E., Frisch, M., Bohn, B. and Hoistington, D. (2002) Genetic characterization of CIMMYT inbred maize lines and open pollinated populations using large scale fingerprinting methods. Crop Science, 42, 1832- 1840. [17] Mishra, J.P. (1999) Biotechnology and intellectual prop- erty rights. Yojana, May, 15-20. [18] Hallauer, A.R., Russel, W.A. and Lamkey, K.R. (1988) Corn breeding. In: Sprague, G.F. and Dudley, J.W., Eds., Corn and Corn Improvement, 3rd Edition, Agronomy Monograph, 18, ASA, CSSA and SSSA, Madison, 463- 564. [19] Yuan, L., Zhang, S., Warburton, M., Li, X., Fu, J. and Li, M. (2002) Assessment of genetic similarities among maize inbred lines using SSR markers. In: Proceedings of the Eighth Asian Regional Maize Workshop, Bangkok, 50-58. [20] Melchinger, A.E. (1999) Genetic diversity and heterosis. In: Coors, J.G. and Pandey, S., Eds., Proceedings of the International Symposium on Genetics and Exploitation of Heterosis in Crops, CIMMYT, Mexico, 17-22 August 1997, 3-48. [21] Ben-Har, A., Charcoset, A., Bourgoin, M. and Guiard, J. (1995) Relationships between genetic markers and mor- phological traits in a maize inbred lines collection. Euphytica, 84, 145-154. [22] Burstin, J. and Charcosset, A. (1997) Relationship be- tween phenotypic and markers distance: Theoretical and experimental investigations. Heredity, 78, 477-483. [23] Senior, M.L., Murphy, J.P., Goodman, M.M. and Stuber, C.W. (1998) Utility of SSRs for determining genetic similarities and relationship in maize using and Aqarose gel system. Crop Science, 38, 1088-1098. [24] Smith, J.S.C., Chin, E.C.L., Shu, H., Smith, O.S., Wall, S. J., Senior, M.L., Mitchell, S.E. Kresobitch, S. and Ziegle, J. (1997) An evaluation of the utility of SSR loci as mo- lecular markers in maize (Zea mays L): Comparisons with data from RFLPs and Pedigree. Theoretical and Ap- plied Genetics, 95, 163-173. [25] Messmer, M.M., Melchinger, A.E. and Boppenmaier, E. (1992) Relationship among European maize inbreds: I. Genetic diversity among flint and dent lines revealed by RFLPs. Crop Science, 32, 1301-1309. [26] Messmer, M.M., Melchinger, A.E., Boppenmaier, J., Brunklaus-Jung, E. and Herrmann, R.G. (1992) Rela- tionship among early European maize inbreds: I. Genetic diversity among flint and dent lines revealed by RFLPs. Crop Science, 32, 1301-1309. [27] Dubreuil, P., Dufour, P., Drejci, E., Causse, M.M., de Vienne, D. Gallais, A. and Char Cosset, A. (1996) Or- ganization of RFLP diversity among inbred lines of maize representing the most significant heterotic groups. Crop Science, 36, 790-799. |