Paper Menu >>
Journal Menu >>
 Vol.1, No.3, 110-118 (2010) Agricultural Sciences doi:10.4236/as.2010.13014 Copyright © 2010 SciRes. Openly accessible at http://www.scirp.org/journal/AS/ Soybean seed protein, oil, fatty acids, N, and S partitioning as affected by node position and cultivar differences1 Nacer Bellaloui*, Anne M. Gillen Crop Genetics Research Unit, USDA-ARS, Stoneville, USA; * Corresponding Author: nacer.bellaloui@ars.usda.gov Received 6 July 2010; revised 21 August 2010; accepted 24 August 2010. ABSTRACT The mechanisms controlling the partitioning of seed composition constituents along the main stem in soybean are still controversial. There- fore, the objective of this study was to investi- gate seed protein, oil, and fatty acids partition- ing in soybean cultivars along the main stem. The cultivars were DT97-4290, maturity group (MG) IV; Stressland, MG IV; Hutcheson, MG V; TracyM, MG VI. Seeds were harvested based on position on the plant (top nodes, middle nodes, and bottom nodes). At R8 (physiological matur- ity stage), DT97-4290, Hutcheson, and Stress- land had higher percentage of protein and oleic acid and lower percentage of oil and linolenic acid in top node seed compared with bottom node seed. The increase of protein in top node compared with the bottom node across the two experiments ranged from 15.5 to 19.5%, 7.0 to 10.5%, 14.2 to 15.8%, 11.2 to 16.5%, respectively for DT97 - 4290, Hutcheson, Stressland, and TracyM. Except for TracyM, the increase of oleic acid in the top node ranged from 45.4 to 93%, depending on the cultivar. Conversely, the de- crease in the top node seed ranged from 14.4 to 26.8% for oil and from 5.7 to 34.4% for linolenic acid, depending on the cultivar. The partitioning trend of seed composition constituents at R6 (seed - fill stage) was inconsistent. Except for Stressland, seed oleic acid was higher at R6 than at R8. The higher protein and oleic acid concentrations in the top node seed was accom- panied by higher activity of nitrate reductase activity, higher chlorophyll concentration, higher nitrogen (N) and sulfur (S) percentages in the fully expanded leaves at R5-R6 growth stage, and higher seed nitrogen (N) and sulfur (S) percentages in DT 97-4290 and Stressland. The current research suggests that the partitioning of seed protein, oil, and fatty acids in nodes along the plant depended on the position of node on the main stem, cultivar differences, seed N and S status, and tissue N and S parti- tioning. The higher nitrate reductase activity at the top nodes, accompanied higher protein and oleic acid, and the changes of oleic acid at R6 and R8 along the stem, were not previously re- ported, and need further investigation. The cur- rent knowledge is useful for soybean germplasm selection for desirable traits such protein and oleic acid, and for accurate measurements of seed composition constituents in breeding lines. Keywords: Seed Composition; Nitrogen Assimilation; Soybean; Nitrogen; Sulfur 1. INTRODUCTION Soybean seed is a source of protein and oil for human nutrition and a source of soybean meal for livestock feed. Soybean protein meal and soybean oil accounted for 69% and 30%, respectively in 2006 and 2007, of the world's supply of protein meal and edible oil [1]. Many international and domestic soybean processors prefer soybean with at least 340 g kg-1 protein and 190 g kg-1 oil, assuming 130 g kg-1 seed moisture [2]. Soybean seed quality is determined by the quantity and quality of pro- tein and oil content (seed composition). Previous studies showed that soybean seed protein and oil qualities and quantities significantly vary as function of node position [3,4]. However, the source of this variability is not yet understood, and the literature about seed protein and oil partitioning along the main 1Mention of trade names or commercial products in this publication is solely for the purpose of providing specific information and does not imply recommendation or endorsement by the U.S. Department o f Agriculture.  N. Bellaloui et al. / Agricultural Sciences 1 (2010) 110-118 Copyright © 2010 SciRes. Openly accessible at http://www.scirp.org/journal/A S/ 111 111 stem is still controversial. Understanding the mecha- nisms of this variability would allow for efficient breed- ing and selection for higher seed composition qualities and for more accurate seed composition measurements in breeding lines. It was reported that seed oil content on lower nodes in indeterminate cultivars was higher than the seed on the upper nodes [3]. For determinate culti- vars, however, the highest oil content in seed was re- corded in seeds from terminal nodes [3]. It was found a nearly linear increase in protein content of seeds from bottom to the top nodes in indeterminate and high pro- tein breeding lines [5]. Bennett et al. [6] showed higher oil concentration in soybean seed from basal plant nodes compared with upper plant nodes. On the other hand, seed from the middle nodes on determinate cultivars had higher oil and lower protein than seeds from either the top or bottom of the plants [3]. Other research indicated that the lowest seed protein concentration occurred at lowest nodes in both determinate and indeterminate types, and protein concentration increased linearly from 397 g kg-1 at the lowest node to 442 g kg-1 at the highest node in determinate and increased from the lowest (398 g kg-1) and increased progressively through 14 in inde- terminate, with no significant differences between nodes 12 and 16 [4]. Huskey et al. [7] found that protein con- centration of 241 individual seeds from different posi- tions in ‘Forrest’ soybean did not differ between the top third (415 g kg-1) and the bottom third (410 g kg-1) of plants. Both these concentrations were higher than the middle third of plants (392 g kg-1). Nitrogen (N) and sulfur (S) mobilization from vegeta- tive tissues to seed, their status in tissue and seed, and their distribution along the main stem could be a limiting factor for seed composition constituents, especially for protein production and amino acid profile. This is be- cause high mobilization of N from vegetative tissue to seed is required for seed composition [8,9] and S [10]. Seed N concentration is correlated with N availability within plants, and the contribution of N remobilization to seed N accounted for about 80% to 90% in soybean (Glycine max) [11], 43% to 94% in rain-fed grown lentil (Lens culinaris) [12], 84% in bean plants (Phaseolus vulgaris) [13], and 80% in Vicia faba [14]. It was shown that seed N content significantly different between R5, R6, and R7 growth stages. Mean N contents were 6.28% at R5, 6.35% at R6, and 6.68% at R7 [15]. Seed N is approximately one-half mobilized N under normal field conditions [16], and soybean mobilizes 66 to 79% of its vegetative N [17], Nitrogen and protein in vegetative tissues are important sources of re-mobiliz- able S [18]. It was found that soybeans mobilize 61 to 82% and 66 to 79%, respectively, for vegetative N and S to seed [17,19]. Egli and Bruening [20] suggested that total plant N supply to the seed may be the primary lim- iting factor for seed protein and yield accrual. It was concluded that the proportion of mobilized N found in the seed at harvest is more dependent on the amount of N stored in the vegetative tissues than on the amount of N either taken up from soil or fixed during seed filling [21]. On the other hand, N acquisition by soybean plants involves two interdependent systems, uptake and reduc- tion of soil NO3 - by nitrate reductase enzyme, and N2 fixation by Bradyrhizobium japonicum in the nodules using nitrogenase, both of which are dependent on en- ergy supplied by photosynthesis [22]. Reduction in pho- tosynthesis during the seed-fill period would limit both C and N assimilation, reducing seed yield and seed pro- tein and oil. For example, when photosynthesis was re- duced by shading, a decrease in yield was associated with a decrease in seed size, oil concentration, and in- creased protein concentration [23]. The rate of these processes would limit N and C sources for seed growth. Naeve and Shibles [24] found S mobilization to seed dependent on the quantity of S stored in leaf tissue. Soybean leaf S concentration declines during seed-fill period [25,26] as does N/S ratio [25]. Based on the above discussion, the mechanisms con- trolling the variability of seed composition constituents as function of nodal position are still not well known, and available results are still not consistent. Therefore, the objective of this experiment was to further investi- gate the partitioning of seed protein, oil, fatty acid at R6 and R8 [27] in determinate and indeterminate soybean with maturity group ranged from IV to VI. To provide more sources of variability in the measured variables, we included different cultivars, with different MG and dif- ferent stem architecture (terminate and indeterminate). Possible relationships between nodal seed composition and seed N and S partitioning on different nodes, N as- similation and chlorophyll concentration in leaves from different nodes were also investigated. 2. MATERIALS AND METHODS Two greenhouse experiments were conducted at Delta States Research Center in Stoneville, MS. Since seed samples were the main plant organ in this study, the two experiments were conducted in different greenhouse bays and in different years. Therefore, variability between the two experiments was expected. Soybean seed were ger- minated in flat trays in vermiculite. Four uniform size seedlings at V1 stage were transplanted into each 9.45 L size pot filled with field soil (sandy loam, fine-loamy, mixed thermic Molic Hapludalfs) with pH 6.3, 1.1% or- ganic matter, and soil textural fractions of 26% sand, 56% silt, and 18% clay, and it contained an abundant native population of B. japonicum. Soil was irrigated as needed  N. Bellaloui et al. / Agricultural Sciences 1 (2010) 110-118 Copyright © 2010 SciRes. Openly accessible at http://www.scirp.org/journal/A S/ 112 based on the soil water potential, monitored by tensiome- ters. Soil water potential was measured every other day using Soil Moisture Meter (WaterMark Company, Inc., Wisconsin, U.S.A.). The soil water potential was kept between −15 to −20 kPa (this was considered field capac- ity for the soil used in this experiment). Greenhouse con- ditions were: temperature was about 32oC ± 8oC during the day and about 20oC ± 5oC at night with a photosyn- thetic photon flux density (PPFD) of about 500-2100 µmol m-2 s -1, measured by Quantum Meter (Spectrum Technology, Inc., Illinois, U.S.A.). The range of light in- tensity reflects a bright and sunny or cloudy day, respec- tively. The source of lighting in the greenhouse was a mixture of natural light, standard incandescent bulb light (60 W), and cool white incandescent bulb (250 W). Cul- tivars grown were maturity group (MG) IV DT97-4290, indeterminate; MG IV Stressland, indeterminate; MG V Hutcheson, determinate; MG VI TracyM, determinate. Selection of cultivars was based to include different MG (MG IV and V are maturities often used in the region by growers), different stem architecture (determinate and indeterminate), different stress tolerance level (Stressland is adapted to harsh stress environment compared with others). The selection would create enough variability for the measured the variables (protein, oil, fatty acids, and N, S) to investigate the distribution pattern. The nodes on the main stem were divided into Top, Middle, and Bottom. For example, if there were 15 nodes on the main stem, the nodes would have been divided such that the upper five nodes were considered top third (Top); the following five nodes were the middle third (Middle); the lowest five nodes were the bottom third (Bottom). The number of nodes ranged from 10 to 15. Seed samples were harvested from R6 and R8 plants. R6 seed samples were dried under room temperature. Each cultivar was harvested based on its maturity time, and each cultivar was considered mature when 95% of seed pods on the main stem had been fully matured. 2.1. In Vivo Nitrate Reductase Assay and Seed Nutrient Analysis In all experiments, fully expanded leaves at seed-fill stage (R5-R6) were sampled for nitrate reductase activity (NRA). NRA was measured in the fully expanded leaf according to Hunter [28] and Bellaloui et al. [29]. Briefly, approximately 0.3 g of fully expanded leaf at R5-R6 was placed in 10 mL of potassium phosphate buffer at a con- centration of 100 mM, pH 7.5, containing 1% (v/v) 1- propanol, in the flask. The incubation solution was va- cuum filtered for 1 min, and the flask and contents were flashed with nitrogen gas for 30 s and then incubated at 30°C. A sample of 0.5 mL was taken at regular intervals (0, 60, 120, 180, and 300 min) for nitrite determination. Samples were extracted with 5 mL of deionized water and reacted with 1.0 mL of 1% (w/v) sulfanilamide in 10% v/v HCl and 1.0 mL of N-naphthyl-(1)-ethylenediamine dihy- drochloride (0.1%). After 30 min, the samples were read at 540 nm using a Beckman Coulter DU 800 spectropho- tometer (Fullerton, CA). The concentration of nitrite was calculated from a calibration curve made of potassium nitrite (KNO2). To determine potential NRA (PNRA) un- der conditions when nitrate concentration would not be a limiting factor, exogenous nitrate in form of KNO3 was added to the incubation solution at a concentration of 10 mM. The seed samples were analyzed at The University of Georgia’s Soil, Plant, and Water Laboratory, Athens, GA, to determine N and S concentration. Measurements of N an S were conducted on a 0.25 g sample of soil using an elemental analyzer. 2.2. Chlorophyll Concentrations Chlorophyll measurements were made on fully ex- panded leaf at R5-R6. Leaves were sampled from four randomly selected soybean plants that were additionally planted for chlorophyll and NRA. Chlorophyll was ex- tracted according to Hiscox and Israelstam [30]. Chloro- phyll concentration was determined spectrophotometri- cally using a Beckman Coulter DU 800 spectrophotome- ter (Fullerton, California, U.S.A.). Chlorophyll concentra- tion was calculated using the equation of Arnon [31] and expressed as milligrams of chlorophyll per gram of leaf fresh weight. 2.3. Protein, Oil, and Fatty Acids Analysis Seeds from each replicate and from each treatment were sampled and analyzed for seed composition using near-infrared (NIR) reflectance diode array feed analyzer (Perten, Spring Field, IL, U.S.A.) for protein, oil, fatty acids [29,32]. Calibrations were developed by Perten us- ing Thermo Galactic Grams PLS IQ. The calibration curve has been regularly updated from six months to one year for unique samples according to AOAC methods [33,34]. The analysis was performed on the basis of per- cent dry matter [29]. 2.4. Statistical Analysis Treatments were arranged in a split plot design with four replications. Cultivar was a main plot, stage (R6 and R8) was a sub-plot, and position (Top, Middle, and Bot- tom) was a sub-sub-plot. Analysis of variance using Proc Mixed was conducted using a split plot model using SAS [35]. Level of significance was at P ≤ 5%. Since the two experiments were significantly different in a preliminary analysis (data not shown), as expected, each experiment 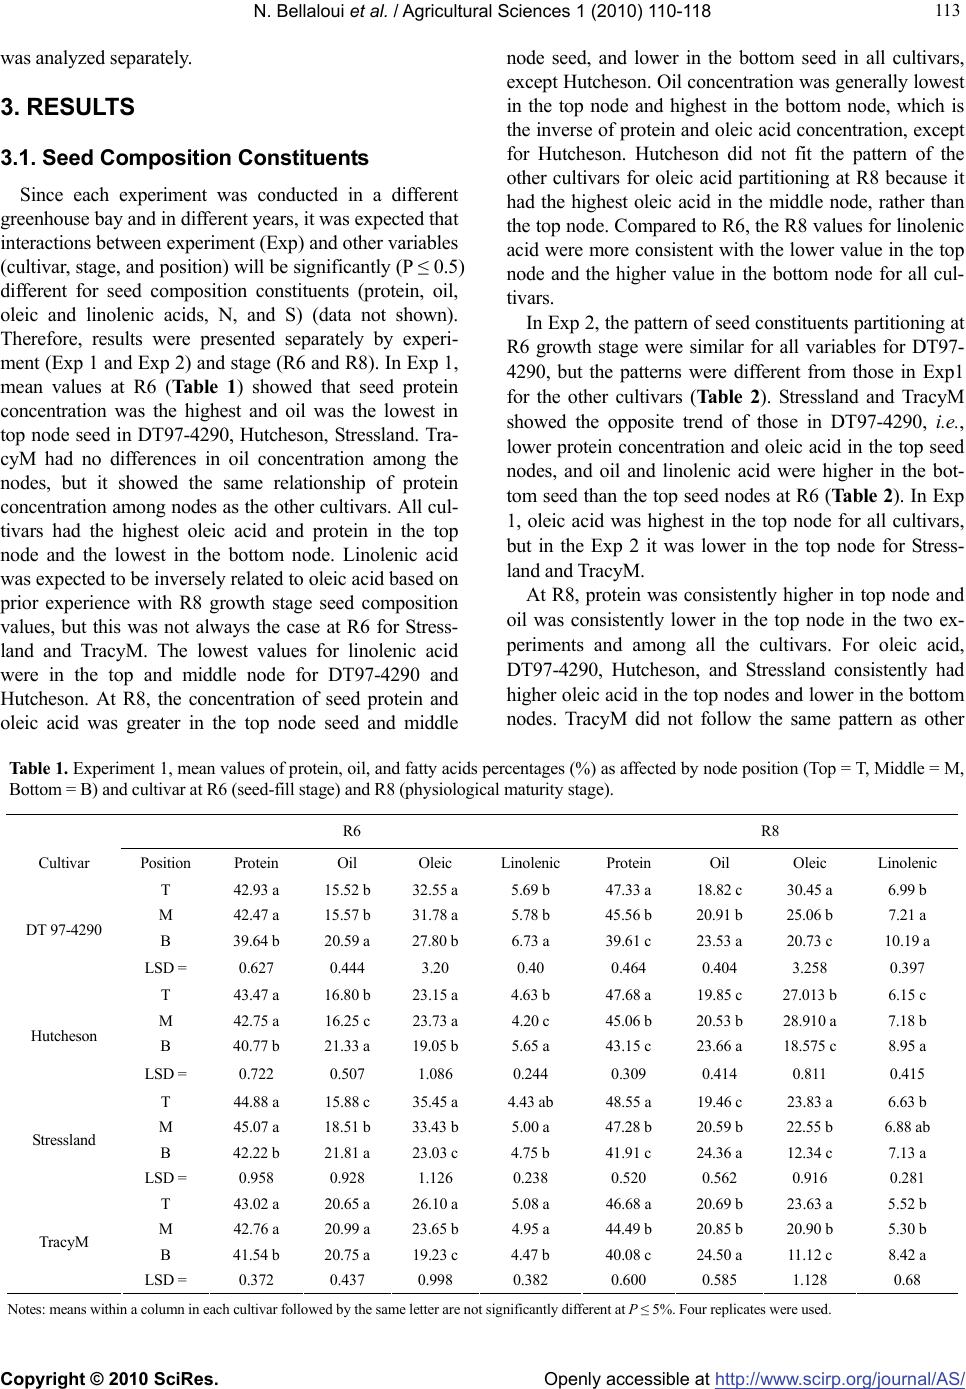 N. Bellaloui et al. / Agricultural Sciences 1 (2010) 110-118 Copyright © 2010 SciRes. Openly accessible at http://www.scirp.org/journal/A S/ 113 113 was analyzed separately. 3. RESULTS 3.1. Seed Composition Constituents Since each experiment was conducted in a different greenhouse bay and in different years, it was expected that interactions between experiment (Exp) and other variables (cultivar, stage, and position) will be significantly (P ≤ 0.5) different for seed composition constituents (protein, oil, oleic and linolenic acids, N, and S) (data not shown). Therefore, results were presented separately by experi- ment (Exp 1 and Exp 2) and stage (R6 and R8). In Exp 1, mean values at R6 (Table 1) showed that seed protein concentration was the highest and oil was the lowest in top node seed in DT97-4290, Hutcheson, Stressland. Tra- cyM had no differences in oil concentration among the nodes, but it showed the same relationship of protein concentration among nodes as the other cultivars. All cul- tivars had the highest oleic acid and protein in the top node and the lowest in the bottom node. Linolenic acid was expected to be inversely related to oleic acid based on prior experience with R8 growth stage seed composition values, but this was not always the case at R6 for Stress- land and TracyM. The lowest values for linolenic acid were in the top and middle node for DT97-4290 and Hutcheson. At R8, the concentration of seed protein and oleic acid was greater in the top node seed and middle node seed, and lower in the bottom seed in all cultivars, except Hutcheson. Oil concentration was generally lowest in the top node and highest in the bottom node, which is the inverse of protein and oleic acid concentration, except for Hutcheson. Hutcheson did not fit the pattern of the other cultivars for oleic acid partitioning at R8 because it had the highest oleic acid in the middle node, rather than the top node. Compared to R6, the R8 values for linolenic acid were more consistent with the lower value in the top node and the higher value in the bottom node for all cul- tivars. In Exp 2, the pattern of seed constituents partitioning at R6 growth stage were similar for all variables for DT97- 4290, but the patterns were different from those in Exp1 for the other cultivars (Table 2). Stressland and TracyM showed the opposite trend of those in DT97-4290, i.e., lower protein concentration and oleic acid in the top seed nodes, and oil and linolenic acid were higher in the bot- tom seed than the top seed nodes at R6 (Table 2). In Exp 1, oleic acid was highest in the top node for all cultivars, but in the Exp 2 it was lower in the top node for Stress- land and TracyM. At R8, protein was consistently higher in top node and oil was consistently lower in the top node in the two ex- periments and among all the cultivars. For oleic acid, DT97-4290, Hutcheson, and Stressland consistently had higher oleic acid in the top nodes and lower in the bottom nodes. TracyM did not follow the same pattern as other Table 1. Experiment 1, mean values of protein, oil, and fatty acids percentages (%) as affected by node position (Top = T, Middle = M, Bottom = B) and cultivar at R6 (seed-fill stage) and R8 (physiological maturity stage). R6 R8 Cultivar Position Protein Oil Oleic Linolenic Protein Oil Oleic Linolenic T 42.93 a 15.52 b 32.55 a 5.69 b 47.33 a 18.82 c 30.45 a 6.99 b M 42.47 a 15.57 b 31.78 a 5.78 b 45.56 b 20.91 b 25.06 b 7.21 a B 39.64 b 20.59 a 27.80 b 6.73 a 39.61 c 23.53 a 20.73 c 10.19 a DT 97-4290 LSD = 0.627 0.444 3.20 0.40 0.464 0.404 3.258 0.397 T 43.47 a 16.80 b 23.15 a 4.63 b 47.68 a 19.85 c 27.013 b 6.15 c M 42.75 a 16.25 c 23.73 a 4.20 c 45.06 b 20.53 b 28.910 a 7.18 b B 40.77 b 21.33 a 19.05 b 5.65 a 43.15 c 23.66 a 18.575 c 8.95 a Hutcheson LSD = 0.722 0.507 1.086 0.244 0.309 0.414 0.811 0.415 T 44.88 a 15.88 c 35.45 a 4.43 ab 48.55 a 19.46 c 23.83 a 6.63 b M 45.07 a 18.51 b 33.43 b 5.00 a 47.28 b 20.59 b 22.55 b 6.88 ab B 42.22 b 21.81 a 23.03 c 4.75 b 41.91 c 24.36 a 12.34 c 7.13 a Stressland LSD = 0.958 0.928 1.126 0.238 0.520 0.562 0.916 0.281 T 43.02 a 20.65 a 26.10 a 5.08 a 46.68 a 20.69 b 23.63 a 5.52 b M 42.76 a 20.99 a 23.65 b 4.95 a 44.49 b 20.85 b 20.90 b 5.30 b B 41.54 b 20.75 a 19.23 c 4.47 b 40.08 c 24.50 a 11.12 c 8.42 a TracyM LSD = 0.372 0.437 0.998 0.382 0.600 0.585 1.128 0.68 Notes: means within a column in each cultivar followed by the same letter are not significantly different at P ≤ 5%. Four replicates were used.  N. Bellaloui et al. / Agricultural Sciences 1 (2010) 110-118 Copyright © 2010 SciRes. Openly accessible at http://www.scirp.org/journal/A S/ 114 Table 2. Experiment 2, mean values of protein, oil, and fatty acids percentages (%) as affected by node position (Top = T, Middle = M, Bottom = B) and cultivar at R6 (seed-fill stage) and R8 (physiological maturity stage). R6 R8 Cultivar Position Protein Oil Oleic Linolenic Protein Oil Oleic Linolenic T 44.24 a 16.24 b 31.50 a 5.48 b 47.89 a 19.39 c 27.58 a 5.92 b M 42.67 b 16.30 b 23.91 b 5.63 b 46.30 b 21.72 b 23.66 b 7.46 a B 40.00 c 22.73 a 18.67 c 6.95 a 41.48 c 23.17 a 15.28 c 6.28 b DT 97-4290 LSD = 0.574 0.557 1.33 0.596 0.408 0.522 0.768 1.017 T 43.43 a 15.58 b 23.94 a 5.16 c 47.89 a 17.31 c 20.42 a 7.10 b M 41.81 b 16.52 b 21.58 b 5.82 b 47.48 a 21.91 b 18.50 b 6.55 b B 38.96 c 21.88 a 16.14 c 7.04 a 44.75 b 23.66 a 13.08 c 8.31 a Hutcheson LSD = 0.549 1.346 1.086 0.285 1.123 0.619 1.060 0.588 T 39.91 c 23.58 a 17.19 c 6.32 b 48.60 a 18.81 c 22.30 a 6.37 c M 46.48 a 16.83 c 38.10 a 7.02 a 48.17 b 21.99 b 22.04 a 6.83 b B 44.60 b 17.58 b 31.55 b 6.59 b 42.55 c 24.69 a 11.87 b 7.67 a Stressland LSD = 0.452 0.700 0.992 0.302 0.426 0.414 1.192 0.424 T 39.66 b 22.03 a 21.10 b 8.05 a 47.56 a 20.45 c 22.10 b 6.17 b M 42.21 a 20.68 ab 22.61 a 6.36 b 44.97 b 22.27 b 21.63 b 6.00 b B 42.47 a 21.40 b 22.89 a 6.10 b 42.77 c 23.89 a 23.73 a 7.84 a Tracy LSD = 0.4679 0.8614 3.273 1.1433 0.715 0.780 1.377 0.569 Notes: means within a column in each cultivar followed by the same letter are not significantly different at P ≤ 5%. Four replicates were used. Table 3. Mean values of nitrate reductase activity (NRA, µmol nitrite/g fwt/hour) and chlorophyll concentrations (mg/g fwt) in the fully expanded leaf at R5-R6 (seed fill-stage) in Experiment 1 and experiment 2 as affected by node position (Top = T, Middle = M, Bottom = B) and cultivar. Experiment 1 Experiment 2 Cultivar Position NRA Chlorophyll NRA Chlorophyll T 4.82 a 2.43 a 5.76 a 1.98 a M 4.98 a 2.51 a 5.32 b 2.29 b B 3.31 b 1.69 b 3.45 c 1.53 c DT 97-4290 LSD = 0.3945 0.4404 0.166 0.2726 T 5.47 a 2.86 b 6.01 a 2.86 a M 5.60 a 3.63 a 5.18 b 2.17 b B 3.62 b 1.33 c 3.37 c 1.18 c Hutcheson LSD = 0.3908 0.2293 0.3157 0.2398 T 5.95 a 3.43 a 5.43 a 1.64 c M 5.18 b 3.51 a 5.18 a 3.16 a B 5.43 b 1.81 b 5.43 a 2.53 b Stressland LSD = 0.3408 0.1893 0.3845 0.2395 T 5.55 a 3.25 a 4.62 b 2.16 b M 5.85 a 3.05 a 5.39 a 3.27 a B 3.98 b 1.83 b 5.19 a 2.92 a Tracy LSD = 0.3693 0.2735 0.4662 0.4293 Notes: means within a column in each cultivar followed by the same letter are not significantly different at P ≤ 5%. Four replicates were used.  N. Bellaloui et al. / Agricultural Sciences 1 (2010) 110-118 Copyright © 2010 SciRes. Openly accessible at http://www.scirp.org/journal/A S/ 115 115 cultivars. Linolenic acid was also consistently lower in the top nodes in all cultivars and in both experiments. 3.2. Partitioning of in Vivo Nitrate Reductase Activity, Chlorophyll, and N and S Both nitrate reductase activity (NRA) and chlorophyll concentration were lower in lower leaves than those of upper leaves (Table 3). This pattern was consistent for all cultivar, except for Stressland. Seed N concentrations (Ta- ble 4) showed a pattern of increase from bottom to top node seed in DT97-4290, Hutcheson, and Stressland at R8. This pattern was not shown in Tracy (Table 4). For seed S, only DT 97-4290 showed a pattern of increase from bot- tom to top node seed (Table 4). At R6, the pattern of in- crease from bottom to top node seed was consistent only in DT 97-4290 (Table 4). 4. DISCUSSION Our research showed that two cultivars (DT97-4290, indeterminate, and Hutcheson, determinate) had consis- tent trend in that protein and oleic acid percentage were higher and oil and linolenic acid percentage were lower in upper nodes (Top and Middle) compared with those of lower nodes (Bottom). These results support those found by Escalante and Wilcox [4] for both determinate and indeterminate, and support those found by Collins and Cartter [3] for determinate type only. Stressland, indeter- minate, and TracyM, determinate, showed inconsistency. Patterns of distribution of these constituents are contro- versial, non-consistent. For example, it was reported that seed oil in the lower nodes was higher than those of upper nodes in indeterminate cultivars, and the opposite trend was noticed in determinate cultivars [3]. Escalante and Wilcox [4] found an increase in seed protein from bottom to the top nodes in indeterminate lines, and that the middle nodes had higher seed oil and lower protein on determi- nate cultivars than seeds from either the top or bottom nodes. Escalante and Wilcox [4] also found that the lowest seed protein concentration occurred at lowest nodes in both determinate and indeterminate types. Other research- ers did not show the same observation in that protein concentration of 241 individual seeds from different posi- tions in ‘Forrest’ soybean did not differ between the top third (415 g kg-1) and the bottom third (410 g kg-1) of plants, and these concentrations were higher than the middle third of plants (392 g kg-1) [7]. The seed composi- tion constituent partitioning along the stem may be con- trolled by stem architecture, type of growth (determinate or indeterminate), maturity, and genotype. Since our objective was to understand some of the physiological mechanisms controlling the partitioning of seed composition constituents along the whole plant, it was thought that temperature and light distribution (gra- dient) from top to bottom canopy could be involved. In our experiment, light intensity in the lower canopy (lower Table 4. Mean values of seed N and S percentages in Experiment 1 (Exp 1) and Experiment 2 (Exp 2) as affected by node position (Top = T, Middle = M, Bottom = B) and cultivar at R6 (seed-fill stage) and R8 (physiological maturity stage). Exp1 at R6 Exp 2 at R6 Exp1 at R8 Exp 2 at R8 Cultivar Position N S N S N S N S T 5.28 a 0.55 a 5.82 a 0.64 a 6.91 a 0.57 a 6.34 a 0.50 a DT 97-4290 M 5.45 a 0.50 a 5.45 b 0.60 b 6.83 a 0.47 b 6.63 a 0.55 b B 4.83 b 0.43 b 4.78 c 0.48 c 5.86 b 0.41 c 5.80 b 0.42 c LSD = 0.3222 0.0517 0.2386 0.0359 0.1682 0.026 0.3461 0.0453 T 4.25 c 0.68 a 5.78 a 0.60 b 6.79 a 0.51 a 6.96 a 0.52 b Hutcheson M 4.98 a 0.63 b 5.85 a 2.00 a 6.83 a 0.47 b 6.53 b 0.56 a B 4.68 b 0.65 ab 4.63 b 0.59 b 6.43 b 0.47 b 6.08 c 0.54 ab LSD = 0.1818 0.0351 0.2412 0.70272 0.2448 0.0246 0.3387 0.0337 T 6.05 a 0.50 a 6.12 b 1.89 a 6.70 a 0.48 a 6.77 a 0.56 a Stressland M 5.35 b 0.45 b 7.02 a 2.06 a 6.88 a 0.46 b 6.56 b 0.56 a B 4.53 c 0.35 c 6.86 b 2.04 a 5.81 b 0.35 c 5.20 c 0.54 a LSD = 0.2675 0.0468 0.3188 0.70272 0.2432 0.0174 0.1468 0.0228 T 5.83 a 0.35 a 4.93 a 0.62 a 6.33 b 0.55 b 5.49 a 0.58 a Tracy M 5.95 a 0.30 b 4.61 b 0.63 a 6.69 a 0.56 a 5.17 b 0.58 a B 5.85 a 0.30 b 4.88 a 0.57 b 6.85 a 0.57 a 5.24 b 0.53 b LSD = 0.2725 0.037 0.1491 0.0495 0.1617 0.0146 0.2057 0.021 Notes: means within a column in each cultivar followed by the same letter are not significantly different at P ≤ 5%. Four replicates were used.  N. Bellaloui et al. / Agricultural Sciences 1 (2010) 110-118 Copyright © 2010 SciRes. Openly accessible at http://www.scirp.org/journal/A S/ 116 nodes) was about 500 µmol m-2 s -1 compared with about 2100 µmol m-2 s -1 (about 76% less) of those of upper nodes. Both nitrate reductase activity (NRA) and chloro- phyll concentration were lower than those of upper leaves (Table 3). This pattern was consistent for all cultivar ex- cept for Stressland. Since Stressland was developed for stress environment [36], its response to light intensity due to shade effect could be different. Total seed amino acids, proline, cysteine, and methionine amino acids were 20, 40, 30, 25% higher, respectively (data not shown). Shade ef- fect was reported by other researchers. For example, Burkley et al. [37] found that highly shaded soybean leaves in the high plant density treatment accumulated triacylglycerol up to 25% of total leaf lipid compared to leaves in the upper canopy. They also found that shade did not affect leaf chlorophyll content, but reduced linolenic acid content, which was a companied by a proportional increase in oleic and linoleic acids. They concluded that triacylglycerol accumulation was a result of altered carbon metabolism and not a senescence response. Our results disagreed with Burkley et al. [37] in that chlorophyll con- centration decreased in three cultivars, but not in Stress- land. Recently, Proulx and Naeve [23] showed that shade and pod removal resulted in preferential accumulation of protein over oil, and the altered protein accumulation over oil became more pronounced under shade conditions. It was explained that these effects appeared to be a result of more limited seed oil accrual under shade conditions. Shade treatments have shown different effects on seed size, protein, and oil concentration, and this is because photosynthesis during the seed fill period is the primary source of energy for both seed growth [38,39] and N as- similation via NO3 – uptake and N2 fixation [22]. Therefore, inhibition of photosynthesis rate during seed-fill period can limit C and N assimilation, leading to reduced seed yield and accrual seed protein and oil. Other reports showed that shade reduced yield and seed size with no effect on protein [40], reduced yield with no effect on seed size, protein, or oil [41], or reduced yield with variable effects on seed size, protein, and oil [42]. Our results showed that the activity of nitrate reductase consistently increased from bottom to top nodes in all cultivars, except in Stressland. This indicates that nitrate assimilation is lower in the bottom of the canopy, and this may be due to low photosynthesis rate promoted by lower light intensity in the lower canopy due to shade. Adding exogenous nitrate to the incubation solution resulted in a significant increase of NRA, especially in lower leaves (increase of 35% comparing to the upper node leaves). The higher increase of NRA in lower leaves, when ex- ogenous nitrate was added, than the upper leaves indicated lower nitrate availability for maximum NRA as indicated by others [43,44]. The lower activity of nitrate reductase (NR) in lower node leaves could be a result of inhibition of de novo synthesis of NR molecules due to less light intensity as light is a source of the reducing power (NADPH). Therefore, the partitioning of seed composi- tion constituents along the main stem could be partially due to nitrogen assimilation, lower chlorophyll concentra- tion, and different maturity times of individual pods along the main stem. More work is needed to identify the rela- tionships between these factors and seed composition. Seed N and S concentrations pattern at R8 appear to be more indicative for final N and S concentration status in seed than at R6. Therefore, seed N or S at R6 may not reflect the total seed N and S at R8. The increase of N and S from bottom to top nodes was accompanied by the in- crease of protein and oleic acid, especially in DT97-4290 and Stressland. Previous studies reported that N and S mobilization from vegetative tissues to seed could be a limiting factor for seed constituent accumulation. This is because seed protein requires a high demand of mobiliza- tion of stored N in vegetative tissues [7,8] and S [9]. Also it was found that mobilization of S to seed depended on the quantity of S stored in leaf tissue [23]. The increase in total seed amino acids, proline amino acid, and cysteine and methionine (Sulfur amino acids) (data not shown) is significant observation that may contribute to the inter- pretation of seed composition constituent distribution along the main stem, but further research is needed. Therefore, NRA and chlorophyll concentrations could explain the partitioning of seed constituents along the main stem. However, seed constituents partitioning could be explained by seed N at R8 only in some cultivars such as DT97-4290 and Hutcheson, and by seed S in only DT97-4290, indicating that using seed N and S at R6 or R8 to explain constituents partitioning cannot be general- ized. 5. CONCLUSIONS The current research suggests that the partitioning of protein, oil, and fatty acids concentration along the main stem depended on the position of nodes on the main stem, cultivar differences, and light intensity. Seed protein and oleic acid concentrations were higher in the top nodes, but oil and linolenic acid concentrations were lower in the bottom nodes. This pattern was consistent at R8 stage compared with R6, indicating that R8 is more indicative for final seed composition status, and the full period from R6-R8 is important for achieving maximum accumulation of seed composition constituents. Cultivar Stressland did not follow the same trend as other cultivars, especially at R6, indicating that stress tolerance cultivars such as Stressland may pose a different mechanism for seed con- stituent partitioning. Higher protein and oil are obtained at  N. Bellaloui et al. / Agricultural Sciences 1 (2010) 110-118 Copyright © 2010 SciRes. Openly accessible at http://www.scirp.org/journal/A S/ 117 117 R8, but oleic acid accumulation was greater at R6, except for Hutcheson, reflecting the effect of cultivar differences and stage on oleic acid accumulation. Pattern differences in N and S along the main stem among cultivars may de- pend on N and S requirements of each cultivar, which is genetically controlled. Further studies are needed to in- vestigate the relationships between N and S supply and uptake, and seed composition constituent accumulation, especially amino acids. This knowledge provides with further understanding of the dynamics of nutrient distribu- tion and seed composition constituents. Also, the current research is useful for soybean germplasm and pod selec- tion for desirable traits such protein and oleic acid and for accurate measurements of seed composition constituents in breeding lines. 6. ACKNOWLEDGEMENTS The authors are thankful to Sandra Mosley for seed composition analysis. We are also thankful to Debbie Boykin for statistical assistance. This research was funded by United States Department of Agriculture, Agricultural Research Service, project number is 6402-21000-034-000. REFERENCES [1] United States Department of Agriculture, Foreign Agri- cultural Service. Oilseeds: World markets and trade. Re- port 2008, Circular Series FOP 11–08.USDA-FAS, Washington, DC. [2] Hurburgh, C.R., Brumm, T.J., Guinn, J.M. and Hartwig, R.A. (1990) Protein and oil patterns in U.S. and world soybean markets. Journal of the American Oil Chemists’ Society, 67, 966-973. [3] Collins, F.I. and Cartter, J.L. (1956) Variability in chemical composition of seed from different portions of the soybean plant. Agronomy Journal, 48, 216-219. [4] Escalante, E.E. and Wilcox, J.R. (1993) Variation in seed protein among nodes of normal- and high-protein soy- bean genotypes. Crop Science, 33, 1164-1166. [5] Escalante, E.E. and Wilcox, J.R. (1993) Variation in seed protein among nodes of determinate and indeterminate soybean near-isolines. Crop Science, 33, 1166-1168. [6] Bennett, J.O., Krishnan, A.H., Wiebold, W.J. and Krish- nan, H.B. (2003) Positional effect on protein and oil content and composition of soybeans. Journal of Agri- culture and Food Chemistry, 51, 6882-6886. [7] Huskey, L.L., Snyder, H.E. and Gbur, E.E. (1990) Analy- sis of single soybean seeds for oil and protein. Journal of the American Oil Chemists’ Society, 67(10), 165-167. [8] Sinclair, T.R. and DeWitt, C.T. (1975) Photosynthate and nitrogen requirements for seed production by various crops. Science, 189, 565-567. [9] Shibles, R. and Sundberg, D.N. (1998) Relation of leaf nitrogen content and other traits with seed yield of soy- bean. Plant Production Science, 1, 3-7. [10] Anderson, J.W. and Fitzgerald, M.A. (2001) Physiologi- cal and metabolic origin of sulfur for the synthesis of seed storage proteins. Journal of Plant Physiology, 158, 447-456. [11] Warembourg, F.R. and Fernandez, M.P. (1985) Distribu- tion and remobilization of symbiotically fixed nitrogen in soybean (Glycine max) Physiologia Plantarum, 65, 281-286. [12] Kurdali, F., Kalifa, K. and Al-Shamma, M. (1997) Culti- var differences in nitrogen assimilation, partitioning and mobilization in rain-fed lentil. Field Crops Research, 54, 235–243. [13] Westermann, D.T., Porter, L.K. and O’Deen, W.A. (9185) Nitrogen partitioning and mobilization patterns in bean plants. Crop Science, 25, 225-229. [14] Dekhuijzen, H.M. and Verkerke, D.R. (1984) Uptake, distribution and redistribution of 15nitrogen by Vicia faba under field conditions. Field Crops Reserach, 8, 93-104. [15] Panthee, D.R., Pantalone, V.R., Sams, C.E., Saxton, A.M., Westa, D.R. and Rayford, W.E. (2004) Genomic regions governing soybean seed nitrogen accumulation. Journal of the American Oil Chemists’ Society, 81(1), 77-81. [16] Hanway, J.J. and Weber, C.R. (1971) Accumulation of N, P, and K by soybean (Glycine max (L.) Merrill) plants. Agronomy Journal, 63, 406-408. [17] Vasilas, B.L., Nelson, R.L., Fuhrmann, J.J. and Evans, T.A. (1995) Relationship of nitrogen utilization patterns with soybean yield and seed fill. Crop Science, 35, 809-813. [18] Buchanan, B.B., Gruissem, W. and Jones, R.L. (2000) Biochemistry and molecular biology of plants. American Society of Plant Physiology, Rockville, Maryland. [19] Loberg, G.L., Shibles, R., Green, D.E. and Hanway, J.J. (1984) Nutrient mobilization and yield of soybean geno- types. Journal of Plant Nutrition, 7, 1311-1327. [20] Egli, D.B. and Bruening, W.P. (2007) Nitrogen accumu- lation and redistribution in soybean genotypes with variation in seed protein concentration. Plant and Soil, 301, 165-172. [21] Egli, D.B., Meckel, L., Phillips, R.E., Radcliffe, D. and Leggett, J.E. (1983) Moisture Stress and N Redistribution in Soybean. Agronomy Journal, 75, 1027-1031. [22] Harper, J.E. (1987) Nitrogen metabolism. In: Wilcox, J. R., Ed., 2nd Edition, Soybeans: Improvement, Production, and Uses, ASA, CSSA, and SSSA, Madison, pp. 497-533. [23] Proulx, R.A. and Naeve, S.L. (2009) Pod removal, shade, and defoliation effects on soybean yield, protein, and oil. Agronomy Journal, 101, 971-978. [24] Naeve, S.L. and Shibles, R.M. (2005) Distribution and mobilization of sulfur during soybean reproduction. Crop Science, 45, 2540-2551. [25] Sweeney, D.W. and Granade, G.V. (1993) Yield, nutrient, and soil sulfur response to ammonium sulfate fertiliza- tion of soybean cultivars. Journal of Plant Nutrition, 16, 1083-1098. [26] Sexton, P.J., Paek, N.C. and Shibles, R. (1998) Soybean sulfur and nitrogen balance under varying levels of available sulfur. Crop Science, 38, 975-982. [27] Hanway, J.J. and Weber, C.R. (1971) Accumulation of N, P, and K by soybean (Glycine max (L.) Merrill) plants. Agronomy Journal, 63, 406-408. [28] Hunter, W. (1985) Soybean stem in vivo nitrate reductase activity. Annals of Botany, 55, 759-761.  N. Bellaloui et al. / Agricultural Sciences 1 (2010) 110-118 Copyright © 2010 SciRes. Openly accessible at http://www.scirp.org/journal/A S/ 118 [29] Bellaloui, N., Reddy, K.N., Zablotowicz, R.M. and Mengistu, A. (2006) Simulated glyphosate drift influ- ences nitrate assimilation and nitrogen fixation in non- glyphosate-resistant soybean. Journal of Agriculture and Food Chemistry, 54, 3357-3364. [30] Hiscox, J.D. and Israelstam, G.F. (1979) A method for the extraction of chlorophyll from leaf tissues without mac- eration. Canadian Journal of Botany, 57, 1332-1334. [31] Arnon, D.I. (1949) Copper enzymes in isolated chloro- plasts: Polyphenoloxidase in Beta vulgaris. Plant Physi- ology, 24, 1-15. [32] Bellaloui, N., Zablotowicz, R.M., Reddy, K.N. and Abel, C.A. (2008) Nitrogen metabolism and seed composition as influenced by glyphosate application in glyphosate- resistant soybean. Journal of Agriculture and Food Chemistry, 56, 2765-2772. [33] AOAC (1990a) Method 988.05. In: Helrich, K., Ed., 15th Edition, Official Methods of Analysis, The Association of Official Analytical Chemists, Inc., Arlington. [34] AOAC (1990b) Method 920.39. In: Helrich, K., Ed., 15th Edition, Official Methods of Analysis, The Association of Official Analytical Chemists, Inc., Arlington. [35] SAS (2001) SAS 9.1 TS level 1M3. Windows version 5.1.2600, SAS Institute, Cary. [36] Cooper, R.L., Martin, R.J., St. Martin, S.K., Calip-Du- bois, A., Fioritto, R.J. and Schmitthenner, A.F. (2001) Registration of ‘Croton 3.9’ Soybean. Crop Science, 41, 588. [37] Burkey, K.O., Wilson, R.F. and Wells, R. (1997) Effects of canopy shade on the lipid composition of soybean leaves. Physiologia Planarum, 101, 591-598. [38] Shibles, R., Secor, J. and Ford, D.M. (1987) Carbon as- similation and metabolism. In: Wilcox, J.R., Ed., 2nd Edition, Soybeans: Improvement, Production, and Uses, ASA, CSSA, and SSSA, Madison, 535-588. [39] Wardlaw, I.F.T. (1990) Review no. 27. The control of carbon partitioning in plants. New Phytololy, 116, 341-381. [40] Lawn, R.J. and Brun, W.A. (1974) Symbiotic nitrogen fixation in soybeans. I. Effect of photosynthetic source- sink manipulations. Crop Science, 14, 11-16. [41] Andrade, F.H. and Ferreiro, M.A. (1996) Reproductive growth of maize, sun-flower and soybean at different source levels during grain filling. Field Crops Research, 48, 155-165. [42] Wahua, T.A.T. and Miller, D.A. (1978) Effects of shading on the N2–fixation, yield, and plant composition of field-grown soybeans. Agronomy Journal, 70, 387-392. [43] Bellaloui, N., Abbas, H.K., Gillen, A.M. and Abel, C.A. (2009a) Effect of glyphosate−boron application on seed composition and nitrogen metabolism in glyphosate-re- sistant soybean. Journal of Agriculture and Food Chem- istry, 57, 9050-9056. [44] Bellaloui, N., Reddy, K.N., Zablotowicz, R.M., Abbas, H.K. and Abel, C.A. (2009b) Effects of glyphosate ap- plication on seed iron and root ferric (III) reductase in soybean cultivars. Journal of Agriculture and Food Che- mistry, 57, 9569-9574. |