Theoretical Economics Letters
Vol.08 No.03(2018), Article ID:82757,25 pages
10.4236/tel.2018.83044
Transparency and Financing Choices of Family Firms
Muhammad Ishfaq Ahmad1, Muhammad Abubakr Naeem2, Mudassar Hasan1, Muhammad Akram Naseem1, Ramiz Ur Rehman1
1Lahore Business School, The University of Lahore, Lahore, Pakistan
2School of economics and Finance, Massey University, Auckland, New Zealand

Copyright © 2018 by authors and Scientific Research Publishing Inc.
This work is licensed under the Creative Commons Attribution International License (CC BY 4.0).
http://creativecommons.org/licenses/by/4.0/


Received: August 17, 2017; Accepted: February 25, 2018; Published: February 28, 2018
ABSTRACT
Past literature indicates that family firms were different from nonfamily firms in term of performance, governess and disclosure. But there was very little evidence which specified the financial structure of family firm. Maturity and leverage, two proxies are used to examine the financial structure of family firm in this particular study. This study shows that family firms are different from non-family firms in terms of debt maturity and leverage. Moreover, transparency is negatively related to maturity which indicates that more transparency decreases maturity, while family firms have more debt maturity which suggested that family firms are more relying on long-term debt and there is a chance of expropriation in family firms due to less transparency. Furthermore, transparency is positively related with leverage which indicates that more transparency increases leverage, while family firms also have positive relationship with leverage which specifies that more transparency leads family firms’ financial structure more toward debt.
Keywords:
Family Firms, Non-Family Firms, Maturity, Leverage

1. Introduction
Family business can be defined as a business in which two or more family members are involved and ownership of the business remains within the family. Family-owned businesses may be the oldest form of business organization. It is frequently accepted that recent financial crisis in Asia did not happen due to lack in investors’ confidence only, but interestingly, it was also the cause of operative corporate governance deficiency or transparency factor in many operating financial markets of Asia, including individual or family firms on the other side. In preceding years, the regulatory frameworks of economies in East Asia are being reviewed and improved, predominantly in the areas of corporate governance, disclosures, financing choices and transparency, both in terms of public or family corporations [1] .
Economic development view, based on the culture of strong family ties, is not recent and new. The view is linked with the first introductory essay introduced by [2] , indicating the values of culturally robust and predetermined family firms can stopover the development activities of capitalist economies. These economies are dependent mostly on the form of individualist economy and the lack of nepotism. [3] presented another view on this cultural aspect. He specified “amoral familism” as the key source of two factors in the south region of Italy; one is the smaller size of firm on average and other is sluggish development of south economy in Italy as compared to north. Similarly, another research by [4] gave origin to the parallel argument. He identified the societies with people who taught their networks to trust close family relations on one side, plus they also taught their people to distrust those networks who are outside their family on another side. It impedes formal institutions to develop in the society. This cultural aspect impedes the emergence of suboptimal economic corporations, where parents put their effort on keeping the family business operated. The reasons of such decision may depend on the solid sense of responsibility towards other members of the family or it may be a self-centred desire to call their family business a family legacy.
The area of family business directs the attention towards family firm control notion. The control of family firm is identified to be a vital matter in extenuating interests’ conflicts between shareholders and managers, on the issue of control and ownership separation [5] [6] [7] [8] . The firms being controlled by family commonly rely themselves on family legacy notion, or they tend to pass their firm business from generation to next generation. On contrary, [9] gave another idea that major shareholders in family controlled businesses tend to force the company to embrace the policies based on their personal safeties, instead of other minority holders. This indicates the tough side of family firms, as they not only deal with regular requirements as well as opportunities of their family businesses, but they also have to focus specifically on the needs and desires of the owners in family firms.
Family controlled firms can be categorized over two broad explanations of theories; 1) private control benefits, and 2) competitive advantage, private control benefits. Both are different mainly because of shareholders’ group for whom firms tend to maximize value. The assumption of private control benefits states that value maximization factor is only available for family controlled firms who tend to expropriate investors in non-family publicly traded firms [10] . Such investors are better off in family firms as minority shareholders instead of being in non-family firms, but they are worse off if family ownership in firm decides to maximize value for all shareholders of the firm instead of self-concern. On contrary, the hypothesis of competitive advantage states that value for shareholders is maximized for both family controlled firms or non-family publicly traded firms [11] . In simple words, both explanations contribute to economic efficiency but only the assumption of competitive advantage let the value and profit factor of the firm to reflect full reimbursements to all shareholders.
Surprisingly, though family controlled firms are largely a recent growing target of interest, still financing choice of these family firms has limited research as much work has been done in the family business success factors [12] [13] [14] . The rareness of research let the researchers to direct their attention towards agency conflicts exists in the family firms and affects the financing decisions and financial structure of firms [15] [16] . Moreover, family firms have greater potential to expropriate minority shareholders or investors as distinction to non-family firms. Therefore, the different financing structures of family and non-family should also the part researched literature onwards. Moreover, along the financing decisions and structures of the firms, the information content assumption has a key role in financing choices of businesses. A noteworthy literature indicates that relative cot of dispensing various securities is affected by information environment and ultimately affecting the capital structure of family firms. This is because capital structure identifies the outsiders’ ability to gather information and control or govern the managers [17] [18] [19] . However, generally the cost of capital of non-family and family firms is likely to be affected by information environment, but particularly, the cost of capital in family firms are reduced to margins by greater transparency factor, due to greater potential of expropriation in family controlled firms. This ultimately causes the financial structures of family firms to be highly influenced by transparency.
Theories states that family controlled firms when more likely focus on expropriation, they will have to depend on the deft financing choice of financing structure more [20] [21] . This is because of the fact that management is difficult to be managed by shareholders due to the problem of free-riders, but it claimed hardly that debt can reduce resources misuse. Further, it is also expected by the researches of [22] [23] that family firms will tend to depend on short term debt more relative to long term debt if they possess greater agency conflicts. Therefore, it is assumed that for any given transparency level, there will be higher leverage ratios and lower maturity of debt. Afterward, reducing expropriation scope will improve transparency and this transparency will ultimately cause family firms to reduce their overall debt financing by issuing equity more and also to upsurge their debt maturity structure. Similarly, the enhancement in transparency will affect the financing structures’ elements of family controlled firms much more than non-family public firms.
The firm transparency is stated as the extent or potential of outsiders to evaluate the operations of firms. In some scenarios it is quite beneficial for firms to have transparency factor and welcome the examination of outsiders. However, it cannot be the case in other scenarios. The study tends to focus specifically on the fact that when family firms’ prospects depending on long period relations with stakeholders, the examination of external outsiders generate costs that reduce value of firms.
Transparency mechanism is an important in corporate governance studies and it is studied in the form of financial and accounting reporting or voluntary disclosures. Traditionally, agency theory perspective has been researched for transparency, whereby the voluntary disclosure perspective of transparency to shareholders is recently getting much attention for aligning the interests of managers and shareholders in family or non-family firms [24] [25] [26] .
The underlying study will investigate the transparency perspective and financing choices perspective of family controlled firms. The study will provide insight regarding the financing choice decisions and financial structures of the family controlled firms or small businesses. Therefore, the current study will be beneficial for both academics and practitioners. The idea of family controlled businesses or firms are a new notion in developing countries like Pakistan. The study will make various contributions to literature. Previous literature has highlighted various characteristics of family controlled businesses. However, very less research in developing countries has been carried out regarding family ownership and its capital structure decisions. Therefore, the preceding research will expand the literature by investigating lower debt maturity level and low leverage levels of family firms operating in Pakistan as compared to non-family firms. Additionally, the study tends to link expensive external finance with potential for minority stakeholders’ expropriation, carried by corporate insiders, in situations of divergence of ownership and control rights. Moreover, how the opacity of information content environment will affect the respective relation will contribute to literature. Based on the described contributions, the study will focus on the following objectives.
The objective of the study highlights the following aspects for underlying study:
・ The study intends to investigate the differences in the financing choices and financial structures of family and non-family firms.
・ The study also intends to describe the transparency measures of family as well as non-family firms according to the financing choices (leverage and debt maturity).
The relevant objectives identify following research questions to be studied further. These research questions provide the door to carry the objectives up to the level of investigation. Subsequent questions are:
1) Does family and non-family firms are different from each other in terms of their financial structure (leverage and debt maturity)?
2) Does family firms are more transparent than non-family firms?
3) Does financial structure (leverage and debt maturity) of family and non-family firms changes in response to transparency?
Section I was based on the introduction chapter. The next Section II will cover the literature review of previous researches. Section III will follow Theoretical, Conceptual Framework and Hypothesis Development. The methodology chapter is discussed in section IV. The results and discussion Sections of methodology based research will be discussed in Section V. And the final section VI will provide the conclusions of the research.
2. Literature Review
The recent crisis in East Asia raises questions regarding the environments of corporate governance, voluntary disclosures and transparency in terms of generating reliable and relevant information. Corporate governance has been viewed as the mathematical structures or devices that tend to check the self-centred behaviour of managers [27] . However, corporate governance has also been argued to be the act of restricting managers from expropriating the shareholders or minority investors [28] . The literature of current study sheds the light on the studies of transparency and financing choices of family and non-family firms, conducted by previous researches over the period of time.
2.1. Family Firms and Corporate Transparency
The family ownership has a key importance in terms of mitigating agency problems, caused by the separation of management and family ownership interests [15] . This issue is specifically addressed by controlling family firms by reducing the conflicts between managers and owner in two ways; 1) direct appointment of any family member on the position of CEO to keep family legacy over long term horizon, and 2) the effective monitoring and supervision of professional executives of the firm, referred to as monitor-in-place argument [29] . Another case indicates the position of controlling shareholders in substantial ownership of firms, in order to derive benefits over minority shareholders’ expense, referred as expropriation dispute. For instance, family members can take the right to engage in the transactions of interrelated party [5] , issuing unusual dividends [30] , freezing out of minority shareholders [31] , or obtaining excessive gains from insider trading [32] .
The expropriation argument, on another side, states that family firms can face lesser corporate transparency if minority shareholders are expropriated by controlling shareholders. However, empirical evidence gives mixed results. [33] and [34] worked on S & P 500 index family firms and explained that these firms have better quality of financial reporting, increased analyst coverage and reduced bid-ask spreads. Also, [34] was of the view that in S & P 500 family firms have greater transparency, but this transparency diminishes outside S & P 500 firms. However, [35] stated that family firms of S & P 1500 tend to provide fewer disclosures like earnings forecast or conference calls. On contrary, [36] described family firms to be more opaque compared to non-family firms, among the 2000 leading industrial firms of U.S. These mixed results confirm both monitor-in-place and expropriation arguments in their respective places. These outcomes, however, at first instinct appears to be conflicting, but they can be explained in a way that disclosure incentives of family firms are affected more by firm size relative to non-family firms. Moreover, [36] stated that family firms in S & P 500 with greater family ownership possess greater Tobin’s Q as compared to non-family entities. Yet, no value premium had been reported outside these high transparent entities.
The general as well as specific literature is present regarding transparency effects on firm value. It requires the examination of link between information generation and capital structure. [37] particularly argued that family firms are subjected to increased examination when they are enforced to pay high segment of their cash flows, because of their need for external capital. Such investigation ultimately benefits family firms in the form of reducing agency conflicts between managers and shareholders. [21] argument of free cash flows also implicitly explains the investigation of family firms associated with existing debt’s renegotiations and refinancing. The argument states that negative NPV investments are difficult to carry due to high level of leverage and it cannot be internally financed. Another study conducted by [38] examined the relationship between structure of capital and firm securities’ liquidity. The study also examined that different incentives are produced by various capital structures for generating the firm’s information. The outcomes showed that firm value is improved by high transparency.
2.2. Financing Choices of Family Firms
A brief literature is present on family firms’ structure of capital and financing choices. [5] conducted study on S & P 500 firms and investigated the effect of family firms, ownership shares and CEO status (founder, heir or hired) on firm leverage ratios. No difference was reported between the leverage of family and non-family firms. Similarly, [5] examined directly the effects of founding family ownership on cost of debt. The outcomes described that family firms have lower financing of cost of debt as compared to non-family firms and less cost of debt lowers the agency costs of founding family firms, considering firm relevant and industry characteristics.
The financing choices of founding family controlled firms are likely to be affected by higher risk of expropriation as compared to non-family firms. The arguments presented by [15] and [20] suggested that agency costs of family firms linked with equity financing can be reduced if they depend more on debt financing. Moreover, the members of founding families have incentives to employ higher debt financing over equity one. This is done in order to avoid the risk of their ownership liquidation [5] . Further, based on debt financing even, [22] [23] and [39] implied that arguments that short term financing will be more followed by family firms if well-timed information is demanded by the creditors. Additionally, management in family firms is disciplined by the mechanisms of liquidation and intervention threat. These mechanisms also enable the lenders to recover value from firm’s investments. However, additional costs can occur due to overreliance on certain finance types. For instance, liquidity risk can occur due to increased short term debt [23] Similarly, increased long term debt financing over equity financing and greater level of leverage ratios can cause overhang debt or increased indirect financial distress costs.
2.3. Debt Maturity
The determinants and theories structure of debt maturity present a sizeable literature. [39] argued that management can be monitored effectively through short term debt financing. The arguments base on the concepts that in case of less transparency of family firms, the information or agency issues can be mitigated by short term debt financing. However, the dark side of short term debt was also examined [40] . When a firm’s information is attained by lenders, the respective information can be used to threaten liquidation due to insufficient cash flows. Such situation creates the problem of information monopoly. In respective situations, incentives of ex ante effort can be distorted by the threat of liquidation. [41] in his study stresses the information asymmetry over monitoring. [42] examined that debt maturity levels increases with low asymmetry in information and the results confirmed the hypothesis for the sample of large U.S banks’ commercial loans. [19] investigated secondary market syndicated loans and described that the subsequent debt cost issues tend to get affected by bid-ask spreads. The study also reported that more asymmetry in information decreases the maturity level of debt.
The debt financing structure of firms also includes the agency costs issues. Typically, the agency costs of debt are defined in terms of the problem of risk shifting or asset substitution. Debt or equity complains have a potential conflict in terms of expropriation of wealth of bondholders by controlling shareholders. This is done by investments in much riskier new projects, containing risk more than the existing projects currently held in the asset portfolio of the firm. Such cases direct much gain to shareholders through the payoff of high-risk projects, while most cost is directed to debt-holders [15] . On contrary, option-pricing framework can also be used to examine the potential conflict of interest among security claimants. Call option or equity holdings, are exercised in cases where the value of asset is greater than the debt claim value. The value of option increases by the increase in risk of firms, causing a decline in the debt claim value. Moreover, the problem of shareholder incentives aroused due to outside debt causes the bondholders tend to rely on monitoring devices or defensive covenants for protection from shifts in risk. Yet, such contracts are written and enforced on non-trivial costs. Additionally, with an increase in agency costs of debt, debt-holders’ required premium also increases. Accordingly, high debt costs are faced by the firms due to interest conflicts between bondholders and shareholders (Ronald et al., 2002).
2.4. Leverage
The literature on leverage covers the effects of transparency as well as agency costs on firm capital structure. [15] stated that family firms should reduce their agency costs linked with accounting earnings by relying more on the debt financing capital structure. [20] described that management can mitigate its incentives for cash flow diversion because of control benefits’ loss and transparency threat in the presence of debt. Whereas, [21] argued that agency costs linked with free cash flows can be reduced by debt financing. The information asymmetry between insiders and outsiders in a firm is reduced by corporate transparency. Moreover, more transparent firms rely more on debt over equity financing, as equity is more sensitive than debt from information perspective [43] . Considering the same argument, [44] studied the higher analyst coverage effects of equity on the leverage ratios of the firm, and also on incentive of markets timings, equity insurance size and frequency and the choice of debt equity. The outcomes of the research showed that higher equity analyst coverage is linked with low level of leverage ratios. On contrary, [18] presented the measure of asymmetry in information based on first prime component of various market adverse sections’ microstructure measures. Firms having higher information asymmetry examined to have higher ratios of debt.
Grounded on the rudimentary intuition that firms relations with stakeholders can be affected by disclosure of information, the transparency and ultimately leverage seemed to be costly, especially when; 1) the development of human capital of certain workers and hence their retaining cost, rely on necessary investments that are not contractible, 2) the effort of worker is a crucial input and this input effort reduces if workers start on believing that their employer will not a leader anymore an 3) firms have opportunities of investments dependent on external financing [5] .
The relevant previous literature of the study presents mixed and controversial arguments. But still there is always a need of additional research on the subject with the additional of important gap. Therefore, the research continues.
2.5. Theoretical, Conceptual Framework and Hypothesis Development
1) Theoretical Framework
Literature review described every aspect of the concepts related to family and non-family firms’ relationship and their financing choices in the form of maturity level of debt or leverage ratios, based on the transparency measures as well. Next step is the identification of most relevant literature to the selected variables of current research.
2) Conceptual Framework (Figure 1 & Figure 2)
3) Expectations
Past literature indicate that family firms (FF) are negatively related with sale, market value (MV) and Return on asset (ROA), suggested that family firms had
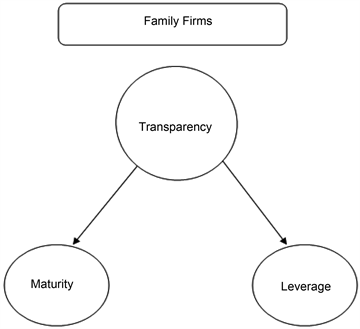
Figure 1. Conceptual framework.

Figure 2. Family firms conceptual framework.
less market value and sale as compare to non-family firms [36] . While Cash sufficiency (CSUF) and Board Independence1 (BEXE) are positively related with Family firms which indicate that family firms have more cash sufficiency and Non-executive directors [5] (Figure 3).
4) Expectations
Prior literature indicates that Transparency (Tp) was positively related with sale, market value (MV) and Fixed investment (FINV), suggested that transparency increase market value and sale [36] . While Cash sufficiency (CSUF) and Board Independence1 (BEXE) were negatively related with Transparency which indicate that transparency decrease cash sufficiency and Non-executive directors [45] (Figure 4).
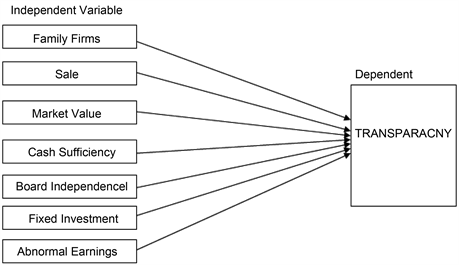
Figure 3. Transparency conceptual framework.

Figure 4. Maturity conceptual framework.
3. Expectations
Both theories are available in prior literatures which indicate that Transparency (Tp) was positively and negatively related with Maturity (MATU) which point out that when transparency increases, long term liabilities increases and when transparency decreases maturity also decreases [45] .
Family firms also had two expectations regarding long term liabilities which indicate that family firms were more or less rely on long term debt [36] . While all other variables show positive relationship with Maturity (Figure 5).
Both theories are available in prior literature which indicates that Transparency (Tp) positively and negatively related with leverage (LEVE) which specify

Figure 5. Leverage conceptual framework.
that when transparency increase family firms move toward debts, and when transparency decreases family firms move toward Equity financing [45] .
Family firms also had two expectations regarding Leverage which indicate that family firms are more or less rely on leverage, moreover when transparency increases family firms more move toward leverage and vice versa [36] . While all other variables show positive relationship with Maturity.
3.1. Hypothesis Development
The literature described above reflects the differences in the potential of expropriation or agency conflicts of interest between families controlled as well as non-family firms. It is also examined that information asymmetry based on the transparency concept is generally related to the financing and capital structure choices of family controlled firms. Therefore, the hypotheses of present study are developed on the notion of difference of financing structures and choices of family and non-family firms for a level of transparency and how these differences tend to affect changes in transparency measure. Following hypotheses are developed based on the research questions and theoretical framework.
3.2. Hypotheses
H1: Family Firms and non-family firms are different from each other.
H2: Family firms and non-family firms have significant different financial structure.
H3: There is no significant relationship between transparency and financial structure of Family firms.
H4: There is a significant positive relationship between transparency and debt maturity of Family firms.
H5: For a given level of transparency, family firms have higher debt maturity and lower Leverage ratio.
For the testing of the hypothesis we applied OLS regression analysis.
4. Methodology
4.1. Sample Selection and Data Collection
The current study is an explanatory study based on quantitative research. Population is all non-financial companies listed on Pakistan Stock Exchange (PSE). Multistage Sampling technique is used in this particular study to select sample. First Stratified random sampling is used; while all non-financial sector of Pakistan stock exchange is used as stratum, further Proportionate stratified Random Sampling is used in which the sample size of each stratum is proportionate of total population size. Moreover convenience sampling is used to select family firm in each stratum. Eighty manufacturing companies listed on PSE is the sample of this study. Six years’ data is used for analysis, which is from Jan. 1, 2009 to Dec. 31, 2014.
SBP data index and open door is used for the collection of financial statement data, while closing price data is collected from PSE.MS Excel 2013 and STATA 12 is used as Data Analysis Software.
4.2. Regression Models
An important variable of the current study is family firm. Family firms are defined to be the firms having ownership control on the firm. Such firms tend to keep their family legacy by transferring their business to next generations. Logistic regression is used to predict Model 1, as earlier research indicates that when variable depended is binary used logistic regression [46] .
where
FFit = Family Firms each firm i at time t.
MVit = Market value each firm i at time t.
ROAit = Return on Assets each firm i at time t.
BEXEit = Board Independence1 each firm i at time t.
Uit each firm i at time t.
Another noteworthy variable of study is transparency. Transparency is described as the extent to which the outsiders are able to examine or investigate the actions of the firms. It is also considered as the perceived quality of information shared publically and internationally from the firms [19] . To see the impact of Tp on other selected variable we derive this model.
where
Tpit = Transparency each firm i at time t.
MVit = Market value each firm i at time t.
FINVit = Fixed Investment each firm i at time t.
AEARit = Abnormal Earnings each firm i at time t.
FFit = Family Firms each firm i at time t.
BEXEit = Board Independence1 each firm i at time t.
CSUFit = Cash sufficiency each firm i at time t.
Uit = Error of each firm i at time t.
Debt maturity is another variable based on the financing choices of family control firms or non-family publically traded firms. Debt maturity indicates the maturity date under which the principal is due to be paid. This term is applicable to any form of instrument of finance that requires the payment of loan on the fixed determined date [47] .
where
MATUit = Maturity each firm i at time t.
FFit = Family Firms each firm i at time t.
MVit = Market value each firm i at time t.
ROAit = Return on Assets each firm i at time t.
CFOit = Cash flow from operating activities each firm i at time t.
TP = Transparency each firm i at time t.
CSUFit = Cash sufficiency each firm i at time t.
Uit = Error of each firm i at time t.
Last variable is also related with financing choice of capital structure, called leverage. Leverage is defined as the debt amount that firms tend to use in order to purchase further assets. Therefore, it indicates the degree to which a firm exploits its fixed income securities, like preferred equity or debt [48] .
where
LEVE = Leverage.
FFit = Family Firms each firm i at time t.
MVit = Market value each firm i at time t.
ROAit = Return on Assets each firm i at time t.
MATUit = Maturity each firm i at time t.
5. Results and Discussion
Summary statistic off all variables presented in Table 1, including its mean,

Table 1. Descriptive statistics for all variables.
Standard deviation, minimum and maximum values. This study includes six-year annual data for eighty companies which are from 2009-2014. Total number of observation is 6 × 80 = 480.
Total fifteen variables are included in summery statistics. The mean value of Sale is 23.0866% which indicate that on average every company generate twenty-three percent of revenue from net sale. While minimum value is 16.77 percent and maximum 27.97. MV is 22.4965% on average while minimum and maximum value are 18.19 and 27.74. Mean profit value indicates that on average every company generate 0.4142 percent profit. Mean value of (LEVE) 0.4581 suggest that significant portion of family firms are financed by leverage. (MATU) mean value indicate that on average 0.07424 percent family firms have long term finances above then one year. While minimum and maximum values are −0.00676, 2.9073 respectively. (BIND), (BEXE) mean value indicate on average every firm have 0.1931, 5502 independent and non-executive directors respectively.
Standard deviation values suggest that all variable values are normally distributed and standard deviation is close to their mean, while only (Tp) value show extreme value in all variables.
Table 2 provides the summary statistics for Family firms and Nonfamily firms, including mean and standard deviation which shows the difference between these two. Results indicated that on average Family firms have high (leverage) ratio and lower (maturity) as compare to Nonfamily firms which indicate that family firms capital structure are more toward debt. Further table indicate that family firms have more (transparency) and (BIND) as compare to non-family firms, indicate that family firms are more information asymmetry
Table 2. Difference of mean and standard deviation test for family and non-family firms.
and transparent and have more independent directors. These results are very similar to [5] results.
As expected (Sale) and (MV) is higher for Non family firms, which specify that non family firms holds large percentage of market. Finally results indicate that Family firms have more (VOLT) and rely more on (FINV) moreover it reports less deficit as compare to non family firms These above results are comparable to those previous studies [47] .
While non-family firm shows more (ROA) and (PROF) which indicate that non-family firms on average earn more profit because Non-family firms have more market value and sale as compare to non-family firms.
Standard deviation values suggest all variable values of family and non-family firms are normally distributed and its standard deviation is close to their mean while only (Tp), (CFO) value show extreme value in all variables .which indicate that these variables have extreme values.
Logistic regression is used to predict results in Table 3, as earlier research indicates that when dependent variable is binary used logistic regression [46] .
As per the logistic regression, results indicate that the total number of observations is 480. The Prob > chi2 value for fowling model is 0.0000 which is less than the 0.05 so it is found that the model is significant and correct. As per model 72.4% variations in family firms are explained by independent variable.
The coefficient value for Sale shows negative relationship among (Sale) and family firm, suggesting that when (Sale) change by 1% family firms sale decrease by −0.227%, which specify that family firms has less sale.
The (MV) coefficient value shows negative relationship suggesting that when (MV) change by 1% market value of family firms decreases by −0.1856817%
Table 3. Relationship between family firm and independent variables.
Standard errors in parentheses. ***p < 0.01, **p < 0.05, *p < 0.1.
which specify that family firms has low market value. Coefficient value of (BEXE) also shows negative relationship among family firm which propose that family firms has less Non-executive directors so that family firms are less transparent.
While (CSUF) coefficient shows positive relation which indicates that when (CSUF) change by 1% family firm cash flows tend to change by 0.523%, which shows that family firms generate more cash flows from operating activities. While its individual regression with family firm result shows insignificant “p” value indicate that another mediator variable affects it and make this variable significant in regression model. Following results are in accordance with the results of previous research [32] .
Table 3 and Table 4 show correlation between family firms and other independent variables. CSUF and family firms show moderate uphill relationship which suggest that changes in CSUF and family firm tend to move together. While all other variable shows a weak downhill (negative) linear relationship which indicate that when one variable increases other variable decrease and they capture other different aspects of family firm.
[49] [50] Lagrange multiplier study indicates that OLS regression is most suitable for this particular study. As per OLS regression, results indicate that the total number of observations is 449. The Prob > chi2 value for fowling model is 0.0000 which is less than the 0.05 so it is found that the model is significant and correct. As per r-squared value 0.051% variations in Transparency are explained by following independent variables.
The (MV) coefficient value shows positive relationship suggesting that when (MV) change by 1% transparency increased by 0.0102% which specify that more
Table 4. Correlation between family firms and independent variables.
sale increase transparency. Coefficient value of BEXE shows negative relationship among transparency, which suggest that more non-executive directors decrease transparency.
Sales coefficient shows positive relationship with transparency which indicate if sale change by 1%, transparency increases by 0.00903 suggest that more sale increase transparency. Family firm’s shows positive relationship in regression model with transparency which indicate that family firms increase transparency, while its individual regression result show negative relation with transparency, suggesting that there is another mediator variable which effect their result.
While CSUF coefficient shows negative relation, which indicates that when CSUF change by 1% (Tp) decrease by 0.523%, which indicate that (Tp), decrease more cash flows from operating activities. While its individual regression with family firm result shows insignificant “p” value which indicates that another mediator variable affects him and make this variable significant in regression model. These results are in accordance with past studies [48] (Table 5 and Table 6).
Correlation between Tp, Sale, MV,FINV shows a weak uphill (positive) linear relationship, suggesting that tp and all these variable tend to decrease or increase together. While all other variables show a weak downhill (negative), linear relationship, which indicate that when one variable increase other variable decrease.
Correlation between Tp, Sale, MV, FINV shows a weak uphill (positive) linear relationship, suggesting that tp and all these variable tend to decrease or increase together. While all other variables show a weak downhill (negative), linear relationship, which indicate that when one variable increase other variable decrease.
Estimation results for Model 3 are presented in Table 7. [49] [50] Lagrange multiplier study indicates that OLS Regression is most suitable for this particular study.
As per OLS regression, results indicate that the total number of observations is 466. The Prob > chi2 value for fowling model is 0.0000 which is less than the 0.05 so it is found that the model is significant and correct. As per r-squared value 54.6% variations in Maturity is explained by following independent variables.
Coefficient of transparency show negative relationship with maturity, suggesting that when (Tp) change by 1% debt maturity decreases by −0.0562%,
Table 5. Relationship between transparency and independent variables.
Standard errors in parentheses, ***p < 0.01, **p < 0.05, *p < 0.1.
Table 6. Correlation between transparency and independent variables.
which specifies that more transparency decrease debt maturity.
Coefficient value of family firms show positive relationship among family firm and debt Maturity which specify that 1% change in family firm observed 0.0236% positive changes in debt Maturity, which means that family firms have more debt maturity.
These results also indicate that Family firms are less transparent, so that there is chance of expropriation in family firms. These results are comparable to those of prior studies [e.g., [19] [45] ].
The (MV) coefficient value shows positive relationship suggesting that when
Table 7. Effect of family firm on the relationship between maturity and corporate transparency.
Standard errors in parentheses, ***p < 0.01, **p < 0.05, *p < 0.01.
(MV) change by 1% debt maturity increased by 0.00731 which specify more market value increase debt maturity.
Coefficient value of Sale also shows positive relationship among transparency, which propose that more sale increase debt maturity. While all other variable results are consistent with prior studies [48] (Table 7 and Table 8).
Correlation between debt maturity, Sale, MV, CSUF, ROA, CFO shows a weak uphill (positive) linear relationship, suggesting that debt maturity and all these variable tend to decrease or increase together.
While all other variables show a weak downhill (negative) linear relationship, which indicate that when one variable increase other variable decrease.
Estimation results for equation 4 are presented in Table 9. [49] [50] Lagrange multiplier study indicates that OLS regression is most suitable for that particular study. As per OLS regression, results indicate that the total number of observations is 480. The Prob > chi2 value for fowling model is 0.0000 which is less than the 0.05 so it is found that the model is significant and correct. As per r-squared value 34.1% variations in Maturity is explained by following independent
Table 8. Correlation between effect of family firm on the relationship between maturity and corporate transparency.
Table 9. Effect of family firm on the relationship between leverage and corporate transparency.
Standard errors in parentheses, ***p < 0.01, **p < 0.05, *p < 0.01.
variables.
Coefficient of corporate transparency is show positive relationship, suggesting that when (Tp) change by 1% leverage increase by 0.0430%, which specify that more transparency increase leverage. Coefficient value of family firm also shows positive relationship with leverage which specifies that 1% change in family firms increase leverage by 0.122%. Which reveals that more transparency in family firm leads family firm more toward leverage.
Interaction of family firm and transparency (FF × Tp) coefficient also show positive relationship which specify that when transparency increase in family firms financial structure of family firm more move toward debt then equity. While its individual regression shows insignificant “p” value which indicates that another mediator variable affects it which makes their results significant in regression model. While all other variable result are consistent as prior studies [48] (Table 9 and Table 10).
Correlation between debt maturity, Sale, MV, MATU, ROA, CFO shows a weak down hill (negative) relationship, suggesting that LEVE and all these variable tend to decrease or increase differently.
While all other variables show a weak uphill (positive) linear relationship, which indicate that when one variable increase other variable also increase.
H1: Family Firms and non-family firms are different from each other’s.
Summary statistics for Family firms and Nonfamily firms, including mean and standard deviation shows the difference between these two. Results indicated that Family firms have high (leverage) ratio and lower (maturity) as compare to Nonfamily firms. Further table indicate that family firms have more (transparency) and (BIND) as compare to non-family firms, indicated that family firms are more information asymmetry and have more independent directors. These results are very similar to [5] result.
H2: Family firms and non-family firms have different financial structure.
Summary statistics for Family firms and Nonfamily firms, including mean and standard deviation shows the difference between these two. Results also indicated that Family firms had high (leverage) ratio and lower (maturity) as compare to Nonfamily firms. Which indicate that family firms have more long term debts and for financing it more rely on debt rather than equity.
H3: There is no relationship between transparency and financial structure of Family firm Result specifies that there is a relationship between transparency
Table 10. Correlation, effect of Family firm on the relationship between Leverage and corporate Transparency.
and financial structure of family firms, moreover family firms have more debt maturity and low transparency which suggested that family firms are more relying on long-term debt and there is chance of expropriation in family firms due to less transparency. Following results are in accordance with the results of previous research [32] .
Further result indicates that transparency increase leverage ratio which suggests that the firm which is more transparent would have more leverage. Family firm results also shows positive relationship with leverage which indicates that family firms have more leverage and less rely on equity financing.
H4: There is a positive relationship between transparency and debt maturity of Family firm. Coefficient of transparency is show negative relationship with maturity, suggesting that when (Tp) increases debt maturity decreases which specifies that more transparency decrease debt maturity.
H5: For a given level of transparency, family firms have higher debt maturity and lower leverage ratio. Above results indicate that for a given level of transparency family firms have higher debt maturity and more leverage ratio, which suggested that family firms are more rely on long term debt and family firms financial structure are more toward debt then equity.
6. Conclusions
Significant existing literature indicates that agency cost and information environment affect the financial choices of non-family firm [48] , while there is a little evidence about the financial choices of family firm. This existing study fills that gap and tells how financing choices of family firms are different from non-family firms. Statistical summary results define how family firms are different from non-family firms in term of their mean and standard deviation values, further results indicate that family firms and non-family firms have different financial structures in term of maturity and leverage. Relationship between family firms, maturity and transparency specific that family firms have more debt maturity and low transparency which suggest that family firms are more relying on long-term debt and there is a chance of expropriation in family firms due to less transparency. Following results are in accordance with the results of previous research [32] . Moreover, results specified that for any given level of transparency, the financial structure of family firm is different from non-family firm.
Moreover, results indicate that transparency increase leverage ratio, which suggests the firm that is more transparent would have more leverage. Family firm results also show the positive relationship with leverage which indicates that family firms have more leverage and less rely on equity financing. Interactions of family firms and transparency (FF × transparency) also indicate that when transparency increases in family firms, financial structure of family firm more move toward debt.
7. Limitation of the Research
This study is Pakistan based study and results cannot be generalized. Meanwhile this limitation itself is a motivation for the further research as this idea can be tested for the emerging economies of the Asia and then further future research can be done in terms of the comparison of the emerging economies.
Cite this paper
Ahmad, M.I., Naeem, M.A., Hasan, M., Naseem, M.A. and Rehman, R.U. (2018) Transparency and Financing Choices of Family Firms. Theoretical Economics Letters, 8, 649-673. https://doi.org/10.4236/tel.2018.83044
References
- 1. Ho, S.S. and Wong, K.S. (2001) A Study of the Relationship between Corporate Governance Structures and the Extent of Voluntary Disclosure. Journal of International Accounting, Auditing and Taxation, 10, 139-156. https://doi.org/10.1016/S1061-9518(01)00041-6
- 2. Weber, M. (1904) The Protestant Ethic and the Spirit of Capitalism. Scribner’s Press, New York.
- 3. Banfield, E.C. (1958) The Moral Basis of a Backward Society. Free Press, New York.
- 4. Fukuyama, F. (1995) Trust. Basic Books, New York.
- 5. Anderson, R. C., Mansi, S. A. and Reeb, D. M. (2003) Founding Family Ownership and the Agency Cost of Debt. Journal of Financial Economics, 68, 263-285. https://doi.org/10.1016/S0304-405X(03)00067-9
- 6. Claessens, S., Djankov, S. and Lang, L.H. (2000) The Separation of Ownership and Control in East Asian Corporations. Journal of Financial Economics, 58, 81-112. https://doi.org/10.1016/S0304-405X(00)00067-2
- 7. Fama, E.F. and Jensen, M.C. (1983) Separation of Ownership and Control. The Journal of Law and Economics, 26, 301-325. https://doi.org/10.1086/467037
- 8. Porta, R., Lopez-de-Silanes, F., Shleifer, A. and Vishny, R. (2002) Investor Protection and Corporate Valuation. The Journal of Finance, 57, 1147-1170. https://doi.org/10.1111/1540-6261.00457
- 9. Yeh, Y.H., Lee, T.S. and Woidtke, T. (2001) Family Control and Corporate Governance: Evidence from Taiwan. International Review of Finance, 2, 21-48. https://doi.org/10.1111/1468-2443.00014
- 10. Burkart, M., Panunzi, F. and Shleifer, A. (2003) Family Firms. The Journal of Finance, 58, 2167-2201. https://doi.org/10.1111/1540-6261.00601
- 11. Johansen, B. and Schoar, A. (2006) The Role of Family in Family Firms. The Journal of Economic Perspectives, 20, 73-96. https://doi.org/10.1257/jep.20.2.73
- 12. Astrachan, J.H. and Kolenko, T.A. (1994) A Neglected Factor Explaining Family Business Success: Human Resource Practices. Family Business Review, 7, 251-262. https://doi.org/10.1111/j.1741-6248.1994.00251.x
- 13. Sorenson, R.L. (2000) The Contribution of Leadership Style and Practices to Family and Business Success. Family Business Review, 13, 183-200. https://doi.org/10.1111/j.1741-6248.2000.00183.x
- 14. Morris, M.H., Williams, R.O., Allen, J.A. and Avila, R.A. (1997) Correlates of Success in Family Business Transitions. Journal of Business Venturing, 12, 385-401. https://doi.org/10.1016/S0883-9026(97)00010-4
- 15. Jensen, M.C. and Meckling, W.H. (1976) Theory of the Firm: Managerial Behavior, Agency Costs and Ownership Structure. Journal of Financial Economics, 3, 305-360. https://doi.org/10.1016/0304-405X(76)90026-X
- 16. Berger, P.G., Ofek, E. and Yermack, D.L. (1997) Managerial Entrenchment and Capital Structure Decisions. The Journal of Finance, 52, 1411-1438. https://doi.org/10.1111/j.1540-6261.1997.tb01115.x
- 17. Agarwal, P. and O’Hara, M. (2007) Information Risk and Capital Structure. Working Paper. Cornell University, Ithaca, NY.
- 18. Bharath, S.T., Pasquariello, P. and Wu, G. (2008) Does Asymmetric Information Drive Capital Structure Decisions? The Review of Financial Studies, 22, 3211-3243. https://doi.org/10.1093/rfs/hhn076
- 19. Wittenberg Moerman, R. (2009) The Impact of Information Asymmetry on Debt Pricing and Maturity.
- 20. Grossman, S.J. and Hart, O.D. (1982) Corporate financial structure and managerial incentives. In: McCall, J.J., Ed., The Economics of Information and Uncertainty, University of Chicago Press, Chicago, 107-140.
- 21. Jensen, M.C. (1986) Agency Costs of Free Cash Flow, Corporate Finance, and Takeovers. The American Economic Review, 76, 323-329.
- 22. Harris, M. and Raviv, A. (1990) Capital Structure and the Informational Role of Debt. The Journal of Finance, 45, 321-349. https://doi.org/10.1111/j.1540-6261.1990.tb03693.x
- 23. Diamond, D. W. (1991) Debt maturity structure and liquidity risk. The Quarterly Journal of Economics, 106, 709-737. https://doi.org/10.2307/2937924
- 24. Healy, P.M., Hutton, A.P. and Palepu, K.G. (1999) Stock Performance and Intermediation Changes Surrounding Sustained Increases in Disclosure. Contemporary Accounting Research, 16, 485-520. https://doi.org/10.1111/j.1911-3846.1999.tb00592.x
- 25. Hermanson, H.M. (2000) An Analysis of the Demand for Reporting on Internal Control. Accounting Horizons, 14, 325-341. https://doi.org/10.2308/acch.2000.14.3.325
- 26. Bushman, R.M. and Smith, A.J. (2001) Financial Accounting Information and Corporate Governance. Journal of Accounting and Economics, 32, 237-333. https://doi.org/10.1016/S0165-4101(01)00027-1
- 27. John, K. and Senbet, L.W. (1998) Corporate Governance and Board Effectiveness. Journal of Banking & Finance, 22, 371-403. https://doi.org/10.1016/S0378-4266(98)00005-3
- 28. Mitton, T. (2002) A Cross-Firm Analysis of the Impact of Corporate Governance on the East Asian Financial Crisis. Journal of Financial Economics, 64, 215-241. https://doi.org/10.1016/S0304-405X(02)00076-4
- 29. Demsetz, H. and Lehn, K. (1985) The Structure of Corporate Ownership: Causes and Consequences. Journal of Political Economy, 93, 1155-1177. https://doi.org/10.1086/261354
- 30. DeAngelo, H. and DeAngelo, L. (2000) Controlling Stockholders and the Disciplinary Role of Corporate Payout Policy: A Study of the Times Mirror Company. Journal of Financial Economics, 56, 153-207. https://doi.org/10.1016/S0304-405X(00)00039-8
- 31. Gilson, R.J. and Gordon, J.N. (2003) Controlling Controlling Shareholders. University of Pennsylvania Law Review, 152, 785-843. https://doi.org/10.2307/3313035
- 32. Anderson, R.C., Reeb, D.M. and Zhao, W. (2012) Family-Controlled Firms and Informed Trading: Evidence from Short Sales. The Journal of Finance, 67, 351-385. https://doi.org/10.1111/j.1540-6261.2011.01714.x
- 33. Wang, D. (2006) Founding Family Ownership and Earnings Quality. Journal of Accounting Research, 44, 619-656. https://doi.org/10.1111/j.1475-679X.2006.00213.x
- 34. Ali, A., Chen, T.Y. and Radhakrishnan, S. (2007) Corporate Disclosures by Family Firms. Journal of Accounting and Economics, 44, 238-286. https://doi.org/10.1016/j.jacceco.2007.01.006
- 35. Chen, S., Chen, X.I.A. and Cheng, Q. (2008) Do Family Firms Provide More or Less Voluntary Disclosure? Journal of Accounting Research, 46, 499-536. https://doi.org/10.1111/j.1475-679X.2008.00288.x
- 36. Anderson, R.C., Duru, A. and Reeb, D.M. (2009) Founders, Heirs, and Corporate Opacity in the United States. Journal of Financial Economics, 92, 205-222. https://doi.org/10.1016/j.jfineco.2008.04.006
- 37. Easterbrook, F.H. (1984) Two Agency-Cost Explanations of Dividends. The American Economic Review, 74, 650-659.
- 38. Holmstrom, B. and Tirole, J. (1993) Market Liquidity and Performance Monitoring. Journal of Political Economy, 101, 678-709. https://doi.org/10.1086/261893
- 39. Stulz, R. (2001) Does Financial Structure Matter for Economic Growth? A Corporate Finance Perspective. In: Demirguc-Kunt, A. and Levine, R., Eds., Financial Structure and Economic Growth: A Cross-Country Comparison of Banks, Markets, and Development, MIT Press, Cambridge, MA, 143-188.
- 40. Rajan, R.G. (1992) Insiders and Outsiders: The Choice between Informed and Arm’s-Length Debt. The Journal of Finance, 47, 1367-1400. https://doi.org/10.1111/j.1540-6261.1992.tb04662.x
- 41. Diamond, D.W. (1993) Seniority and Maturity of Debt Contracts. Journal of Financial Economics, 33, 341-368. https://doi.org/10.1016/0304-405X(93)90011-Y
- 42. Berger, A.N., Espinosa-Vega, M.A., Frame, W.S. and Miller, N.H. (2005) Debt Maturity, Risk, and Asymmetric Information. The Journal of Finance, 60, 2895-2923. https://doi.org/10.1111/j.1540-6261.2005.00820.x
- 43. Myers, S.C. and Majluf, N.S. (1984) Corporate Financing and Investment Decisions When Firms Have Information That Investors Do Not Have. Journal of Financial Economics, 13, 187-221. https://doi.org/10.1016/0304-405X(84)90023-0
- 44. Chang, X., Dasgupta, S. and Hilary, G. (2006) Analyst Coverage and Financing Decisions. The Journal of Finance, 61, 3009-3048. https://doi.org/10.1111/j.1540-6261.2006.01010.x
- 45. Faccio, M., Lang, L.H. and Young, L. (2001) Dividends and Expropriation. American Economic Review, 91, 54-78. https://doi.org/10.1257/aer.91.1.54
- 46. Hosmer Jr, D.W., Lemeshow, S. and Sturdivant, R.X. (2013) Applied Logistic Regression. Vol. 398, John Wiley & Sons, Hoboken, NJ. https://doi.org/10.1002/9781118548387
- 47. Datta, S., Iskandar-Datta, M.A.I. and Raman, K. (2005) Managerial Stock Ownership and the Maturity Structure of Corporate Debt. The Journal of Finance, 60, 2333-2350. https://doi.org/10.1111/j.1540-6261.2005.00800.x
- 48. Chang, X.S., Chen, Y. and Dasgupta, S. (2014) Macroeconomic Conditions and Firms’ Financing Decisions: A Reinvestigation. Working Paper. Hong Kong University of Science and Technology, Tsinghua University and Nanyang Business School.
- 49. Mutl, J. and Pfaffermayr, M. (2011) The Hausman Test in a Cliff and Ord Panel Model. The Econometrics Journal, 14, 48-76. https://doi.org/10.1111/j.1368-423X.2010.00325.x
- 50. Breusch, T.S. and Pagan, A.R. (1980) The Lagrange Multiplier Test and Its Applications to Model Specification in Econometrics. The Review of Economic Studies, 47, 239-253. https://doi.org/10.2307/2297111