Paper Menu >>
Journal Menu >>
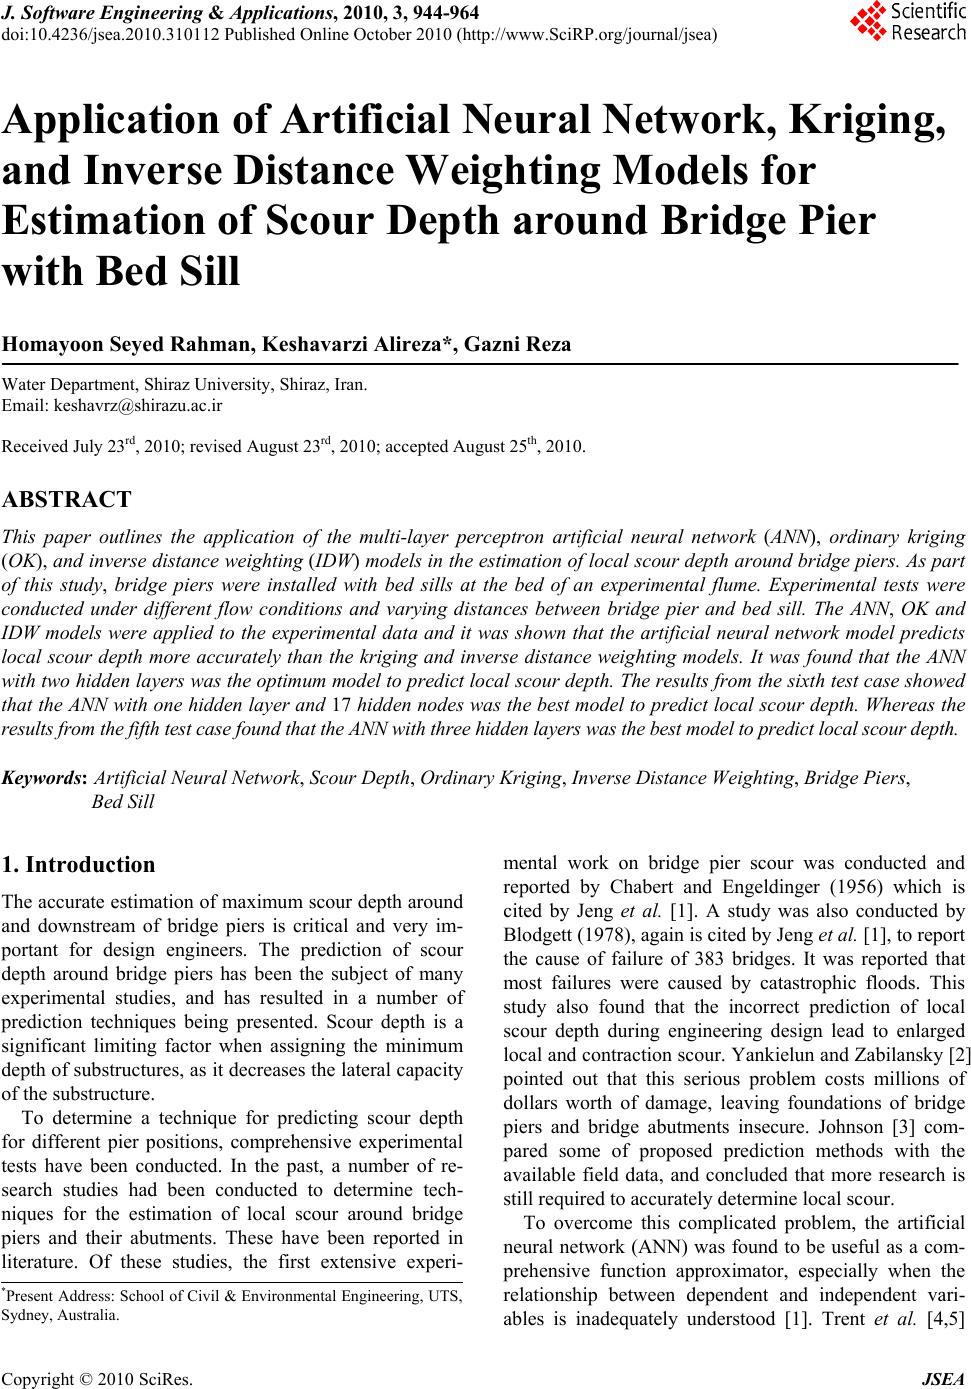 J. Software Engi neeri n g & Applications, 2010, 3, 944-964 doi:10.4236/jsea.2010.310112 Published Online October 2010 (http://www.SciRP.org/journal/jsea) Copyright © 2010 SciRes. JSEA Application of Artificial Neural Network, Kriging, and Inverse Distance Weighting Models for Estimation of Scour Depth around Bridge Pier with Bed Sill Homayoon Seyed Rahman, Keshavarzi Alireza*, Gazni Reza Water Department, Shiraz University, Shiraz, Iran. Email: keshavrz@shirazu.ac.ir Received July 23rd, 2010; revised August 23rd, 2010; accepted August 25th, 2010. ABSTRACT This paper outlines the application of the multi-layer perceptron artificial neural network (ANN), ordinary kriging (OK), and inverse distance weighting (IDW) models in the estimation of local scour depth around bridge piers. As part of this study, bridge piers were installed with bed sills at the bed of an experimental flume. Experimental tests were conducted under different flow conditions and varying distances between bridge pier and bed sill. The ANN, OK and IDW models were applied to the experimental data and it was shown that the artificial neural network model predicts local scour depth more accurately than the kriging and inverse distance weighting models. It was found that the ANN with two hidden layers was the optimum model to predict lo cal scour depth. Th e results from the sixth test case showed that the ANN with one hidden layer and 17 hidden nodes was the best model to predict local scour depth. Whereas the results from the fifth te st case found that the ANN with t hree hidden layers was the best model to predi ct local scour depth. Keywords: Artificial Neural Network, Scour Depth, Ordinary Kriging, Inverse Distance Weighting, Bridge Piers, Bed Sill 1. Introduction The accurate estimation of maximum scour depth around and downstream of bridge piers is critical and very im- portant for design engineers. The prediction of scour depth around bridge piers has been the subject of many experimental studies, and has resulted in a number of prediction techniques being presented. Scour depth is a significant limiting factor when assigning the minimum depth of substructures, as it decreases the lateral capacity of the substructure. To determine a technique for predicting scour depth for different pier positions, comprehensive experimental tests have been conducted. In the past, a number of re- search studies had been conducted to determine tech- niques for the estimation of local scour around bridge piers and their abutments. These have been reported in literature. Of these studies, the first extensive experi- mental work on bridge pier scour was conducted and reported by Chabert and Engeldinger (1956) which is cited by Jeng et al. [1]. A study was also conducted by Blodgett (1978), again is cited by Jeng et al. [1], to report the cause of failure of 383 bridges. It was reported that most failures were caused by catastrophic floods. This study also found that the incorrect prediction of local scour depth during engineering design lead to enlarged local and contraction scour. Yankielun and Zabilansky [2] pointed out that this serious problem costs millions of dollars worth of damage, leaving foundations of bridge piers and bridge abutments insecure. Johnson [3] com- pared some of proposed prediction methods with the available field data, and concluded that more research is still required to accurately determine local scour. To overcome this complicated problem, the artificial neural network (ANN) was found to be useful as a com- prehensive function approximator, especially when the relationship between dependent and independent vari- ables is inadequately understood [1]. Trent et al. [4,5] *Present Address: School of Civil & Environmental Engineering, UTS, Sydney, Australia. 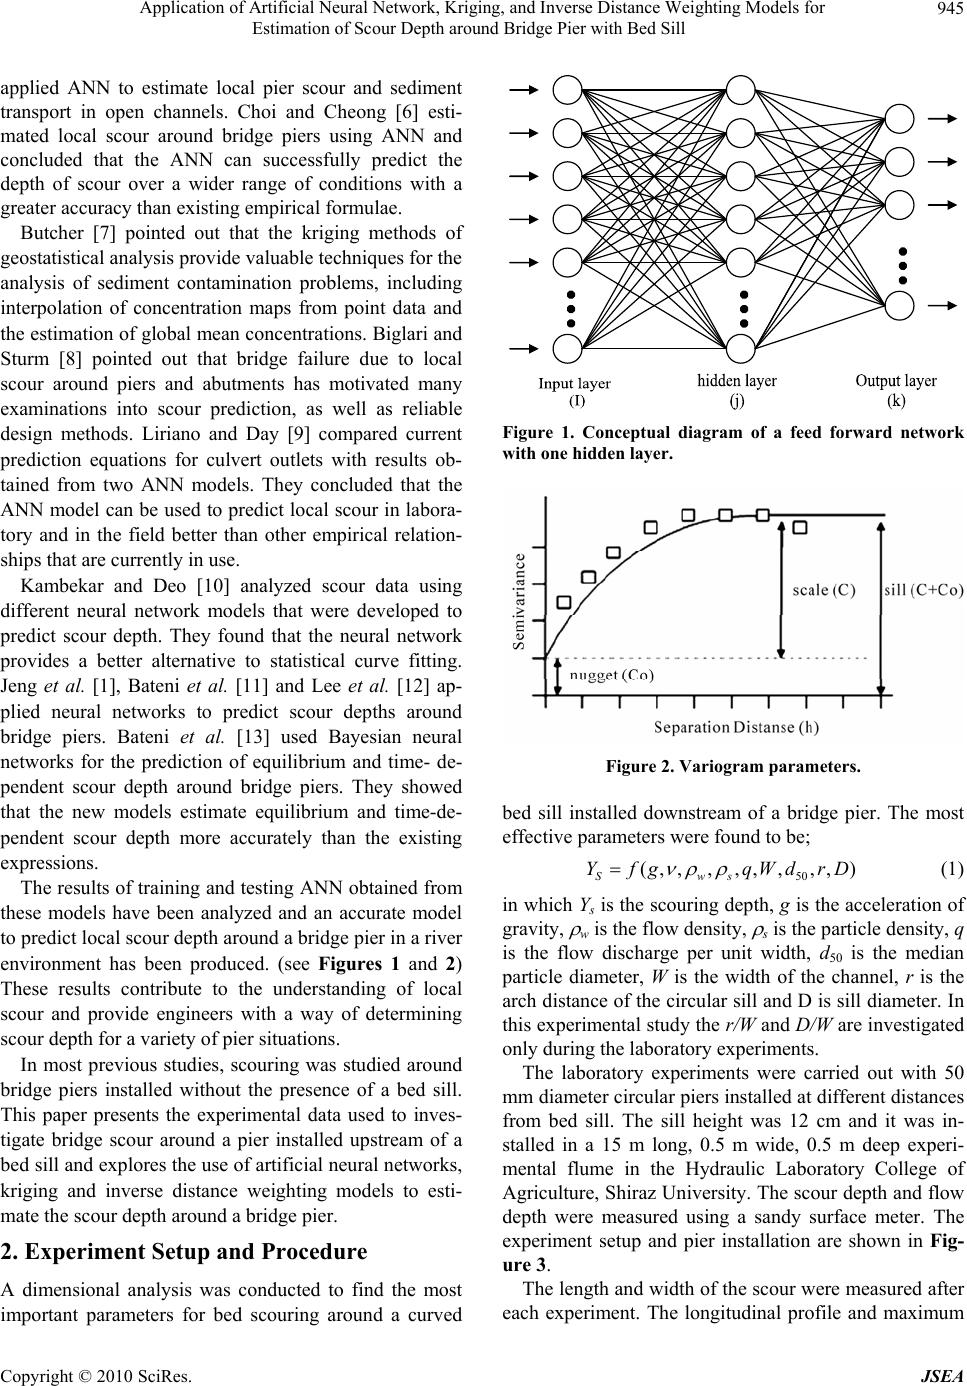 Application of Artificial Neural Network, Kriging, and Inverse Distance Weighting Models for 945 Estimation of Scour Depth around Bridge Pier with Bed Sill applied ANN to estimate local pier scour and sediment transport in open channels. Choi and Cheong [6] esti- mated local scour around bridge piers using ANN and concluded that the ANN can successfully predict the depth of scour over a wider range of conditions with a greater accuracy than existing empirical formulae. Butcher [7] pointed out that the kriging methods of geostatistical analysis prov ide v alu able techniq u es for the analysis of sediment contamination problems, including interpolation of concentration maps from point data and the estimation of global mean concentrations. Biglari and Sturm [8] pointed out that bridge failure due to local scour around piers and abutments has motivated many examinations into scour prediction, as well as reliable design methods. Liriano and Day [9] compared current prediction equations for culvert outlets with results ob- tained from two ANN models. They concluded that the ANN model can be used to predict local scour in labora- tory and in the field better than other empirical relation- ships that are curren tly in use. Kambekar and Deo [10] analyzed scour data using different neural network models that were developed to predict scour depth. They found that the neural network provides a better alternative to statistical curve fitting. Jeng et al. [1], Bateni et al. [11] and Lee et al. [12] ap- plied neural networks to predict scour depths around bridge piers. Bateni et al. [13] used Bayesian neural networks for the prediction of equilibrium and time- de- pendent scour depth around bridge piers. They showed that the new models estimate equilibrium and time-de- pendent scour depth more accurately than the existing expressions. The results of training and testing ANN obtained from these models have been analyzed and an accurate model to predict local scour depth around a bridge pier in a river environment has been produced. (see Figures 1 and 2) These results contribute to the understanding of local scour and provide engineers with a way of determining scour depth for a variety of pier situations. In most previous studies, scouring was studied around bridge piers installed without the presence of a bed sill. This paper presents the experimental data used to inves- tigate bridge scour around a pier installed upstream of a bed sill and explores the use of artificial neural networks, kriging and inverse distance weighting models to esti- mate the scour depth around a bridge pier. 2. Experiment Setup and Procedure A dimensional analysis was conducted to find the most important parameters for bed scouring around a curved Figure 1. Conceptual diagram of a feed forward network with one hidden layer. Figure 2. Variogram parameters. bed sill installed downstream of a bridge pier. The most effective parameters were found to be; 50 (,,,,,,,,) Sws Yfg qWdrD (1) in which Ys is the scouring depth, g is the acceleration of gravity, w is the flow density, s is the particle density, q is the flow discharge per unit width, d50 is the median particle diameter, W is the width of the channel, r is the arch distance of the circular sill and D is sill diameter. In this experimental study the r/W and D/W are investigated only during the laboratory experiments. The laboratory experiments were carried out with 50 mm diameter circular piers installed at different distances from bed sill. The sill height was 12 cm and it was in- stalled in a 15 m long, 0.5 m wide, 0.5 m deep experi- mental flume in the Hydraulic Laboratory College of Agriculture, Shiraz University. The scou r depth and flow depth were measured using a sandy surface meter. The experiment setup and pier installation are shown in Fig- ure 3. The length and width of the scour were measured after each experiment. The longitudinal profile and maximum Copyright © 2010 SciRes. JSEA 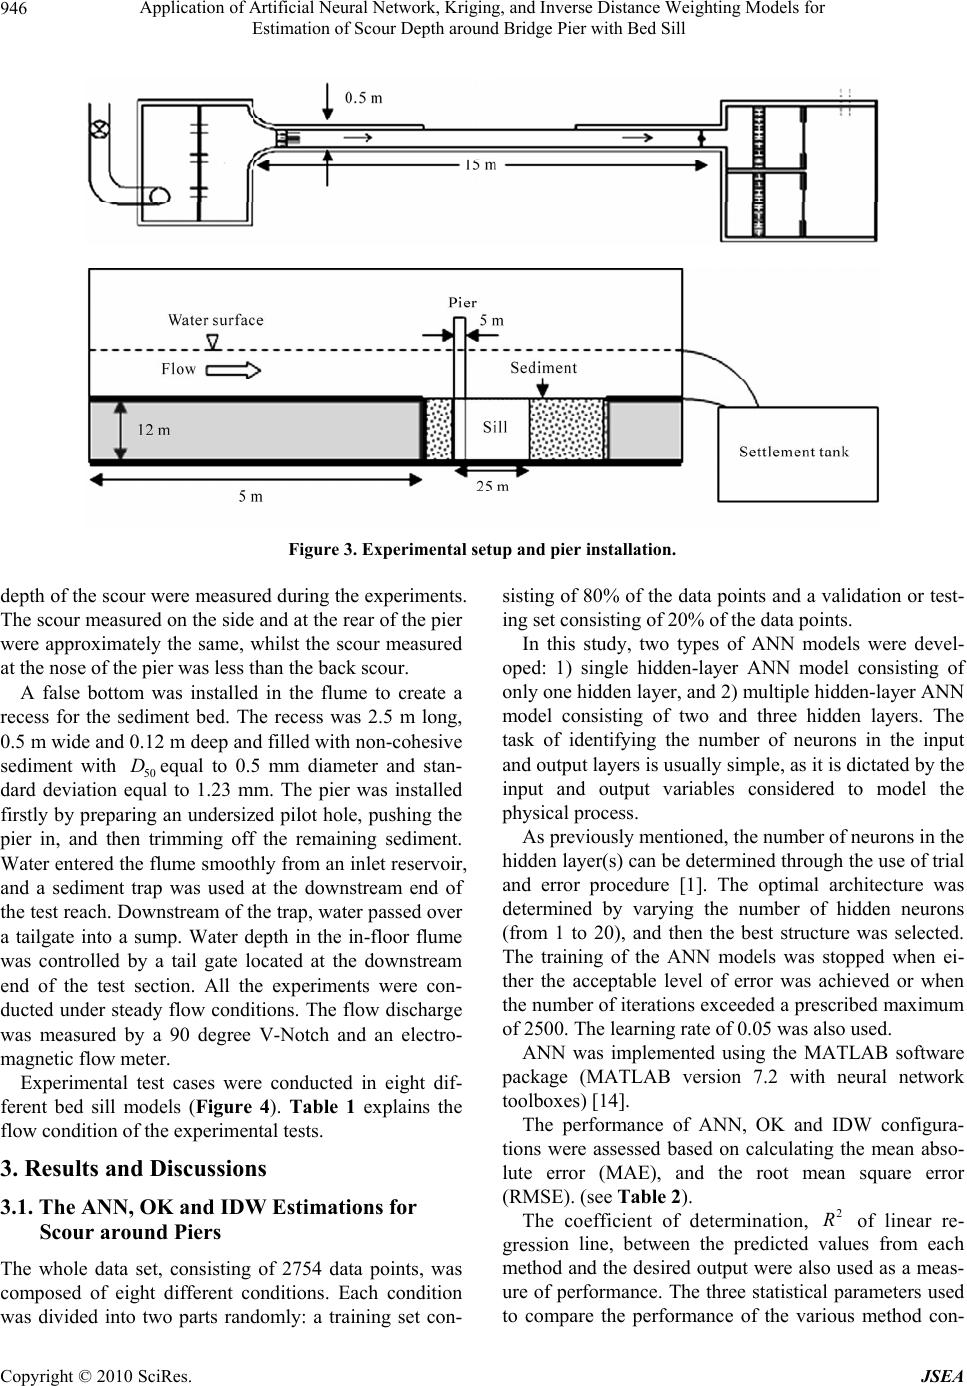 Application of Artificial Neural Network, Kriging, and Inverse Distance Weighting Models for Estimation of Scour Depth around Bridge Pier with Bed Sill Copyright © 2010 SciRes. JSEA 946 Figure 3. Experimental setup and pier installation. depth of the scour were measured during the experiments. The scour measured on the side and at the rear of the pier were approximately the same, whilst the scour measured at the nose of the pier was less than the back scour. A false bottom was installed in the flume to create a recess for the sediment bed. The recess was 2.5 m long, 0.5 m wide and 0.12 m deep and filled with non-cohesive sediment with 50 equal to 0.5 mm diameter and stan- dard deviation equal to 1.23 mm. The pier was installed firstly by preparing an undersized pilot hole, pushing the pier in, and then trimming off the remaining sediment. Water entered the flume smoothly from an inlet reservoir, and a sediment trap was used at the downstream end of the test reach. Downstream of the trap, water passed over a tailgate into a sump. Water depth in the in-floor flume was controlled by a tail gate located at the downstream end of the test section. All the experiments were con- ducted under steady flow conditions. The flow discharge was measured by a 90 degree V-Notch and an electro- magnetic flow meter. D Experimental test cases were conducted in eight dif- ferent bed sill models (Figure 4). Table 1 explains the flow condition of the experimental tests. 3. Results and Discussions 3.1. The ANN, OK and IDW Estimations for Scour around Piers The whole data set, consisting of 2754 data points, was composed of eight different conditions. Each condition was divided into two parts randomly: a training set con- sisting of 80% of the data points and a validation or test- ing set consisting of 20% of the data points. In this study, two types of ANN models were devel- oped: 1) single hidden-layer ANN model consisting of only one hidden layer, and 2) multiple hidden-layer ANN model consisting of two and three hidden layers. The task of identifying the number of neurons in the input and output layers is usually simple, as it is dictated by the input and output variables considered to model the physical process. As previously mentioned, the number of neurons in the hidden layer(s) can be determined thro ugh the us e of trial and error procedure [1]. The optimal architecture was determined by varying the number of hidden neurons (from 1 to 20), and then the best structure was selected. The training of the ANN models was stopped when ei- ther the acceptable level of error was achieved or when the number of iterations exceeded a prescribed maximum of 2500. The learning rate of 0.05 was also used. ANN was implemented using the MATLAB software package (MATLAB version 7.2 with neural network toolboxes) [14]. The performance of ANN, OK and IDW configura- tions were assessed based on calculating the mean abso- lute error (MAE), and the root mean square error (RMSE). (see Table 2). The coefficient of determination, of linear re- gression line, between the predicted values from each method and the desired output were also used as a meas- ure of performance. The three statistical parameters used to compare the performance of the various method con- 2 R 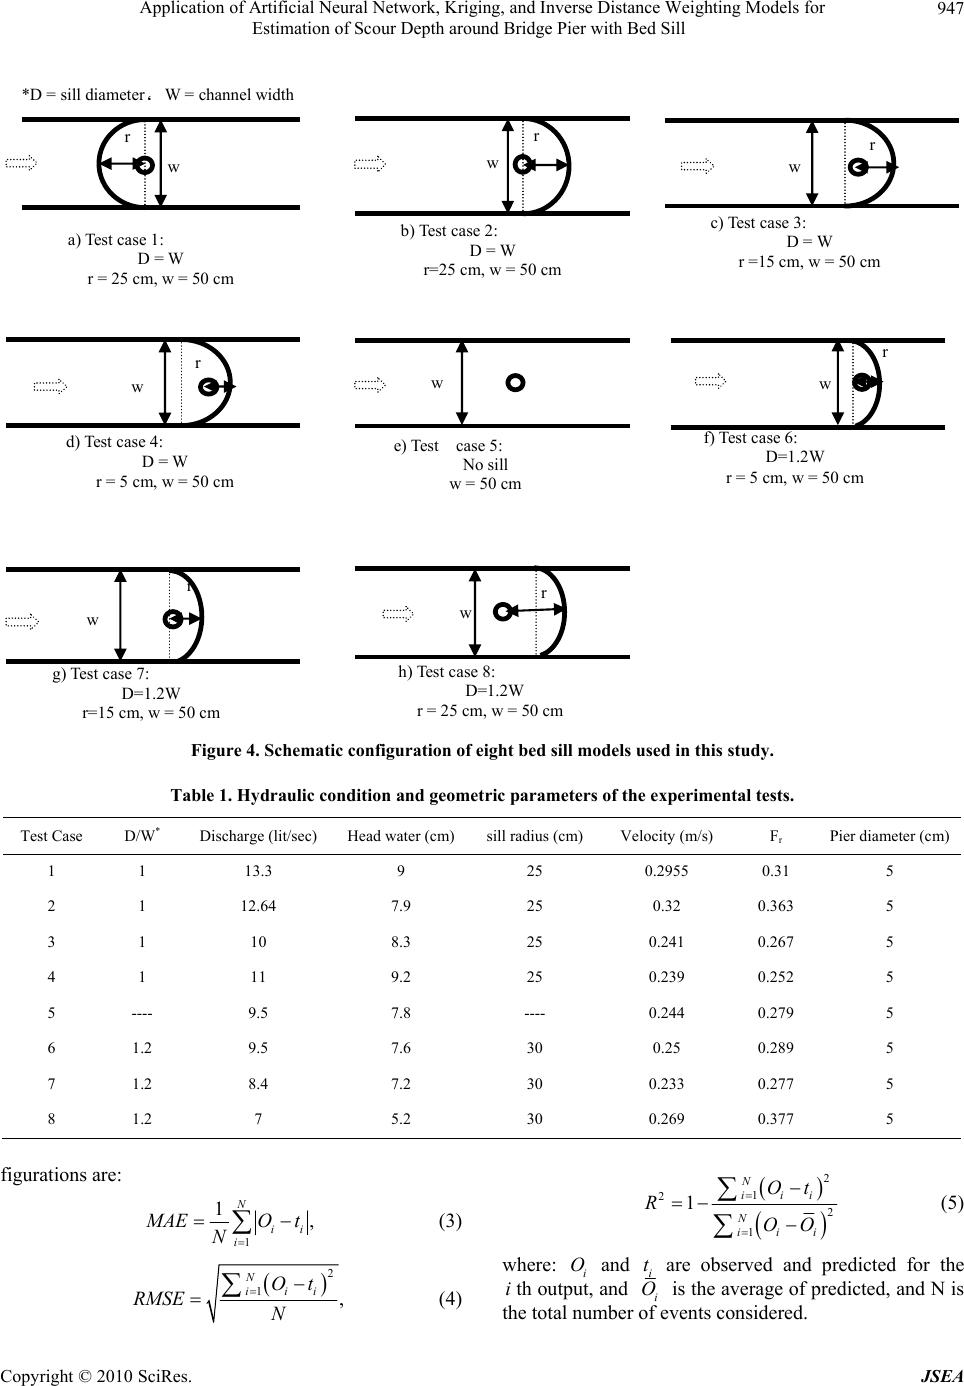 Application of Artificial Neural Network, Kriging, and Inverse Distance Weighting Models for 947 Estimation of Scour Depth around Bridge Pier with Bed Sill r w a) Test case 1: D = W r = 25 cm, w = 50 cm r w b) Test case 2: D = W r=25 cm, w = 50 cm w c) Test case 3: D = W r =15 cm, w = 50 cm r w r d) Test case 4: D = W r = 5 cm, w = 50 cm w e) Test case 5: No si ll w = 50 cm r w f) Test case 6: D=1.2W r = 5 cm, w = 50 cm r w g) Test case 7: D=1.2W r=15 cm, w = 50 cm r h) Test case 8: D=1.2W r = 25 cm, w = 50 cm w *D = sill d ia met er، W = channel width Figure 4. Schematic configuration of eight bed sill models used in this study. Table 1. Hydraulic condition and geometric parameters of the experimental tests. Test Case D/W* Discharge (lit/sec) Head water (cm)sill radius (cm) Velocity (m/s) Fr Pier diameter (cm) 1 1 13.3 9 25 0.2955 0.31 5 2 1 12.64 7.9 25 0.32 0.363 5 3 1 10 8.3 25 0.241 0.267 5 4 1 11 9.2 25 0.239 0.252 5 5 - --- 9.5 7.8 - --- 0.244 0.279 5 6 1.2 9.5 7.6 30 0.25 0.289 5 7 1.2 8.4 7.2 30 0.233 0.277 5 8 1.2 7 5.2 30 0.269 0.377 5 figurations are: 1 1, N ii i M AEO t N (3) 2 1, N iii Ot RMSE N (4) 2 1 2 2 1 1N iii N iii Ot ROO (5) where: i and are observed and predicted for the th output, and Oi t ii O is the average of predicted, and N is thetotal number of events considered. Copyright © 2010 SciRes. JSEA 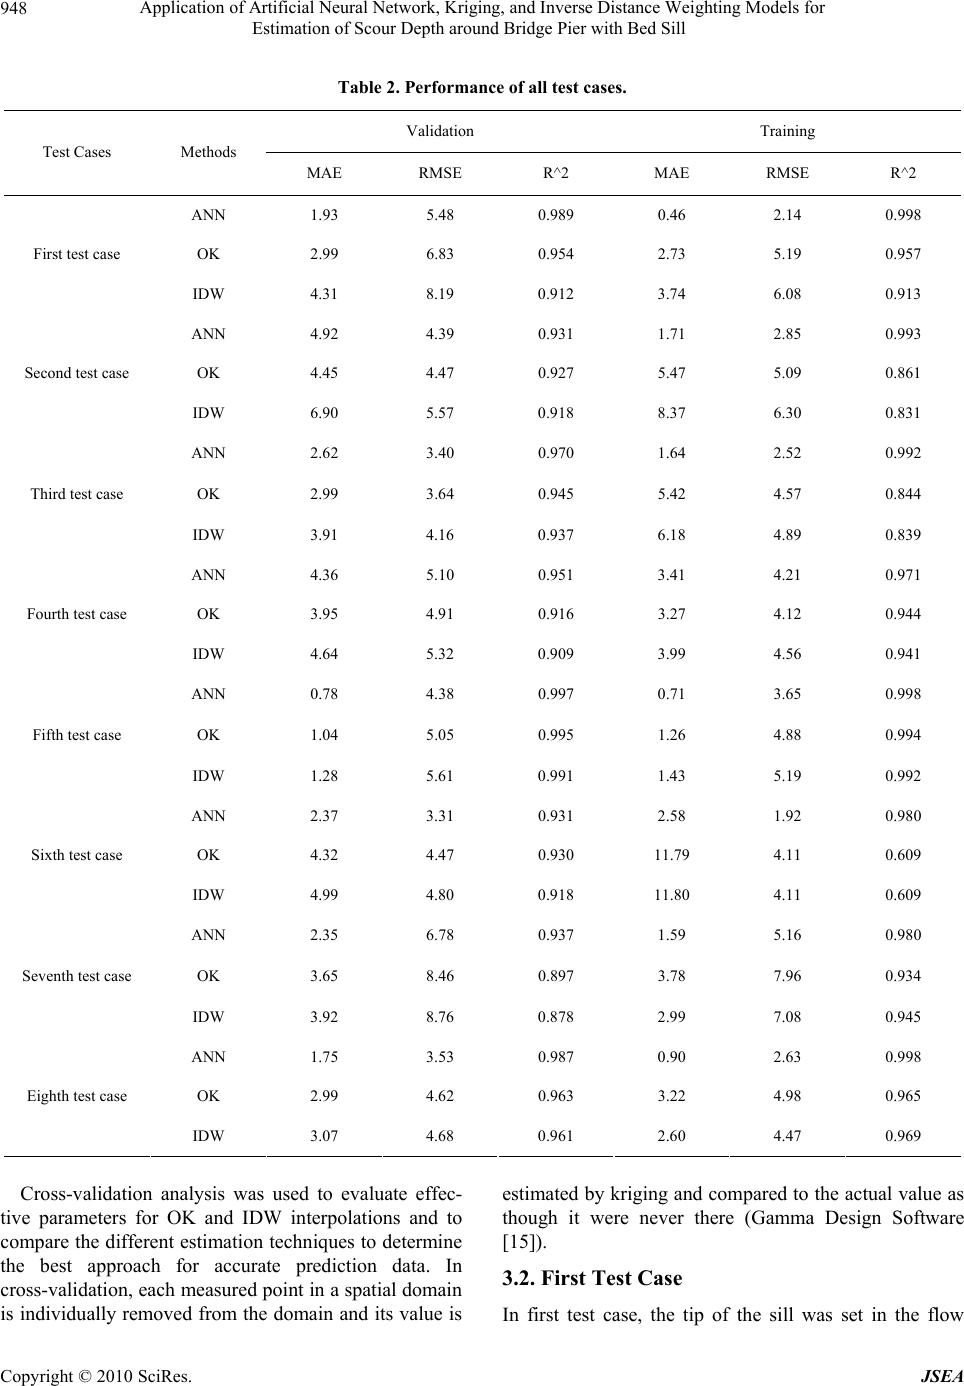 Application of Artificial Neural Network, Kriging, and Inverse Distance Weighting Models for 948 Estimation of Scour Depth around Bridge Pier with Bed Sill Table 2. Performance of all test cases. Validation Training Test Cases Methods MAE RMSE R^2 MAE RMSE R^2 ANN 1.93 5.48 0.989 0.46 2.14 0.998 OK 2.99 6.83 0.954 2.73 5.19 0.957 First test case IDW 4.31 8.19 0.912 3.74 6.08 0.913 ANN 4.92 4.39 0.931 1.71 2.85 0.993 OK 4.45 4.47 0.927 5.47 5.09 0.861 Second test case IDW 6.90 5.57 0.918 8.37 6.30 0.831 ANN 2.62 3.40 0.970 1.64 2.52 0.992 OK 2.99 3.64 0.945 5.42 4.57 0.844 Third test case IDW 3.91 4.16 0.937 6.18 4.89 0.839 ANN 4.36 5.10 0.951 3.41 4.21 0.971 OK 3.95 4.91 0.916 3.27 4.12 0.944 Fourth test case IDW 4.64 5.32 0.909 3.99 4.56 0.941 ANN 0.78 4.38 0.997 0.71 3.65 0.998 OK 1.04 5.05 0.995 1.26 4.88 0.994 Fifth test case IDW 1.28 5.61 0.991 1.43 5.19 0.992 ANN 2.37 3.31 0.931 2.58 1.92 0.980 OK 4.32 4.47 0.930 11.79 4.11 0.609 Sixth test case IDW 4.99 4.80 0.918 11.80 4.11 0.609 ANN 2.35 6.78 0.937 1.59 5.16 0.980 OK 3.65 8.46 0.897 3.78 7.96 0.934 Seventh test case IDW 3.92 8.76 0.878 2.99 7.08 0.945 ANN 1.75 3.53 0.987 0.90 2.63 0.998 OK 2.99 4.62 0.963 3.22 4.98 0.965 Eighth test case IDW 3.07 4.68 0.961 2.60 4.47 0.969 Cross-validation analysis was used to evaluate effec- tive parameters for OK and IDW interpolations and to compare the different estimation techniques to determine the best approach for accurate prediction data. In cross-validation, each measured point in a spatial domain is individually removed from the domain and its value is estimated by kriging and compared to th e actual value as though it were never there (Gamma Design Software [15]). 3.2. First Test Case In first test case, the tip of the sill was set in the flow Copyright © 2010 SciRes. JSEA 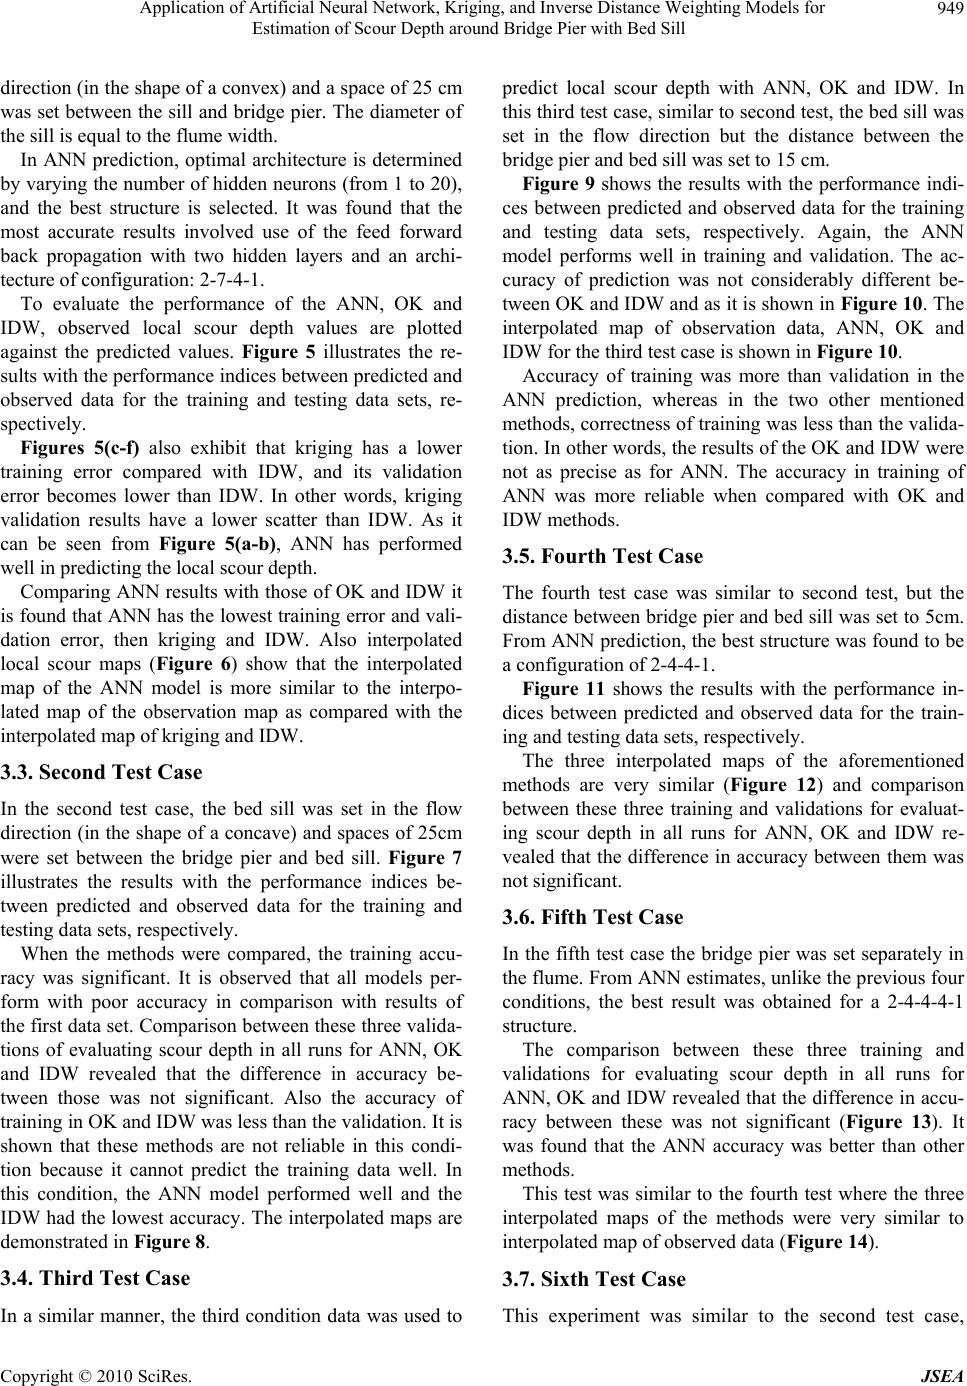 Application of Artificial Neural Network, Kriging, and Inverse Distance Weighting Models for 949 Estimation of Scour Depth around Bridge Pier with Bed Sill direction (in the shape of a convex) and a space of 25 cm was set between the sill and bridge pier. The diameter of the sill is equal to the flume width. In ANN prediction, optimal architecture is determined by varying the number of hidden neurons (from 1 to 20), and the best structure is selected. It was found that the most accurate results involved use of the feed forward back propagation with two hidden layers and an archi- tecture of configuration: 2-7-4-1. To evaluate the performance of the ANN, OK and IDW, observed local scour depth values are plotted against the predicted values. Figure 5 illustrates the re- sults with the performance indices between predicted and observed data for the training and testing data sets, re- spectively. Figures 5(c-f) also exhibit that kriging has a lower training error compared with IDW, and its validation error becomes lower than IDW. In other words, kriging validation results have a lower scatter than IDW. As it can be seen from Figure 5(a-b), ANN has performed well in predicting the local sco ur depth. Comparing ANN results with those of OK and IDW it is found that ANN has the lowest training error and vali- dation error, then kriging and IDW. Also interpolated local scour maps (Figure 6) show that the interpolated map of the ANN model is more similar to the interpo- lated map of the observation map as compared with the interpolated map of kriging and IDW. 3.3. Second Test Case In the second test case, the bed sill was set in the flow direction (in the shape of a concave) and spaces of 25cm were set between the bridge pier and bed sill. Figure 7 illustrates the results with the performance indices be- tween predicted and observed data for the training and testing data sets, respectively. When the methods were compared, the training accu- racy was significant. It is observed that all models per- form with poor accuracy in comparison with results of the first data set. Comparison between these three valida- tions of evaluating scour depth in all runs for ANN, OK and IDW revealed that the difference in accuracy be- tween those was not significant. Also the accuracy of training in OK and IDW was less than the validation. It is shown that these methods are not reliable in this condi- tion because it cannot predict the training data well. In this condition, the ANN model performed well and the IDW had the lowest accuracy. The interpolated maps are demonstrated in Figure 8. 3.4. Third Test Case In a similar manner, the third condition data was used to predict local scour depth with ANN, OK and IDW. In this third test case, similar to second test, the bed sill was set in the flow direction but the distance between the bridge pier and bed sill was set to 15 cm. Figure 9 shows the results with the performance indi- ces between predicted and observed data for the training and testing data sets, respectively. Again, the ANN model performs well in training and validation. The ac- curacy of prediction was not considerably different be- tween OK and IDW and as it is shown in Figure 10. The interpolated map of observation data, ANN, OK and IDW for the third test case is shown in Figure 10. Accuracy of training was more than validation in the ANN prediction, whereas in the two other mentioned methods, correctness of training was less than the valida- tion. In other words, the results of the OK and IDW were not as precise as for ANN. The accuracy in training of ANN was more reliable when compared with OK and IDW methods. 3.5. Fourth Test Case The fourth test case was similar to second test, but the distance between bridg e pier and bed sill was set to 5cm. From ANN prediction, the best structure was found to be a configuration of 2-4-4-1. Figure 11 shows the results with the performance in- dices between predicted and observed data for the train- ing and testing data sets, respectively. The three interpolated maps of the aforementioned methods are very similar (Figure 12) and comparison between these three training and validations for evaluat- ing scour depth in all runs for ANN, OK and IDW re- vealed that the difference in accuracy between them was not significant. 3.6. Fifth Test Case In the fifth test case the bridge pier was set separately in the flume. From ANN estimates, unlike the previous four conditions, the best result was obtained for a 2-4-4-4-1 structure. The comparison between these three training and validations for evaluating scour depth in all runs for ANN, OK and IDW revealed that the difference in accu- racy between these was not significant (Figure 13). It was found that the ANN accuracy was better than other methods. This test was similar to the fourth test where the three interpolated maps of the methods were very similar to interpolated map of observed data (Figure 14). 3.7. Sixth Test Case This experiment was similar to the second test case, Copyright © 2010 SciRes. JSEA 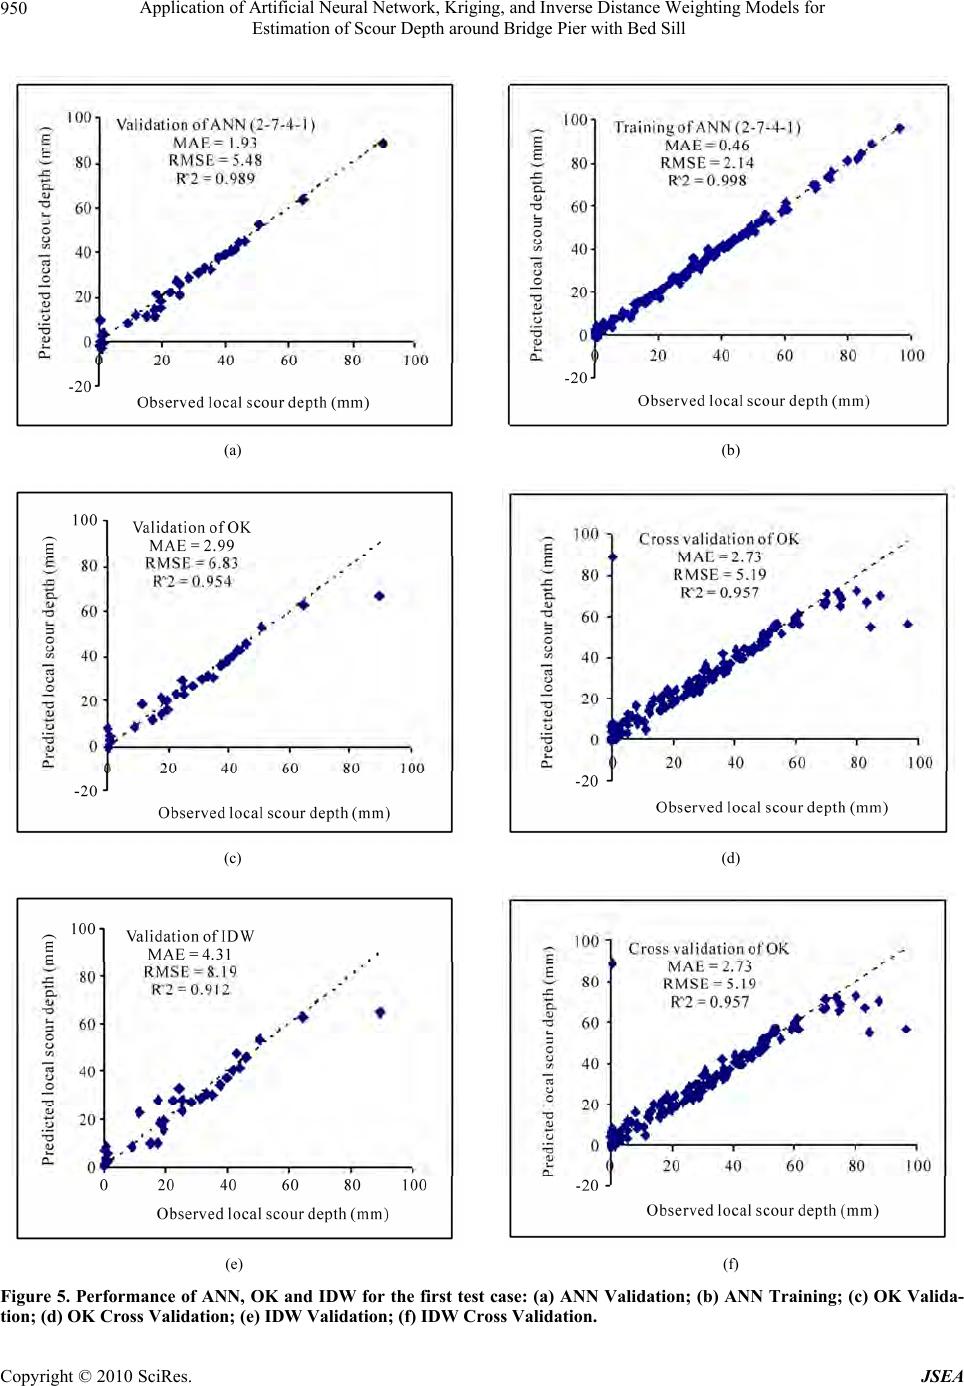 Application of Artificial Neural Network, Kriging, and Inverse Distance Weighting Models for Estimation of Scour Depth around Bridge Pier with Bed Sill Copyright © 2010 SciRes. JSEA 950 (a) (b) (c) (d) (e) (f) Figure 5. Performance of ANN, OK and IDW for the first test case: (a) ANN Validation; (b) ANN Training; (c) OK Valida- tion; (d) OK Cross Validation; (e) IDW Validation; (f) IDW Cross Validation.  Application of Artificial Neural Network, Kriging, and Inverse Distance Weighting Models for 951 Estimation of Scour Depth around Bridge Pier with Bed Sill Figure 6. Interpolated maps of observed data, ANN, OK and IDW test for first test case. (a) (b) Copyright © 2010 SciRes. JSEA 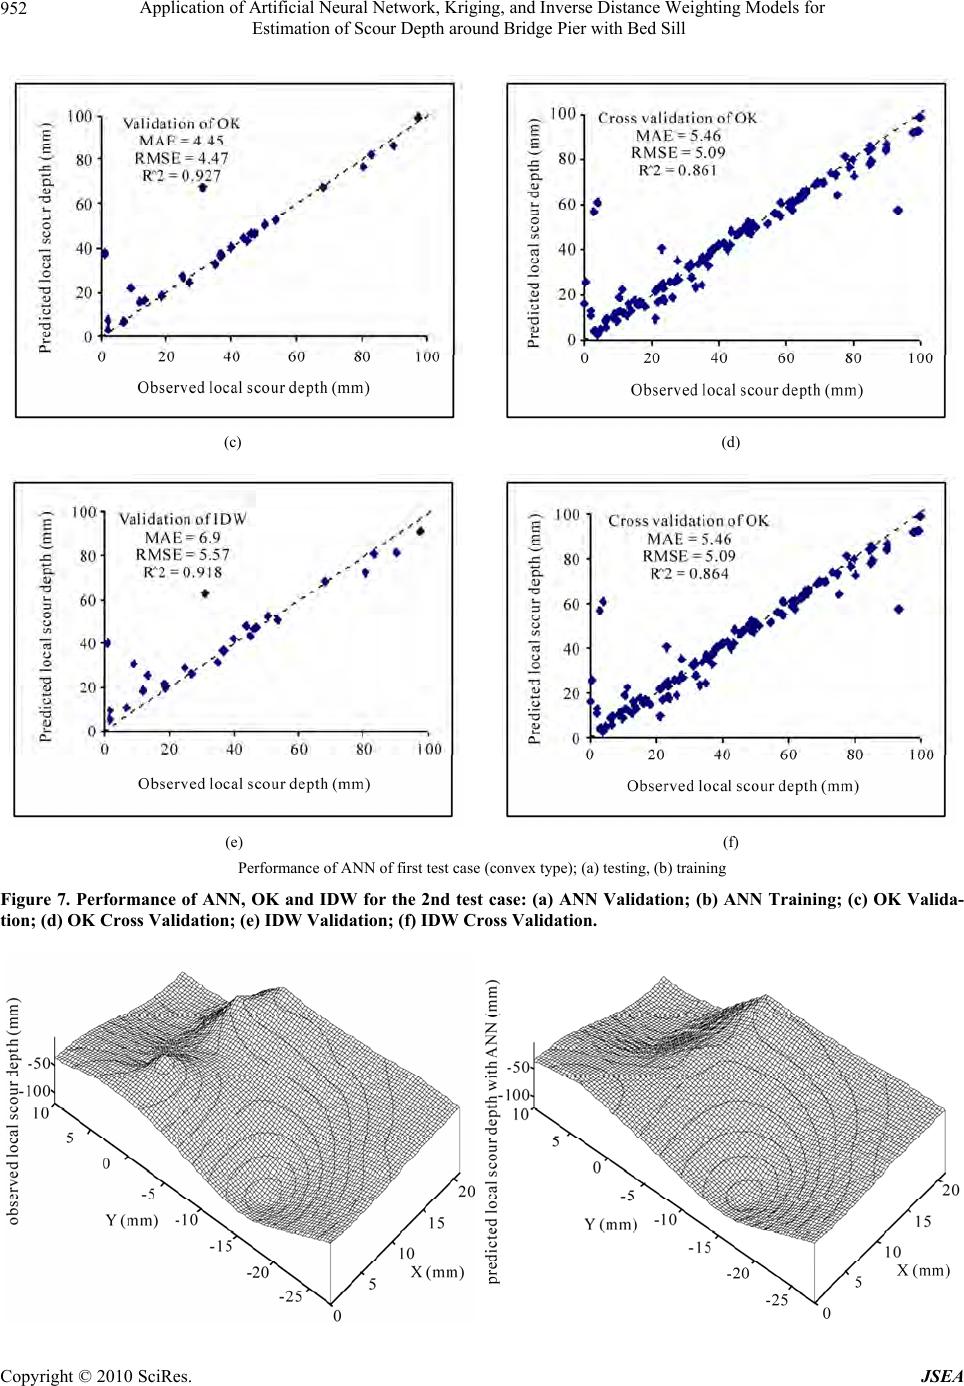 Application of Artificial Neural Network, Kriging, and Inverse Distance Weighting Models for 952 Estimation of Scour Depth around Bridge Pier with Bed Sill (c) (d) (e) (f) Performance of ANN of first test case (convex type); (a) testing, (b) training Figure 7. Performance of ANN, OK and IDW for the 2nd test case: (a) ANN Validation; (b) ANN Training; (c) OK Valida- tion; (d) OK Cross Validation; (e) IDW Validation; (f) IDW Cross Validation. Copyright © 2010 SciRes. JSEA  Application of Artificial Neural Network, Kriging, and Inverse Distance Weighting Models for 953 Estimation of Scour Depth around Bridge Pier with Bed Sill Figure 8. Interpolated maps of observed data, ANN, OK and IDW test for second test case. (a) (b) (c) (d) Copyright © 2010 SciRes. JSEA  Application of Artificial Neural Network, Kriging, and Inverse Distance Weighting Models for 954 Estimation of Scour Depth around Bridge Pier with Bed Sill (e) (f) Figure 9. Performance of ANN, OK and IDW for the third test case: (a) ANN Validation; (b) ANN Training; (c) OK Valida- tion; (d) OK Cross Validation; (e) IDW Validation; (f) IDW Cross Validation. Figure 10. Interpolated maps of observed data, ANN, OK and IDW test for third test case. Copyright © 2010 SciRes. JSEA  Application of Artificial Neural Network, Kriging, and Inverse Distance Weighting Models for 955 Estimation of Scour Depth around Bridge Pier with Bed Sill (a) (b) (c) (d) (e) (f) Figure 11. Performance of ANN, OK and IDW for the fourth test case: (a) ANN Validation; (b) ANN Training; (c) OK Vali- dation; (d) OK Cross Validation; (e) IDW Validation; (f) IDW Cross Validation. Copyright © 2010 SciRes. JSEA  Application of Artificial Neural Network, Kriging, and Inverse Distance Weighting Models for 956 Estimation of Scour Depth around Bridge Pier with Bed Sill Figure 12. Interpolated maps of observed data, ANN, OK and IDW test for fourth test case. (a) (b) Copyright © 2010 SciRes. JSEA  Application of Artificial Neural Network, Kriging, and Inverse Distance Weighting Models for 957 Estimation of Scour Depth around Bridge Pier with Bed Sill (c) (d) (e) (f) Figure 13. Performance of ANN, OK and IDW for the fifth test case: (a) ANN Validation; (b) ANN Training; (c) OK Valida- tion; (d) OK Cross Validation; (e) IDW Validation; (f) IDW Cross Validation. Copyright © 2010 SciRes. JSEA  Application of Artificial Neural Network, Kriging, and Inverse Distance Weighting Models for 958 Estimation of Scour Depth around Bridge Pier with Bed Sill Figure 14. Interpolated maps of observed data, ANN, OK and IDW test for fifth test case. (a) (b) (c) (d) Copyright © 2010 SciRes. JSEA  Application of Artificial Neural Network, Kriging, and Inverse Distance Weighting Models for 959 Estimation of Scour Depth around Bridge Pier with Bed Sill (e) (f) Figure 15. Performance of ANN, OK and IDW for the sixth test case: (a) ANN Validation; (b) ANN Training; (c) OK Valida- tion; (d) OK Cross Validation; (e) IDW Validation; (f) IDW Cross Validation. Figure 16. Interpolated maps of observed data, ANN, OK and IDW test for sixth test case. Copyright © 2010 SciRes. JSEA  Application of Artificial Neural Network, Kriging, and Inverse Distance Weighting Models for 960 Estimation of Scour Depth around Bridge Pier with Bed Sill (a) (b) (c) (d) (e) (f) Figure 17. Performance of ANN Training; (c) OK Vali- NN, OK and IDW for the seventh test case: (a) ANN Validation; (b) A dation; (d) OK Cross Validation; (e) IDW Validation; (f) IDW Cross Validation. Copyright © 2010 SciRes. JSEA  Application of Artificial Neural Network, Kriging, and Inverse Distance Weighting Models for 961 Estimation of Scour Depth around Bridge Pier with Bed Sill Figure 18. Interpolated maps of observed data, ANN, OK and IDW test for seventh test case. (a) (b) Copyright © 2010 SciRes. JSEA  Application of Artificial Neural Network, Kriging, and Inverse Distance Weighting Models for Estimation of Scour Depth around Bridge Pier with Bed Sill Copyright © 2010 SciRes. JSEA 962 (c) (d) (e) (f) Figure 19. Performance of ANali- similar to the third case, how- N, OK and IDW for the eighth test case: (a) ANN Validation; (b) ANN Training; (c) OK V dation; (d) OK Cross Validation; (e) IDW Validation; (f) IDW Cross Validation. however the diameter of bed sill was equal to 1.2 times the channel width. From ANN prediction, the optimal architecture was determined by varying the number of hidden neurons (from 1 to 20), and the best structure w as selected. It was found that best structure has only one hidden layer and its architecture has the configuration of 2-17-1. Figure 15 shows training and validation results, re- spectively. Again, the ANN model performs much better in training and validation. In OK and IDW the accuracy of training is less than validation, but OK showed the best results after ANN. An interpolated map of ANN (Figure 16) conforms to the interpolated map of ob- served local scour depth but the OK and IDW interpo- lated maps are not matched to the observed interpolated map. 3.8. Seventh Test Case This seventh test case was ever the diameter of bed sill was equal to 1.2 times the flume width. From ANN prediction the best structure was selected. It was found that the most accurate results involved use of configuration 2-7-4-1. Figure 17 depict training and validation results sepa- rately for ANN, OK and IDW, respectively, for the sev- enth data set. When these methods are compared, it was shown that ANN had the best accuracy and IDW had a  Application of Artificial Neural Network, Kriging, and Inverse Distance Weighting Models for 963 Estimation of Scour Depth around Bridge Pier with Bed Sill Figure 20. Interpolated maps of observed data, ANN, OK and IDW test for eighth test case. w accuracy. Comparisons between these three interpo- e bed sill was set in the flow or Prediction of In accurate of the three pre- sented methods, Table 1 represents the results of the the application of artificial neural mely the multi-layer perceptron, the The results of this study showed that the ANN model lo lated maps show that the interpolated map of ANN is very similar to the interpolated map of observed local scour depth (se e Figure 18). 3.9. Eighth Test Case In the eighth test case, th direction with a distance of 25cm between the bridge pier and bed sill. From ANN prediction the best structure was selected. It was found that the most accurate results in- volved the use of a configuration 2-12-4-1. In the esti- mate from this test case, like the last seven estimates, ANN has better results when compared with the other methods (Figure 19) and the difference in accuracy be- tween OK and IDW isn’t significant, as confirmed by the interpolated maps (Figure 20). 4. Appropriate Methods f Local Scour Depth order to identify the most research for all conditions. For all conditions, the ANN has the best accuracy in training and validation. ANN performance shows significant preciseness under every condition for th e predictio n of local scour depth. Only in the fifth test case, the difference in accuracy was very close for all methods. Performance of OK reveals good accuracy, but it has lower precision when compared with the ANN performance. In OK and IDW, accuracy of training is almost the same but OK has better precision in validation performance. Consequently, IDW shows lower performance over all conditions. 5. Conclusions This paper outlines network (ANN), na ordinary kriging (OK) and the inverse distance weighting (IDW) models in the estimation of local scour depth around bridge piers where bed sills have been installed. Copyright © 2010 SciRes. JSEA  Application of Artificial Neural Network, Kriging, and Inverse Distance Weighting Models for 964 Estimation of Scour Depth around Bridge Pier with Bed Sill A rk that includes one hidden layer and 17 hidden no Neural Network Assessment for Scour Depart- ment of Civiersity of Sydney , San Fran- eural Networks,” Local Scour porate Screening Data: glary and T. W. Sturm, “Numerical Modeling of d R. A. Day, “Prediction of Scour Depth n of Group , “Neural Net- eu- B. W. Melville, “Bayesian Neural Network Toolbox for Use with urfer Contouring and gives more accurate local scour depth predictions than the existing methods. As such, it is recommended that the a NN model be used for local scour depth predictions instead of the kriging and inverse distance weighting models. The ANN with two hidden layers was selected as the optimum network to predict local scour depth, whereas the netwo Hud des within that layer was the best model to predict local scour depth as it is shown in the sixth test case with D/W = 1.2 and r = 5 cm. Also three layer s was found the best model to predict local scour depth for test case with no sill as it is shown in the fifth test case. REFERENCES [1] D. S. Jeng, S. M. Bateni and E. Lockett, “ , Pi th Around Bridge,” Dep l Engineering, the Univ Sydney, NSW, Australia, Environmental Fluids/Wind Group, Res earch Report No R8 55, 2006. [2] N. E Yankielun and L. Zabilansky, “Laboratory Investi- gation of Time-Domain Reflectometry System for Moni- toring Bridge Scour,” Journal of Hydraulic Engineering, ASCE, Vol. 125, No. 12, 1999, pp. 1279-1284. [3] P. A. Johnson, “Comparison of Pier-Scour Equations Using Field Data,” Journal of Hydraulic Engineering, ASCE, Vol. 121, No. 8, 1995, pp. 626-629. [4] R. Trent, N. Gagarain and J. Rhodes, “Estimating Pier Scour with Artificial Neural Networks,” Proceedings of ASCE Conference on Hydraulic Engineering cisco, CA, 1993a, pp. 1043-1048. [5] R. Trent, A. Molinas and N. Gagarain, “An Artificial Neural Networks for Computing Sediment Estimation of Scour Below Spillways Using N Pro- ceedings of ASCE Conference on Hydraulic Engineering, San Francisco, CA, 1993b, pp. 1049-1054. [6] S. Choi and S. Cheong, “Prediction of round Bridge Piers Using Artificial Neural Networks,” Journal of the American Water Resources Association, Vol. 42, No 2, 2006, pp. 487-494. [7] J. B. Butcher, “Co-kriging to Incor son River Sediment,” Journal of the American Water Resources Association, Vol. 32, No. 2, 1996, pp. 349- 356. [8] B. Bi Flow around Bridge Abutments in Compound Channel,” Journal of Hydraulic Engineering, ASCE, Vol. 124, 1998, pp. 156-164. [9] S. L. Liriano an at Culvert Outlets Using Neural Networks,” Journal of Hydroinformatics, Vol. 3, 2001, pp. 231-238. [10] A. R. Kambekar and M. C. Deo, “Estimatio le Scour Using Neural Networks,” Applied Ocean Re- search, Vol. 25, No. 4, 2003, pp. 225-234. [11] S. M. Bateni, S. M. Borghei and D. S. Jeng work and Neuro-Fuzzy Assessments for Scour Depth around Bridge Piers,” Engineering Applications of Artifi- cial Intelligence, Vol. 20, No. 3, 2007a, pp. 401-414. [12] T. L. Lee, D. S. Jeng, G. H. Zhang and I. H. Hong, “N ral Network Modeling for Estimation of Scour Depth around Bridge Piers,” Journal of Hydrodynamic, Vol. 19, No. 3, 2007, pp. 378-386. [13] S. M. Betani, D. S. Jeng and Neural Networks for Prediction of Equilibrium and Time-Dependent Scour Depth around Bridge Piers,” Ad- vances in Engineering Software, Vol. 38, No. 2, 2007b, pp. 102-111. [14] Mathworks, “ MATHLAB,” User’s Guide, th e MathWorks, Inc., N a- tick, MA, 2006, pp. 2-1 to 3-36. [15] Golden Software User’s guide, “S 3D Surface Mapping for Scientists and Engineers,” 8th Edition, Golden Software, Inc., Golden, CO, 2002. Copyright © 2010 SciRes. JSEA |