Paper Menu >>
Journal Menu >>
 J. Biomedical Science and Engineering, 2010, 3, 1108-1116 JBiSE doi:10.4236/jbise.2010.311144 Published Online November 2010 (http://www.SciRP.org/journal/jbise/). Published Online November 2010 in SciRes. http://www.scirp.org/journal/jbise Experimental and numerical investigation of orbital atherectomy: absence of cavitation Reza Ramazani-Rend1, Srikar Chelikani1, Ephraim M. Sparrow1, John P. Abraham2 1Department of Mechanical Engineering, University of Minnesota, Minneapolis, MN, USA; 2School of Engineering, University of St. Thomas, St. Paul, MN, USA. Email: jpabraham@stthomas.edu Received 30 September 2010; revised 18 October 2010; accepted 20 October 2010. ABSTRACT A definitive, quantitative investigation has been per- formed to determine whether orbital atherectomy gives rise to cavitation. The investigation encom- passed a synergistic interaction between in vitro ex- perimentation and numerical simulation. The ex- perimentation was performed in two independent fluid environments: 1) a transparent tube having a diameter similar to that of the superficial femoral artery and 2) a large, fluid-filled, open-topped con- tainer. All of the experimental and simulation work was based on the geometric model of the Diamond- back 360 atherectomy device (Cardiovascular Sys- tems, Inc., St. Paul, MN). Rotational speeds ranged from 80,000 to 214,000 rpm. The presence or absence of cavitation in the experiments was assessed by means of high-speed photography. The photographic images clearly display the fact that there was no cavitation. Flow visualization revealed the presence of fluid flows driven by pressure gradients created by the geometry of the rotating crown. The numerical simulations encompassed the fluid environments and the operating conditions of the experiments. The key result of the numerical simulation is that the mini- mum fluid pressure due to the rotational motion was approximately 50 times greater than the saturation vapor pressure of the fluid. Since the onset of cavita- tion requires that the fluid pressure falls below the saturation vapor pressure, the computational out- come strongly supports the experimental findings. Keywords: Orbital Atherectomy; Cavitation; Arterial Disease; Numerical Simulation 1. INTRODUCTION There are currently four types of in vivo devices for the debulking of plaque. Among these, two are based on abrasive removal of the plaque while the others utilize a shaving technique. All four of the techniques make use of rotation to create relative motion between the abra- sive-debulking surface and the plaque proper. The pres- ence of rotation gives rise to radial pressure variations across the cross section of the artery being debulked. These pressure variations could lead to the creation of cavitation bubbles if the local pressure were to fall be- low the saturation vapor pressure of the fluid. The issue of cavitation is one that requires careful consideration in that collapsing cavitation bubbles are known to do damage to adjacent bounding materials [1-8]. In particular, if cavitation bubbles were to collapse in a blood vessel, substantial tissue damage might occur. There is an extensive literature on cavitation, its crea- tion, and its ramifications. Numerous means exist by which cavitation bubbles may be created in addition to fluid rotation. Indeed, any flowing liquid which sustains a substantial pressure drop may cavitate. The subject is so extensive and the literature so numerous that multiple reviews have appeared over the years. For example, in chronological order, reviews and state-of-the-art assess- ments have been published by [9-12]. A number of pa- pers have been concerned with the interaction of cavita- tion and the human body. In one major category, cavita- tion is caused by imposed ultrasound [13-16]. In another category, separation of flow passing through artificial heart valves has been identified as a cause of cavitation [17-19]. Of special relevance are papers which deal with cavi- tation in blood flows. In [20], an analytical study was performed to compare the life cycle of a single bubble in blood and in water, from which it was concluded that bubble collapse in blood is more violent than that in wa- ter. For a wide range of initial bubble radii, collapse times were calculated, and it was found that the collapse time was approximately 100 µs times the initial bubble radius in mm. Other studies that encompassed in vivo and in vitro experiments are reported in [21-24]. The first of these, which included both clinical studies and 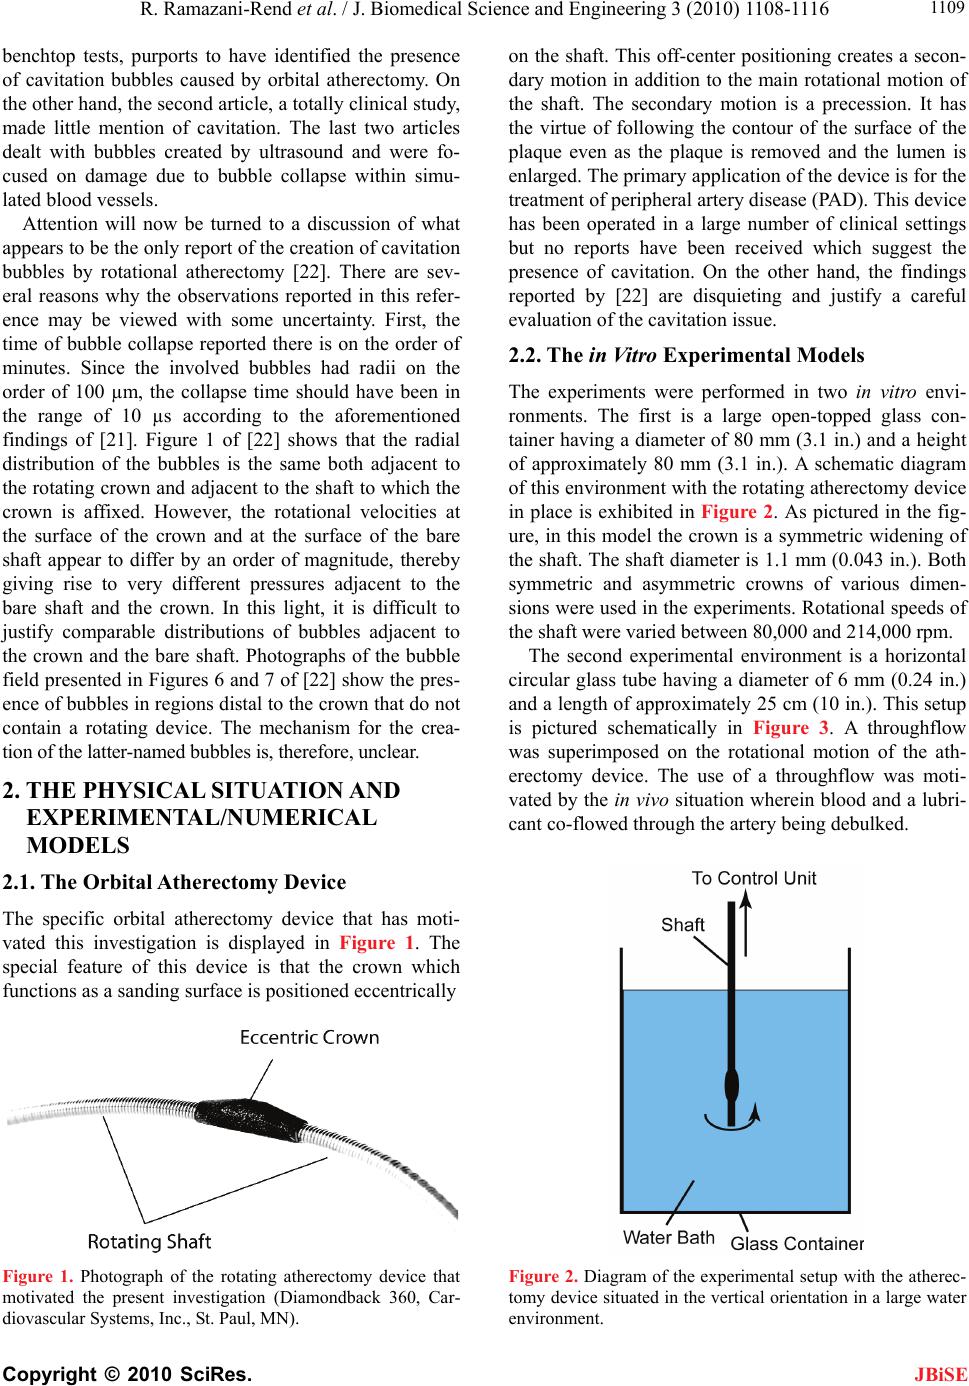 R. Ramazani-Rend et al. / J. Biomedical Science and Engineering 3 (2010) 1108-1116 Copyright © 2010 SciRes. JBiSE 1109 benchtop tests, purports to have identified the presence of cavitation bubbles caused by orbital atherectomy. On the other hand, the second article, a totally clinical study, made little mention of cavitation. The last two articles dealt with bubbles created by ultrasound and were fo- cused on damage due to bubble collapse within simu- lated blood vessels. Attention will now be turned to a discussion of what appears to be the only report of the creation of cavitation bubbles by rotational atherectomy [22]. There are sev- eral reasons why the observations reported in this refer- ence may be viewed with some uncertainty. First, the time of bubble collapse reported there is on the order of minutes. Since the involved bubbles had radii on the order of 100 µm, the collapse time should have been in the range of 10 µs according to the aforementioned findings of [21]. Figure 1 of [22] shows that the radial distribution of the bubbles is the same both adjacent to the rotating crown and adjacent to the shaft to which the crown is affixed. However, the rotational velocities at the surface of the crown and at the surface of the bare shaft appear to differ by an order of magnitude, thereby giving rise to very different pressures adjacent to the bare shaft and the crown. In this light, it is difficult to justify comparable distributions of bubbles adjacent to the crown and the bare shaft. Photographs of the bubble field presented in Figures 6 and 7 of [22] show the pres- ence of bubbles in regions distal to the crown that do not contain a rotating device. The mechanism for the crea- tion of the latter-named bubbles is, therefore, unclear. 2. THE PHYSICAL SITUATION AND EXPERIMENTAL/NUMERICAL MODELS 2.1. The Orbital Atherectomy Device The specific orbital atherectomy device that has moti- vated this investigation is displayed in Figure 1. The special feature of this device is that the crown which functions as a sanding surface is positioned eccentrically Figure 1. Photograph of the rotating atherectomy device that motivated the present investigation (Diamondback 360, Car- diovascular Systems, Inc., St. Paul, MN). on the shaft. This off-center positioning creates a secon- dary motion in addition to the main rotational motion of the shaft. The secondary motion is a precession. It has the virtue of following the contour of the surface of the plaque even as the plaque is removed and the lumen is enlarged. The primary application of the device is for the treatment of peripheral artery disease (PAD). This device has been operated in a large number of clinical settings but no reports have been received which suggest the presence of cavitation. On the other hand, the findings reported by [22] are disquieting and justify a careful evaluation of the cavitation issue. 2.2. The in Vitro Experimental Models The experiments were performed in two in vitro envi- ronments. The first is a large open-topped glass con- tainer having a diameter of 80 mm (3.1 in.) and a height of approximately 80 mm (3.1 in.). A schematic diagram of this environment with the rotating atherectomy device in place is exhibited in Figure 2. As pictured in the fig- ure, in this model the crown is a symmetric widening of the shaft. The shaft diameter is 1.1 mm (0.043 in.). Both symmetric and asymmetric crowns of various dimen- sions were used in the experiments. Rotational speeds of the shaft were varied between 80,000 and 214,000 rpm. The second experimental environment is a horizontal circular glass tube having a diameter of 6 mm (0.24 in.) and a length of approximately 25 cm (10 in.). This setup is pictured schematically in Figure 3. A throughflow was superimposed on the rotational motion of the ath- erectomy device. The use of a throughflow was moti- vated by the in vivo situation wherein blood and a lubri- cant co-flowed through the artery being debulked. Figure 2. Diagram of the experimental setup with the atherec- tomy device situated in the vertical orientation in a large water environment. 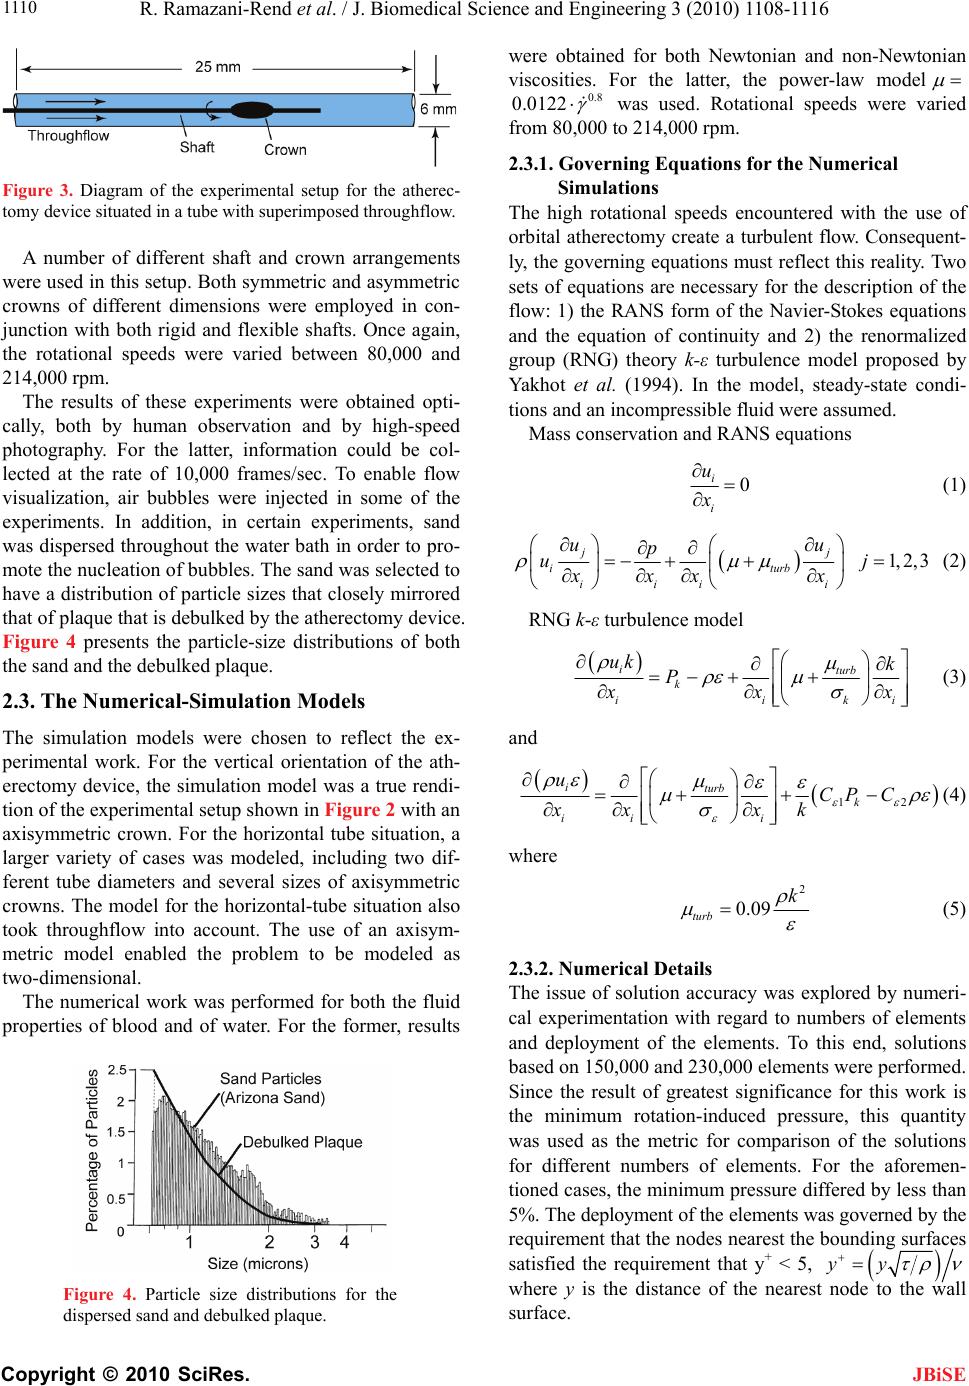 R. Ramazani-Rend et al. / J. Biomedical Science and Engineering 3 (2010) 1108-1116 Copyright © 2010 SciRes. JBiSE 1110 Figure 3. Diagram of the experimental setup for the atherec- tomy device situated in a tube with superimposed throughflow. A number of different shaft and crown arrangements were used in this setup. Both symmetric and asymmetric crowns of different dimensions were employed in con- junction with both rigid and flexible shafts. Once again, the rotational speeds were varied between 80,000 and 214,000 rpm. The results of these experiments were obtained opti- cally, both by human observation and by high-speed photography. For the latter, information could be col- lected at the rate of 10,000 frames/sec. To enable flow visualization, air bubbles were injected in some of the experiments. In addition, in certain experiments, sand was dispersed throughout the water bath in order to pro- mote the nucleation of bubbles. The sand was selected to have a distribution of particle sizes that closely mirrored that of plaque that is debulked by the atherectomy device. Figure 4 presents the particle-size distributions of both the sand and the debulked plaque. 2.3. The Numerical-Simulation Models The simulation models were chosen to reflect the ex- perimental work. For the vertical orientation of the ath- erectomy device, the simulation model was a true rendi- tion of the experimental setup shown in Figure 2 with an axisymmetric crown. For the horizontal tube situation, a larger variety of cases was modeled, including two dif- ferent tube diameters and several sizes of axisymmetric crowns. The model for the horizontal-tube situation also took throughflow into account. The use of an axisym- metric model enabled the problem to be modeled as two-dimensional. The numerical work was performed for both the fluid properties of blood and of water. For the former, results Figure 4. Particle size distributions for the dispersed sand and debulked plaque. were obtained for both Newtonian and non-Newtonian viscosities. For the latter, the power-law model 0.8 0.0122 was used. Rotational speeds were varied from 80,000 to 214,000 rpm. 2.3.1. Governing Equations for the Numerical Simulations The high rotational speeds encountered with the use of orbital atherectomy create a turbulent flow. Consequent- ly, the governing equations must reflect this reality. Two sets of equations are necessary for the description of the flow: 1) the RANS form of the Navier-Stokes equations and the equation of continuity and 2) the renormalized group (RNG) theory k-ε turbulence model proposed by Yakhot et al. (1994). In the model, steady-state condi- tions and an incompressible fluid were assumed. Mass conservation and RANS equations 0 i i u x (1) 1,2,3 jj i turb iii i uu p uj xxx x (2) RNG k-ε turbulence model iturb k iiki uk k P x xx (3) and 12 iturb k ii i uCP C xx xk (4) where 2 0.09 turb k (5) 2.3.2. Numerical Details The issue of solution accuracy was explored by numeri- cal experimentation with regard to numbers of elements and deployment of the elements. To this end, solutions based on 150,000 and 230,000 elements were performed. Since the result of greatest significance for this work is the minimum rotation-induced pressure, this quantity was used as the metric for comparison of the solutions for different numbers of elements. For the aforemen- tioned cases, the minimum pressure differed by less than 5%. The deployment of the elements was governed by the requirement that the nodes nearest the bounding surfaces satisfied the requirement that y+ < 5, yy where y is the distance of the nearest node to the wall surface. 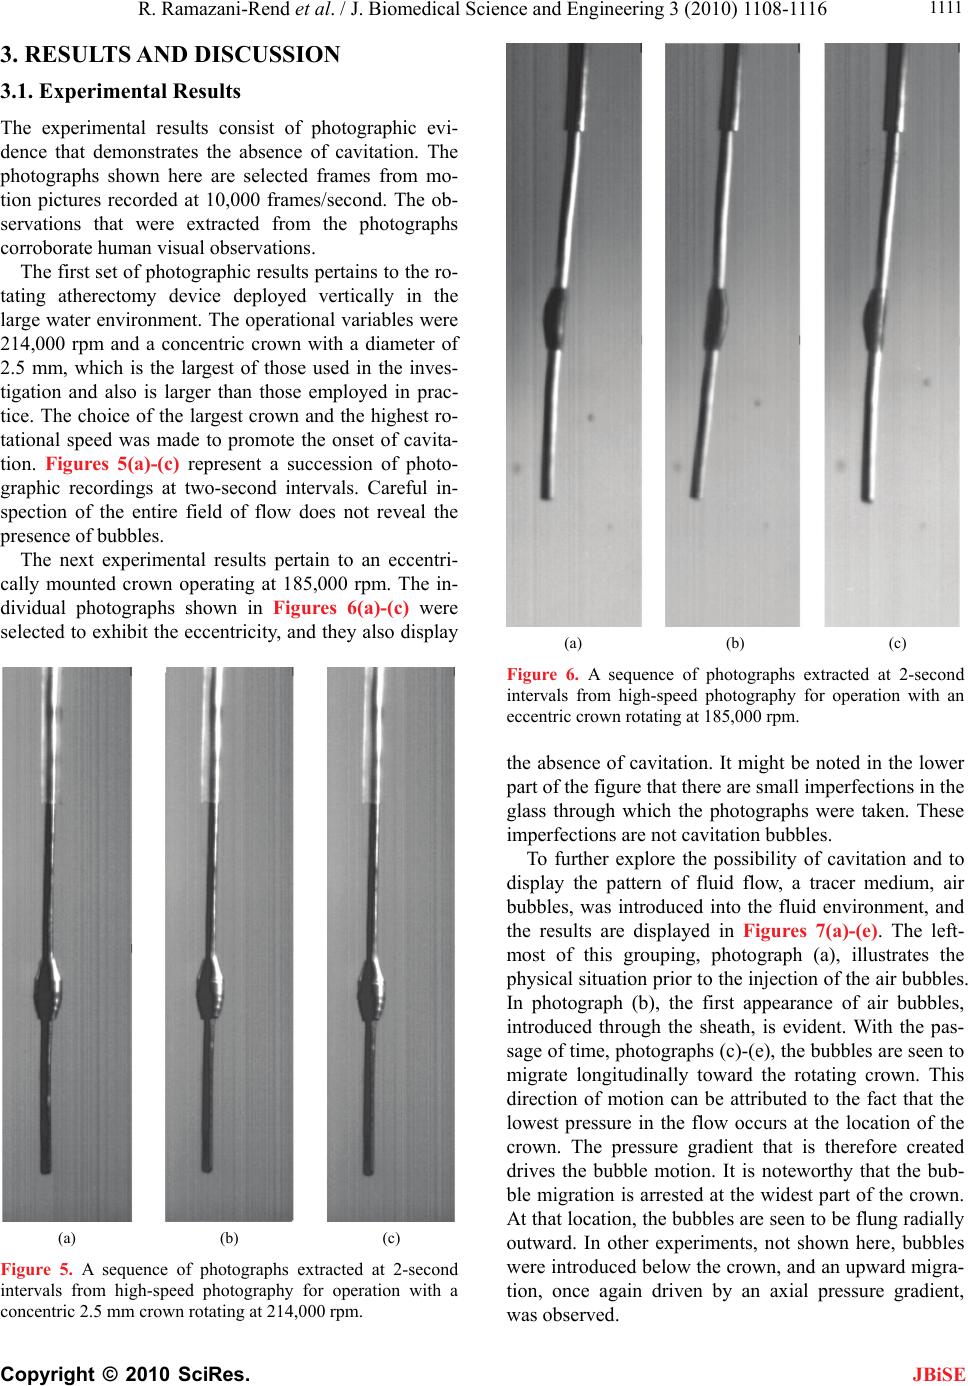 R. Ramazani-Rend et al. / J. Biomedical Science and Engineering 3 (2010) 1108-1116 Copyright © 2010 SciRes. JBiSE 1111 3. RESULTS AND DISCUSSION 3.1. Experimental Results The experimental results consist of photographic evi- dence that demonstrates the absence of cavitation. The photographs shown here are selected frames from mo- tion pictures recorded at 10,000 frames/second. The ob- servations that were extracted from the photographs corroborate human visual observations. The first set of photographic results pertains to the ro- tating atherectomy device deployed vertically in the large water environment. The operational variables were 214,000 rpm and a concentric crown with a diameter of 2.5 mm, which is the largest of those used in the inves- tigation and also is larger than those employed in prac- tice. The choice of the largest crown and the highest ro- tational speed was made to promote the onset of cavita- tion. Figures 5(a)-(c) represent a succession of photo- graphic recordings at two-second intervals. Careful in- spection of the entire field of flow does not reveal the presence of bubbles. The next experimental results pertain to an eccentri- cally mounted crown operating at 185,000 rpm. The in- dividual photographs shown in Figures 6(a)-(c) were selected to exhibit the eccentricity, and they also display (a) (b) (c) Figure 5. A sequence of photographs extracted at 2-second intervals from high-speed photography for operation with a concentric 2.5 mm crown rotating at 214,000 rpm. (a) (b) (c) Figure 6. A sequence of photographs extracted at 2-second intervals from high-speed photography for operation with an eccentric crown rotating at 185,000 rpm. the absence of cavitation. It might be noted in the lower part of the figure that there are small imperfections in the glass through which the photographs were taken. These imperfections are not cavitation bubbles. To further explore the possibility of cavitation and to display the pattern of fluid flow, a tracer medium, air bubbles, was introduced into the fluid environment, and the results are displayed in Figures 7(a)-(e). The left- most of this grouping, photograph (a), illustrates the physical situation prior to the injection of the air bubbles. In photograph (b), the first appearance of air bubbles, introduced through the sheath, is evident. With the pas- sage of time, photographs (c)-(e), the bubbles are seen to migrate longitudinally toward the rotating crown. This direction of motion can be attributed to the fact that the lowest pressure in the flow occurs at the location of the crown. The pressure gradient that is therefore created drives the bubble motion. It is noteworthy that the bub- ble migration is arrested at the widest part of the crown. At that location, the bubbles are seen to be flung radially outward. In other experiments, not shown here, bubbles were introduced below the crown, and an upward migra- tion, once again driven by an axial pressure gradient, was observed.  R. Ramazani-Rend et al. / J. Biomedical Science and Engineering 3 (2010) 1108-1116 Copyright © 2010 SciRes. JBiSE 1112 (a) (b) (c) (d) (e) Figure 7. A sequence of photographs extracted at 2-second intervals from high-speed photography for operation with a concentric 2.5 mm crown rotating at 214,000 rpm and with introduced air bubbles serving as a tracer. 3.2. Simulation Results The first result to be presented from the numerical simu- lations relates to the radial pressure variation created by the rotating atherectomy device positioned in a tube. That information is conveyed in Figure 8 where the minimum pressure is plotted as a function of the rota- tional speed. In addition, there is a reference line in the figure which corresponds to the saturation vapor pres- sure of water at 20oC. The working fluid for this simula- tion is water, and the crown was the largest available with an outer diameter of 2.5 mm. The diameter of the simulated artery was 5 mm, and there was a throughflow at the rate of 80 ml/min. The figure clearly shows that the fluid pressures are much higher, by a factor of 50, than the saturation vapor pressure. Since the onset of cavitation requires that the fluid pressure be lower than the saturation vapor pressure, cavitation is thereby pre- cluded. This outcome offers strong support for the visual photograph evidence. The information conveyed in Fig- ure 8 is representative of a large number of simulations for a 2.5 mm diameter crown and host tube diameters which ranged from 3-6 mm. Furthermore, both blood and water were simulated, and complementary simula- tions were also performed in the large environment. Properties for the water simulations were taken at 25oC while blood properties were evaluated at 37oC. In every case, the minimum pressures that were encountered were at least as large as that shown in Figure 8. No combina- tion of crown diameter, tube diameter, or fluid type led to pressures within an order of magnitude of those re- quired for cavitation. To complement the information conveyed in Figure 8, a color contour diagram showing the pressure distribu- tion in the vicinity of the rotating crown is presented in Figure 9. The figure consists of a main body which cor- Figure 8. Variation of the minimum pressure caused by rota- tion of the atherectomy device in a tube.  R. Ramazani-Rend et al. / J. Biomedical Science and Engineering 3 (2010) 1108-1116 Copyright © 2010 SciRes. JBiSE 1113 Figure 9. Variation of the pressure in the vicinity of the rotating atherectomy device positioned within a tube. responds to an overall portrayal of the pressure field and an inset which is focused on the immediate neighbor- hood of the crown. Both parts of the figure show that the major pressure variations are confined to the neighbor- hood of the crown. Clearly, the lowest pressures are at- tained at the very surface of the crown and, with in- creasing distance from the surface, the pressure increases. The inset is focused on the pressure distribution which is most relevant to the issue of cavitation. The pressures shown there are well above the saturation vapor pres- sure. To illustrate the pattern of fluid flow caused by the rotating motion of the atherectomy device, a simulation was performed with the device immersed in the large environment. The results of the numerical work are pre- sented in the vector diagram of Figure 10(a). The vector directions coincide with the local flow directions. These vectors show the presence of oppositely directed wall jets moving along the surface of the crown which collide at the apex of the crown. That collision leads to the crea- tion of a radial jet emanating from the neighborhood of the crown. The wall jets themselves result from longitu- dinal pressure gradients. The pressure at the apex of the crown is a minimum, whereas both the upstream and downstream pressures are larger. A result similar to that shown in Figure 10(a) was obtained from numerical simulations in a tube. The flow patterns shown in the figure are representative of flow patterns for all rotation rates which were investigated. A counterpart of Figure 10(a) is the display of streamlines presented in Figure 10(b). The streamlines are a reinforcement of the flow pattern that was describ- ed in the discussion of the (a) part of the figure. 3.3. Verification of the Numerical Model As a verification experiment for the numerical simula- tions, fluid velocities were tracked by means of an in- jected tracer medium. The tracer medium was injected air bubbles, and the motion of the bubbles was observed by means of a high-speed camera. The bubbles in ques- tion are displayed in Figure 7. Particular attention was focused on the flow field in the neighborhood of the crown that was visible in Figures 10(a) and (b). The investigated domain extended upstream of the crown which is vertically above the crown as it is exhibited in these figures. Velocities were deduced by carefully re- cording the position of the moving bubble front observed in consecutive frames of the high-speed recording. In view of the size of the observed bubbles, it was possible only to determine a local-average velocity over a finite radial expanse. To confirm the accuracy of the visual observations, five observers were individually involved with the obtainment of the results. Each observer inde- pendently measured the velocities, and those measure- ments were averaged. The experimental results obtained for the axial veloc- ity are presented in Figure 11 where they are compared with the radial distribution of the axial velocity taken from the numerical simulation and represented by the continuous curve. The horizontal lines represent the av- erage velocities over a radial span whose dimension is approximately equal to the size of the bubbles being  R. Ramazani-Rend et al. / J. Biomedical Science and Engineering 3 (2010) 1108-1116 Copyright © 2010 SciRes. JBiSE 1114 traced. The solid horizontal line corresponds to the re- sults of the numerical simulation while the dashed line was taken from the visual observations. The spread in the latter due to the several individual visual observa- tions is too small to be seen in the figure. (a) (b) Figure 10. (a) Vectors showing the direction of the flow adja- cent to the crown of a rotating atherectomy device situated in a water bath; (b) Streamlines of the flow adjacent to the crown of a rotating atherectomy device situated in a water bath. Comparison of the two horizontal lines indicates ex- cellent agreement between the local-averaged velocities. This level of agreement lends strong support to the va- lidity of the numerical simulations. Results were also obtained for the radial velocity in the same region as that for which the axial velocity re- sults have already been presented. Once again, the ex- perimental results correspond to local-average velocities. These results are presented in Figure 12. In that figure, the continuous curve corresponds to the radial distribu- tion of the radial velocity taken from the numerical simulations. In addition, there is a pair of horizontal lines which represent local-average radial velocities. The solid horizontal line depicts the numerical results while the dashed line corresponds to the observed bubble mo- tion. The observations were made by visually tracking bubbles which moved radially outward from the apex of the crown. Bubbles were tracked to a radial distance of 2.5 mm from the crown. From the figure, it is seen that Figure 11. Comparison of observed and calculated axial veloc- ity results upstream of the rotating crown. The horizontal lines represent local-averaged velocities, respectively from the nu- merical simulations and from the visual observations. Figure 12. Comparison of observed and calculated radial ve- locity results at the apex of the rotating crown. The horizontal lines represent local-averaged velocities, respectively from the numerical simulations and from the visual observations.  R. Ramazani-Rend et al. / J. Biomedical Science and Engineering 3 (2010) 1108-1116 Copyright © 2010 SciRes. JBiSE 1115 the experimental results reinforce those extracted from the simulations. This observation, taken together with what has been already found in Figure 11, strongly af- firms the validity of the numerical model and its imple- mentation 4. CONCLUDING REMARKS A synergistic approach involving in vitro laboratory ex- perimentation and numerical simulation was employed to determine whether an orbital atherectomy device can cause cavitation. The importance of this issue relates to the fact that bursting cavitation bubbles create powerful jets which can erode surfaces on which they impinge. In particular, if cavitation bubbles were to collapse in a blood vessel, substantial tissue damage and hemolysis might occur. The only report of cavitation bubbles due to rotating atherectomy appears to be that of [22]. While their find- ings can be questioned on phenomenological grounds (see Introduction), the importance of the cavitation issue demands a quantitative investigation such as that under- taken here. The specific rotating atherectomy device employed by Zolz, the Rotablator, reflects the limited availability of such devices at the time of his study, the early 1990s. The present investigation made use of a more contem- porary device, the Diamondback 360. The main differ- ence between these devices is that the crown of the Diamonback 360 is positioned eccentrically on its shaft whereas the crown of the Rotablator is positioned axi- symmetrically. The experimental part of the present investigation was performed in two different fluid environments: 1) a transparent horizontal tube whose diameter was chosen to model that of the superficial femoral artery and 2) a large open-topped transparent container. Both eccentric and axisymmetric crowns of various dimensions were employed, as were rigid and flexible shafts. Rotational speeds ranged between 80,000 and 214,000. High-speed photography (10,000 frames per second) was used to record the flow field. Water was the working fluid. Un- der no conditions were cavitation bubbles in evidence. Supplementary flow visualization experiments revealed axial flows driven by pressure gradients created by the difference in diameter between the shaft and the crown. The numerical simulations reflected the operating conditions of the experiments, but were limited to axi- symmetric crowns and rigid shafts. The key finding of the simulations is that the lowest rotation-induced pres- sure in the fluid is about 50 times greater than the satura- tion vapor pressure. Since the onset of cavitation re- quires that the fluid pressure be below the vapor pressure, the numerical results support the absence of cavitation. The axial and radial flows observed in the flow visuali- zation experiments were corroborated by the numerical simulations. 5. ACKNOWLEDGEMENTS R. Ramazani-Rend, S. Chelikani, and J. P. Abraham gratefully ac- knowledge support from Cardiovascular Systems, Inc. for this re- search. Support of H. Birali Runesha and the Supercomputing Institute for Digital Simulation & Advanced Computation at the University of Minnesota is gratefully acknowledged. REFERENCES [1] Rayleigh, L. (1917) On the pressure developed in a liquid during the collapse of a spherical cavity. Philosophical Magazine, 34(200), 94-98. [2] Plesset, M.W. (1949) The dynamics of cavitation bubbles. Journal of Applied Mechanics, 16, 277-282. [3] Hickling, R. and Plesset, M.S. (1964) Collapse and re- bound of a spherical bubble in water. Physics of Fluids, 7, 7-14. [4] Plesset, M.S. and Chapman, R.B. (1971) Collapse of an initially spherical vapour cavity in the neighborhood of a solid boundary. Journal of Fluid Mechanics, 47, 283- 290. [5] Zhang, S., Duncan, J.H. and Chahine, G.L. (1993) The final stage of the collapse of a cavitation bubble near a rigid wall. Journal of Fluid Mechanics, 257, 147-181. [6] Zhang, S. and Duncan, J.H. (1994) On the nonspherical collapse and rebound of a cavitation bubble. Physics of Fluids, 6, 2352-2362. [7] Pereira, F., Avellan, F. and Dupont, P. (1998) Prediction of cavitation erosion: An energy approach. Journal of Fluids Engineering, 120, 719-727. [8] Brujan, E.A., Nahen, K., Schmidt, P. and Vogel, A. (2001) Dynamics of laser-induced cavitation bubbles near an elastic boundary. Journal of Fluid Mechanics, 433, 251- 281. [9] Davies, R. (1964) Cavitation in real fluids. Elsevier, New York. [10] Robertson, J.M. and Wislicenus, G.F. (1969) Cavitation state of knowledge. The American Society of Mechanical Engineers, New York. [11] Brennen, C.E. (1995) Cavitation and bubble dynamics. Oxford Press, Oxford. [12] Kimmel, E. (2006) Cavitation bioeffects. Critical Re- views in Biomedical Engineering, 34, 105-161. [13] Apfel, R.E. and Holland, C.K. (1991) Gauging the like- lihood of cavitation from short-pulse, low-duty cycle di- agnostic ultrasound. Ultrasound in Medicine and Biology, 17, 179-185. [14] Barnett, S.B., Ter Haar, G.R., Ziskin, M.C., Nyborg, W.L., Maeda, K. and Bang, K. (1994) Current status of re- search on biophysical effects of ultrasound. Ultrasound in Medicine and Biology, 20, 205-218. [15] Skyba, D.M., Price, R.J., Linka, A.Z., Skalak, T.C. and Kaul, S. (1998) Direct in vivo visualization of intravas- cular destruction of microbubbles by ultrasound and its  R. Ramazani-Rend et al. / J. Biomedical Science and Engineering 3 (2010) 1108-1116 Copyright © 2010 SciRes. JBiSE 1116 local effects on tissue. Circulation, 98, 290-293. [16] Brujan, E.A. (2004) The role of cavitation microjets in the therapeutic applications of ultrasound. Ultrasound in Medicine and Biology, 30, 381-387. [17] Zapanta, C.M., Liszka, E.G., Lamson, T.C., Stinebring, D.R., Deutsch, S., Geselowitz, D.B. and Tarbell, J.M. (1994) A method for real-time in vitro observation of cavitation on prosthetic heart valves. Journal of Biome- chanical Engineering, 116, 460-468. [18] Rambod, E., Beizaie, W., Shusser, W., Milo, S. and Gharib, M. (1999) A physical model describing the mechanism for formation of microbubbles in patients with mitral mechanical heart valves. Annals of Biomedi- cal Engineering, 27, 774-792. [19] Lim, W.L., Chew, Y.T., Low, H.T. and Foo, W.L. (2003) Cavitation phenomena in mechanical heart valves: the role of squeeze flow velocity and contact area on cavita- tion initiation between two impinging rods. Journal of Biomechanics, 36, 1269-1280. [20] Brujan, E.A. (2000) Collapse of cavitation bubbles in blood. Europhysics Letters, 50, 175-181. [21] Zotz, R.J., Erbel, R., Philipp, A., Judt, A., Wagner, H., Lauterborn, W. and Meyer, J. (1992) High-speed rota- tional angioplasty-induced echo contrast in vivo and in vitro optical analysis. Catheterization and Cardiovascu- lar Diagnosis, 26, 98-109. [22] Kini, A., Marmur, J., Duvvuri, S., Dangas, G., Choudhary, S. and Sharma, S. (1999) Rotational atherectomy: im- proved procedural outcome with evolution of technique and equipment. Single-center results of first 1,000 pa- tients. Catheterization and Cardiovascular Interventions, 46, 305-311. [23] Zhong, P., Zhou, Y. and Zhu, S. (2001) Dynamics of bubble oscillation in constrained media and mechanisms of vessel rupture in SWL. Ultrasound in Medicine and Biology, 27, 119-134. [24] Gao, F., Hu, Y. and Hu, H. (2007) Asymmetrical oscilla- tion of a bubble confined inside a micro pseudoelastic blood vessel and the corresponding vessel wall stresses. International Journal of Solids and Structures, 44, 7197- 7212. NOMENCLATURE C turbulence model constants k turbulent kinetic energy p pressure P production term u velocity x coordinate y+ dimensional normal distance from wall SYMBOLS turbulence dissipation dynamic viscosity v kinematic viscosity shear strain rate density Prandtl-number-like diffusion parameters shear stress SUBSCRIPTS i, j tensor indices turb turbulent |