Paper Menu >>
Journal Menu >>
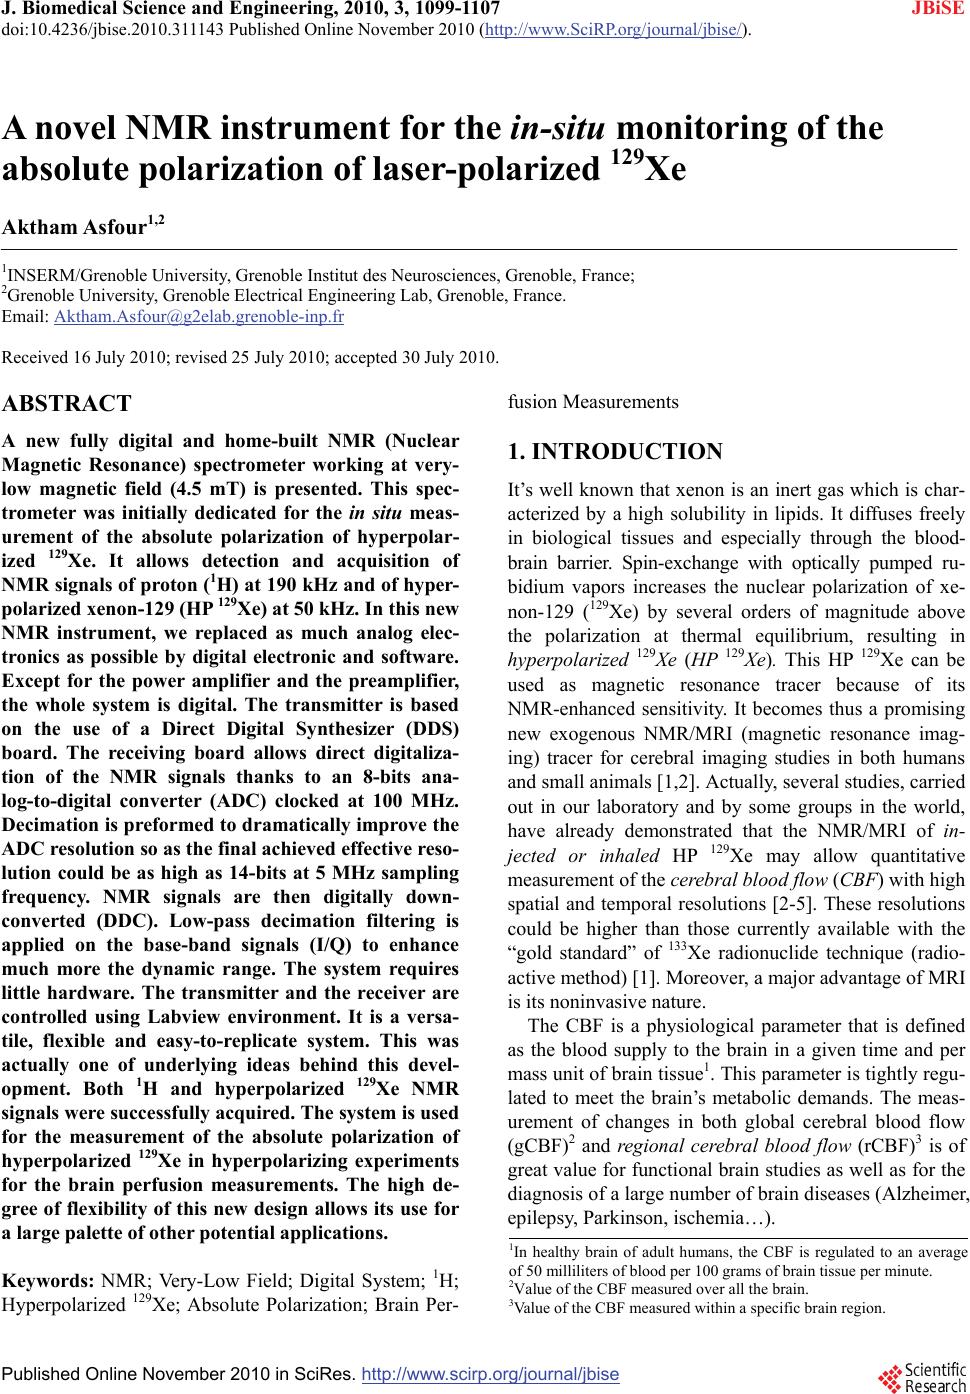 J. Biomedical Science and Engineering, 2010, 3, 1099-1107 JBiSE doi:10.4236/jbise.2010.311143 Published Online November 2010 (http://www.SciRP.org/journal/jbise/). Published Online November 2010 in SciRes. http://www.scirp.org/journal/jbise A novel NMR instrument for the in-situ monitoring of the absolute polarization of laser-polarized 129Xe Aktham Asfour1,2 1INSERM/Grenoble University, Grenoble Institut des Neurosciences, Grenoble, France; 2Grenoble University, Grenoble Electrical Engineering Lab, Grenoble, France. Email: Aktham.Asfour@g2elab.grenoble-inp.fr Received 16 July 2010; revised 25 July 2010; accepted 30 July 2010. ABSTRACT A new fully digital and home-built NMR (Nuclear Magnetic Resonance) spectrometer working at very- low magnetic field (4.5 mT) is presented. This spec- trometer was initially dedicated for the in situ meas- urement of the absolute polarization of hyperpolar- ized 129Xe. It allows detection and acquisition of NMR signals of proton (1H) at 190 kHz and of hyper- polarized xenon-129 (HP 129Xe) at 50 kHz. In this new NMR instrument, we replaced as much analog elec- tronics as possible by digital electronic and software. Except for the power amplifier and the preamplifier, the whole system is digital. The transmitter is based on the use of a Direct Digital Synthesizer (DDS) board. The receiving board allows direct digitaliza- tion of the NMR signals thanks to an 8-bits ana- log-to-digital converter (ADC) clocked at 100 MHz. Decimation is preformed to dramatically improve the ADC resolution so as the final achieved effective reso- lution could be as high as 14-bits at 5 MHz sampling frequency. NMR signals are then digitally down- converted (DDC). Low-pass decimation filtering is applied on the base-band signals (I/Q) to enhance much more the dynamic range. The system requires little hardware. The transmitter and the receiver are controlled using Labview environment. It is a versa- tile, flexible and easy-to-replicate system. This was actually one of underlying ideas behind this devel- opment. Both 1H and hyperpolarized 129Xe NMR signals were successfully acquired. The system is used for the measurement of the absolute polarization of hyperpolarized 129Xe in hyperpolarizing experiments for the brain perfusion measurements. The high de- gree of flexibility of this new design allows its use for a large palette of other potential applications. Keywords: NMR; Very-Low Field; Digital System; 1H; Hyperpolarized 129Xe; Absolute Polarization; Brain Per- fusion Measurements 1. INTRODUCTION It’s well known that xenon is an inert gas which is char- acterized by a high solubility in lipids. It diffuses freely in biological tissues and especially through the blood- brain barrier. Spin-exchange with optically pumped ru- bidium vapors increases the nuclear polarization of xe- non-129 (129Xe) by several orders of magnitude above the polarization at thermal equilibrium, resulting in hyperpolarized 129Xe (HP 129Xe). This HP 12 9 Xe can be used as magnetic resonance tracer because of its NMR-enhanced sensitivity. It becomes thus a promising new exogenous NMR/MRI (magnetic resonance imag- ing) tracer for cerebral imaging studies in both humans and small animals [1,2]. Actually, several studies, carried out in our laboratory and by some groups in the world, have already demonstrated that the NMR/MRI of in- jected or inhaled HP 129Xe may allow quantitative measurement of the cerebral blood flow (CBF) with high spatial and temporal resolutions [2-5]. These resolutions could be higher than those currently available with the “gold standard” of 133Xe radionuclide technique (radio- active method) [1]. Moreover, a major advantage of MRI is its noninvasive nature. The CBF is a physiological parameter that is defined as the blood supply to the brain in a given time and per mass unit of brain tissue1. This parameter is tightly regu- lated to meet the brain’s metabolic demands. The meas- urement of changes in both global cerebral blood flow (gCBF)2 and regional cerebral blood flow (rCBF)3 is of great value for functional brain studies as well as for the diagnosis of a large number of brain diseases (Alzheimer, epilepsy, Parkinson, ischemia…). 1In healthy brain of adult humans, the CBF is regulated to an average of 50 milliliters of blood per 100 grams of brain tissue per minute. 2Value of the CBF measured over all the brain. 3Value of the CBF measured within a specific brain region.  A. Asfour / J. Biomedical Science and Engineering 3 (2010) 1099-1107 Copyright © 2010 SciRes. JBiSE 1100 Nevertheless, for such measurements, especially those of the rCBF, to become quantitatively reliable by the MRI of HP 129Xe, one must first overcome several ex- perimental and instrumental challenges. One of these instrumental challenges concerns the development of specific radiofrequency (RF) probes for these MRI ex- periments. In a recent work, we have actually addressed a solution through a new design of an RF double-tuned (100 MHz-27 MHz) RF volume coil actively-decoupled from a single-tuned (27 MHz) receive-only RF surface coil [6]. In this paper, we deal with another challenge that con- cerns the experimental set-up for polarization build-up of the hyperpolarized 129Xe. This set up is relatively complicated and it requires some know-how. To help the reader in better understanding the MRI of hyperpolarized xenon and to illustrate the scope of this paper, one may need to review some NMR basic princi- ples. Consider a population of N NMR-sensitive (non-zero spin) nuclei (1H, 3He, 129Xe...) subjected to a uniform static magnetic field 0 B . In the microscopic scale, this population will be divided into two categories according to some energy levels considerations. We denoted these categories N (low energy level which corresponds to spins having the same orientation as 0 B ) and N (high energy level which corresponds to spins having orientation opposite to 0 B ), with NN N . We define the absolute polarization, P , of this popu- lation by the Eq . 1: NN NN PNNN (1) Assuming that N and N follow Boltzmann sta- tistics, one can demonstrate, under usual values of mag- netic field B0 and absolute temperature T, that the abso- lute polarization can be expressed by the Eq.2: 0 2B hB PkT (2) where h the Planck constant, B k the Boltzmann con- stant and the gyro-magnetic ratio which character- izes the nucleus. Under these conditions, we say that the population of nuclei is under thermal (or Boltzmann) equilibrium. Therefore, the obtained polarization is sometimes called thermal polarization. The value of the polarization is generally small. For example, at B0 = 1 T and at room temperature, the proton (1H) polarization is only about 10-5 for the usual in vivo proton concentrations. In a basic NMR experiment, the population of nuclei will be subjected to short pulse (called excitation pulse) of a second sinusoidal magnetic field B1, applied at the characteristic Larmor frequency 00 2 f B to the sample. At the end of the excitation pulse, a resonance signal (or the NMR signal) at the same frequency is re- ceived. This signal (S) is directly proportional to the po- larization P according to the Eq.3: 2..SNP (3) The NMR signal is processed to be used for obtaining a “fingerprint” of the environment of the nucleus being studied. It is clear that a high signal level is necessary to achieve the required sensitivity in most MRI applica- tions. For the in vivo proton MRI, the large proton concen- trations (N) and the use of high magnetic fields (0 B) to increase the polarization allow for an exploitable signal level and acceptable sensitivity. Unlike the case of proton NMR/MRI, the in vivo NMR signal of injected or inhaled 129Xe is not exploit- able. Actually, at thermal equilibrium, and for a same magnetic field B0, the NMR signal of a 129Xe population is about 10000 times lower than the one that could be obtained from the same volume of protons. This is be- cause of the intrinsic lower gyro-magnetic ratio (4 times lower), the intrinsic lower thermal polarization and lower density of the xenon (see Eqs.2 & 3). To compensate for these limitations, hyperpolarizing techniques have been successfully used to dramatically increase the polarization level of xenon before using it for the NMR or MRI in-vivo experiments. The hyperpo- larization is actually a physical process that increases the polarization level without the need to increase the mag- netic field B0. Typically, the polarization, and conse- quently the NMR signal, is enhanced by a factor of 105. The injected of inhaled HP 129Xe xenon becomes then a very interesting NMR tracer for brain perfusion meas- urements. In our laboratory, the 129Xe is hyperpolarized by spin- exchange with Rubidium (Rb) optically pumped by laser at 795 nm [7]. The simplified set-up is illustrated by Figure 1. About 0.1 g of Rb is introduced in a 100-ml Pyrex cell, which has subsequently filled with a mixture of He, N2, and natural Xe (26% 129Xe) at 5 bars at room temperature. The cell is heated to about 120°C, set in a 4.5 mT magnetic field produced by Helmholtz coils, and exposed to a circularly polarized laser of 795 nm wave- length. This laser will polarize the Rb electronic spins. The electronic polarization is transferred from Rb elec- trons to 129Xe nuclei. For more details about this process, the interesting reader may refer to [7].  A. Asfour / J. Biomedical Science and Engineering 3 (2010) 1099-1107 Copyright © 2010 SciRes. JBiSE 1101 Figure 1. A simplified scheme of the hyperpolarizing set-up. This optical pumping process is achieved outside the MRI system. In few minutes, about 20 ml of hyperpo- larized xenon-129 (HP 129Xe) can be obtained. This HP 129Xe could then be inhaled or injected for the in vivo MRI experiments of brain perfusion measurement. The achieved polarization is five orders of magnitude larger than its equilibrium (thermal) value. It is therefore called hyperpolarization. It is important to notice that this polarization is not under equilibrium conditions and its value could not be calculated by the Eq.2. Moreover, a determination of the obtained polarization using the theoretical physics of the hyperpolarizing process is not a trivial task since a lot of experimental parameters and conditions could influence the obtained value. This value would be far from the theoretical expected one. Nevertheless, monitoring the available absolute po- larization of the gas during the optical pumping and at the end this process is critical. In fact, one must be able to quantify the effects of changing temperature, pressure, gas mixture, laser power or the position and elements of the laser optical train. The goal is to guarantee a maxi- mum polarization level or to diagnose eventual problems. An in- si tu measurement of the available polarization, during and at the end of the pumping process is then necessary. This measurement could a be performed by NMR technique since the gas being polarized (inside the cell) is subjected to the 4.5 mT static magnetic field produced by the Helmholtz coils. This very-low field is initially needed to maintain the polarization during the optical pumping process. The Larmor frequency f0 at this field is about 52 kHz for xenon and 190 kHz for proton. However, the NMR signal of the HP 129Xe is only pro- portional to the polarization P. It does not allow knowing directly its value. Therefore, in order to a measure this polarization, one needs to compare the NMR signal (SXe) of the HP 129Xe with and another NMR reference signal (Sref) This reference signal could be the NMR signal of thermal 129Xe (not HP 29Xe) or the NMR signal of a sample (reference sample) containing another nucleus such as 1H. Actually, according to the Eq.3, the ratio between these two signals is given by the Eq .4 : 2 2 .. .. XeXe Xe Xe ref refref ref NP S SNP (4) where Xe (respectively ref ) and Xe N (respectively ref N) are the gyro-magnetic ratios and the number of nuclei of the HP 129Xe (respectively of the reference sample). ref P is the thermal polarization of the refer- ence sample. The hyperpolarization, Xe P, can then be calculated from the Eq.5: 2 2 ... .. Xerefref ref Xe ref XeXe SNP P SN (5) This equation shows that the polarization of the HP 129Xe is obtained if we measure the NMR signals of both HP 129Xe and reference sample, since Xe N andref N  A. Asfour / J. Biomedical Science and Engineering 3 (2010) 1099-1107 Copyright © 2010 SciRes. JBiSE 1102 could be determined from the experimental conditions, and the thermal polarization ref P can be calculated from Eq.2. Measuring theses NMR signals requires use of an NMR spectrometer working at 4.5 mT. Such spectrome- ters for such low working frequency (52 kHz for 129Xe and 190 kHz for 1H) are not commercially available, and the development of dedicated low and very-low fre- quencies (up to several 100 kHz or several 1 MHz) NMR systems remains far from the experience of most NMR groups. In fact, to meet the needs of expanding research pro- jects and applications, powerful and expensive spec- trometers or imagers are commercially available. Al- though, these high field NMR systems have many ad- vantages, such as high signal-to-noise ratio (SNR) and high image quality, their use in some specific applica- tions could be prohibitively expensive. Actually, in many cases, for a particular purpose, one may need only an NMR spectrometer having a subset of features of a standard commercial one. Recently, a number of groups have worked to develop dedicated low-cost MRI/NMR systems for a variety of applications, by using compact low-field (so low-cost) MR magnets. For example, we proposed in a previous work a complete home-built digital MRI system working at 0.1 Tesla (which corre- sponds to a resonance frequency of 4.25 MHz) [8]. This system was based on the use of high performance DSP SHARC4 processor, a direct digital synthesizer (DDS) and a digital receiver typically employed in communica- tion applications (mobile phone base-stations). Based on this work, Shen et al. [9] proposed another system working at 0.3 T (about 13 MHz) and allowing larger imaging sizes than in [8]. Another work carried out by C. Michal et al. was focused on the realization of a wide- band high performance receiver for a home-built NMR spectrometer working at 55.84 MHz (high field) [10]. In any case, the development of home-built and dedicated low and very-low field NMR systems remains the work of only few research groups arround the world. In the context of measuring the polarization in hyper- polarized gases experiments, some research groups have NMR apparatus. These NMR systems were developed by modifying high frequency and high cost commercial spectrometers. One research group has however devel- oped its own complete NMR system for measuring the polarization of hyperpolarized helium-3 (3He) [11]. It was a fully analog system (for both transmit and receive channels) where authors performed a phase-sensitive detection of the NMR signal. They used then an oscillo- scope for signal visualization Despite the great merit of the original and elegant electronic solutions developed in [11], the detection of hyperpolarized 3He signals was relatively not a hard task since their levels were quite high (at least 10 mV). Actu- ally, the spectrometer described by Saam et al. did not allow sufficient dynamic range to detect thermal 3He (not hyperpolarized 3He) signal or even 1H signal (de- spite the high density of water) at such very-low field. Indeed, the detection of these signals is far from trivial at very-low field since their levels are, at least, four to five orders of magnitude lower than the signal of hyperpo- larized 3He. It was however necessary, for Saam et al. to detect thermal 3He or 1H (water) reference signals to measure the absolute polarization of hyperpolarized 3He. In fact, as we have mentioned, the measurement method consists in comparing the levels of hyperpolarized 3He signals to another reference signal such as thermal 3He or 1H signals. Sam et al. have done their comparison at high field (B0 = 2 T). Nevertheless, in this comparison (not in situ measurements which is not convenient), losses in the hyperpolarized 3He polarization during transport from the hyper-polarizing set-up to the high field NMR spectrometer may not guarantee accurate measurements of the initial obtained polarization. In the present paper, we propose an NMR system that allows detection of both HP 129Xe and 1H signals at 4.5 mT. The system allows then the in-situ measurement of the absolute polarization. In fact, the dynamic range of- fered by our system allows detection of water equilib- rium NMR signal at very-low field (4.5 mT) so as the calibration of the spectrometer can be done without transporting the gas to the high field spectrometer and consequently without loss in polarization. It is a fully digital system. One of the underlying ideas of this work is to make the apparatus versatile and easy to replicate so as to help the interesting groups to simply develop such NMR spectrometer. In addition of the measurement of the absolute polarization, some others potential applications of this developed spectrometer will be addressed. 2. MATERIALS AND METHODS Unlike our first work at 4.25 MHz [8], where we used very advanced digital electronics and signal processing techniques which were typically employed for mobile phone applications, we use here data acquisition boards (DAQ) since they were adequate at such low frequencies. Moreover, these DAQ have increased in performance and the related software made their use quite straight- forward. The general architecture of our home-built NMR sys- tem is illustrated by Figure 2. The static field B0 of 4AD2106x from Analog Devices  A. Asfour / J. Biomedical Science and Engineering 3 (2010) 1099-1107 Copyright © 2010 SciRes. JBiSE 1103 Figure 2. The general architecture of the NMR system. about 4.5 mT is produced by the Helmholtz pair in which the Pyrex cell is placed and the optical pumping is performed. The excitation pulse (at 52 kHz for HP 129Xe and 190 kHz for 1H) is generated by the transmitter (signal gen- erator board NI 5411 form National Instruments). This pulse is amplified by a power amplifier and sent, via the duplexer, to the well-tuned coil (at 190 kHz or 52 kHz) which generates the excitation field B1. At the end of the excitation pulse, the same tuned coil (transmit-receive coil) detect the weak NMR signal. This signal is transmitted to a low noise preamplifier via the duplexer. The amplified signal is then received by the receiving board (NI 5911 from National Instruments) for digitalization and quadratic demodulation. 2.1. The Pulse Transmitter and the Power Amplifier For generating pulse, we used the Direct Digital Synthe- sis (DDS) technique available with the PC board NI 5411. This technique allows deriving, under digital con- trol, an analog frequency source from a reference clock frequency. Compared to analog synthesis techniques, The DDS produces high frequency accuracy and resolu- tion, temperature stability, rapid and phase-continuous frequency switching, and it offers low phase noise. The transmitting board uses a 32-bit, high-speed ac- cumulator with a lockup memory and a 12-bit DAC for DDS-based pulse generation. This generated pulse is amplified by an op-amp-based power amplifier stage. The op-amp (AD711KN) is cho- sen for its high output slew rate. The stage allows more than 20 V peak-to-peak output measured on a high im- pedance oscilloscope. Since the transmitter is loaded by transmit-receive coil, the design of the op-amp-based power amplifier has to take care of instabilities that usually appear when the amplifier is loaded by the capacitive and inductive coil. 2.2. The Transmit/Receive Well-Tuned Coil and the Duplexer The well-tuned coil is one of the key elements for a suc- cessful detection of the weak NMR signals (especially those of protons). Calculations showed that a quality factor Q of at least 200 (at 190 kHz) is necessary. We realized a surface coil of about 400 turns of a Litz wire with an average diameter of 2 cm and a height of 0.5 cm. The developed inductance is about 1.3 mH measured at 190 kHz. Even at relatively low frequency such as 190 kHz, the use of a Litz wire was important to achieve high quality factor Q. The measured quality factor of the coil was 220 at 190 kHz and 130 at 52 kHz, about two times and a half that achieved with solid wire of the same gauge and geometry. The coil was tuned using fixed capacitors and variable ones. Notice that the same coil is easily used for the both frequencies. The only modifications are the tuning ca- pacitors. To facilitate these modifications, tuning com- ponents were plug-ins on pin DIP component carriers. The tuned coil is connected to the duplexer by ordinary coaxial cable; there are no tuning elements near the coil. Actually, the tuning elements are placed on the duplexer printed board. This duplexer “blinks” the preamplifier during the ex-  A. Asfour / J. Biomedical Science and Engineering 3 (2010) 1099-1107 Copyright © 2010 SciRes. JBiSE 1104 citation pulse transmission and insulates the transmitter from the receiver during the receiving period. This du- plexer, based of the use of a FET transistor switch, is controlled by a TTL compatible signal generated by the transmitter board (Figure 2). 2.3. The Low-Noise Preamplifier The low noise preamplifier is the second key element for NMR signal receiving at very-low field. The one that we developed was based on the use of the OP37 low noise op-amp. It was high gain and low noise. The design of high gain and low noise preamplifiers is relatively com- plicated and requires some know-how. Our preamplifier is gain-programmable between 2 and 2000 (6 dB to 66 dB). We used typically a gain of 60 dB for the detection of 1H signals and 6 dB for the detection of 129Xe signals. Optional analog filters could be used or not in adequate locations between the different stages of the preamplifier to optimize the SNR and/or the dynamic range. The output of the preamplifier is directly connected to input of the receiving board 2.4. The Digital Signal Receiving The receiving board (NI 5911 from National Instruments) is the last receiving key element. The input signal is scaled to match the full input range of an 8-bit ana- log-to-digital converter (ADC) clocked at 100 MHz. For our application, a resolution of 8 bits is not sufficient. The down-sampling allowed by the receiving board can dramatically enhance the ADC effective resolution. We used typically a down-sampling factor of 20 so as the final ADC effective resolution was of 14 bits at 5 MHz sampling frequency. After down-sampling, digital down-conversion (DDC) or digital demodulation was performed by software as illustrated in Figure 3. The digital signal is multiplied by digital sine and co- sine waveforms. The quadratic base-band signals (I/Q) were obtained after decimation and low-pass filtering. Actually, since the useful bandwidth of these base-band signals is no more than 1000 Hz, these low-pass decima- tion filters, with programmable decimation factors, were used to improve the final dynamic range and the sig- nal-to-noise ratio (SNR). 2.5. The Graphical User Interface The GUI and control program was developed using LABVIW environment. The architecture of the program is open, which lets users build their own modules if wanted. The program allows the user to choose the exci- tation frequency (consequently the nucleus: 1H, 129Xe…), amplitude, and duration of the excitation pulse as well as the repetition time of a one-pulse NMR sequence. Other parameters that concern some hardware configurations Figure 3. Down-sampling and Digital Down-Conversion (DDC) of the NMR signals.  A. Asfour / J. Biomedical Science and Engineering 3 (2010) 1099-1107 Copyright © 2010 SciRes. JBiSE 1105 of the NI 5411 are not available in the GUI but they could be modified if required in the LABVIEW Diagram of the program. The signal acquisition is done according to the parameters defined by the user in the GUI. These parameters are the scale of the input, number of points to be acquired and the down-sampling factor of the ADC. The effective ADC resolution could be displayed for information. The acquired digital data are read from the buffer of the DAQ board. Quadratic digital demodulation is per- formed. User can choose the demodulation parameters (frequency, phase and amplitude) as well as the decima- tion factor of the final low pass digital filters. The GUI allows displaying of base-band signals (I/Q) and the NMR signal spectrum (Fast Fourier Transform of the NMR signal). Users could add more modules in the pro- gram to perform others kinds of measurements on the acquired signal or on its spectrum. Notice finally that the program contains two modules which are dedicated to the calibration of the flip-angle of the excitation pulse and for the transmit/receive coil tuning and matching. 3. RESULTS AND DISCUSSIONS 3.1. Acquired NMR Signals Figure 4 shows, respectively, the quadratic base-band HP 129Xe NMR signals and the signal spectrum acquired at 4.5 mT with the developed spectrometer. The excitation pulse duration was of the 800 µs with a repetition time of 2 seconds. The gain of the low-noise preamplifier was set to 6 dB. The sampling frequency of the received signal before the DDC was of 5 MHz so as the effective ADC resolution was of 14 bits. The final sampling frequency in the base-band was of 10 kHz. As it was mentioned in the introduction, the meas- urement of absolute polarization requires comparing the signal of hyperpolarized gas to a reference signal at thermal equilibrium at 4.5 mT. However, since equilib- rium polarization and gas density are very low, these two signals are far apart in magnitude. An alternative solu- tion is to compare the hyperpolarized 129Xe signal with the equilibrium water signal (higher signal level than 129Xe signal thanks to the higher density of water). The dynamic range offered by our system allowed detection of such water equilibrium NMR signal at very- low field (4.5 mT) so as the calibration of the spec- trometer can be done without transporting the gas to the high field spectrometer and consequently without loss in polarization. We used so the developed spectrometer to acquire 1H signal at 4.5 mT (about 190 kHz of Larmor frequency). The sample used for 1H signal acquisition is a pyrex Figure 4. The I and Q parts of the 129Xe NMR signal (upper figure) and its spectrum (lower figure) obtained with the de- veloped spectrometer at 4.5 mT. No signal averaging was used. reference cell filled with pure water. This reference cell has the same shape and the same volume that the one which usually contains the HP 129Xe. An example of 1H signals and their spectrum is given in Figure 5. These signals were collected by the same coil that was used for collecting 129Xe signals and which was retuned to 190 kHz by simply modifying the tuning capacitors. The gain of the preamplifier was set to 60 dB and 10 signal averages were used. All the other sequence and acquisition parameters were identical to those used for 129Xe signals acquisition. This calculation of the absolute polarization of the HP 129Xe is straightforward using these acquired signals and the Eq.5. To illustrate an example, we studied the influence of the temperature of the cell on the available polarization. Figure 6 shows the results. In this figure, the value of  A. Asfour / J. Biomedical Science and Engineering 3 (2010) 1099-1107 Copyright © 2010 SciRes. JBiSE 1106 Figure 5. The I and Q parts of the 1H NMR signal (upper fig- ure) and its spectrum (lower figure) obtained with the devel- oped spectrometer at 4.5 mT. Only 10 signal averages were used. Figure 6. Influence of the temperature of the cell on the avail- able absolute polarization. For each temperature, the polariza- tion was measured after about 2 minutes of optical pumping. the hyperpolarization is given in % (it represents actually the quantity 100 Xe NN PN %). This figure suggests that the optimum working tem- perature for our system is about 90°C. At this tempera- ture, the available polarization was about 5.8 %. This is very useful information since our working temperature was thought to be about 110°C before developing this control NMR system. Actually, calibration of the opti- mum temperature was performed at high field (2.35 T) some years ago and was considered to be unchanged. We think that changing the laser source and the cell by new ones (this has been done after high field calibration) has led to a different optimum temperature. The developed system allows a convenient tool to monitor very easily and at each moment the amount of the polarization and to define the optimum working parameters. We are now studying the influence of the pressure, the laser power and the cell in order to obtain the highest polarization When compared with the common method, which is based on the use of high field spectrometers, this new measurement method presents important advantages. The main advantage is that the new method allows in situ measurement of the polarization during the optical pumping process. This is fundamental since it is neces- sary to quantify the influence of the different parameters of the process and to adjust them in order to guarantee the maximum polarization. A second advantage is that the new method allows measurement without losses in the polarization. Actually, in our set-up, we observed a loss of about 2% in polarization during the transport of the HP 129Xe to the high field spectrometer. Other ad- vantages are related to the low cost and the simplicity of use of the developed system which can be used continu- ously without occupying the high field systems… The only limitation of the new method could be the detection of a 1H NMR signal magnetic fields lower than 4.5 mT are used in the polarization set-up (Helmholtz coil). Actually, we did not try to detect 1H NMR signals at lower fields. This problem is out of the scope of this paper. In addition to the measurement of the polarization in hyperpolarization experiments, there is a large palette of potential applications of this developed spectrometer. Theses applications may especially concern NMR non- invasive measurements. A first potential application could be the measurement of the quantity of water con- tained in a given sample. Actually, the NMR signal is proportional to the density of water within the sample. One could then quantify the degree of humidity of the sample. A second application could concern the meas- urement of both transversal T2 and longitudinal T1 re- laxation times of the sample. This could find application  A. Asfour / J. Biomedical Science and Engineering 3 (2010) 1099-1107 Copyright © 2010 SciRes. JBiSE 1107 for temperature measurement of biological samples. Ac- tually, NMR is a very important technique for measuring temperature of a sample in millikelvin and below [12] through the temperature dependence of the spin-lattice relaxation time T1 or through the measurement of mag- netic susceptibility (measurement of the effective trans- versal relaxation time * 2 T). These measurements should be performed at frequencies below 1 MHz to minimize power dissipation in the sample. Our developed spec- trometer is adequate for these applications. Specific pulse sequences, which are necessary for such measure- ments could be easily implemented on our system with- out hardware modifications. This is actually allowed by flexibility of the design and to the open structure of the program. Another potential application of this non exhaustive palette of applications may concern educational purposes in the field of electronics, signal processing and bio- medical engineering. This could be allowed, once again, thanks to the flexible and open structure of both hard- ware and software of the spectrometer. In fact, we are currently building another version of this spectrometer in the Physics Department of Measurement (Technological Institute of the University Joseph Fourier at Grenoble). Practical courses and projects in electronics, signal pro- cessing, instrumentation and measurements, NMR phys- ics could be take place during and after the development of the spectrometer. Students could simulate and build by themselves the source of the magnetic field (Helm- holtz coils), the power amplifier, the duplexer, the coil and the preamplifier. They could also develop their own applications for the control of the NMR sequence and the data acquisition and processing under LABVVIEW environment. Notice finally that this low frequency NMR spec- trometer could also be dedicated for others applications with working frequencies as high as 20 MHz, without any change on the hardware (except for the tuned coil). The spectrometer is low cost and easily transportable (for in situ experiments for example). It is also an easy- to-replicate system. Full developed circuits, part refer- ences, PC Board, controlling programs and any other detail about the system can be obtained by simply writ- ing to author. 4. CONCLUSIONS We presented a fully home-built NMR spectrometer for the measurement of the absolute polarization of laser- polarized gases. The system described here has been in use in our lab for more than one year and gives a reliable measurement of the polarization. The flexibility of the system allows its use for other NMR applications with- out (or with minor) hardware and software modification. 5. ACKNOWLEDGEMENTS The authors would like to thank Christoph SEGEBARTH, Director of the Team 5 of The Grenoble Institute of Neurosciences (GIN) for sup- porting this work. REFERENCES [1] Duhamel, G., et al. (2001). Xenon-129 MR imaging and spectroscopy of rat brainusing arterial delivery of hyper- polarized xenon in alipid emulsion. Magnetic Resonance in Medicine (MRM), 46, 208-212. [2] Duhamel, G., et al. (2002) Global and regional cerebral blood flow measurements using NMR of injected hyper- polarized xenon-129. Academic Radiology, 9(2), 498- 500. [3] Kilian, W., et al. (2004) Dynamic NMR spectroscopy of hyperpolarized 129 Xe in human brain analyzed by an up- take model. Magnetic Resonance in Medicine (MRM), 51, 843-847. [4] Venkatesh, A.K., et al. (2001) Using dynamic hyperpo- larized xenon MR to measure brain perfusion, Proceed- ings of the International Society of Magnetic Resonance in Medicine, 9, 951. [5] Swanson, S.D., et al. (1997) Brain MRI with laser- po- larized 129Xe. Magnetic Resonance in Medicine (MRM), 38, 695-698. [6] Asfour, A. (2010) Design and Development of a New Dedicated RF Sensor for the MRI of the Rat Brain, Jour- nal of Biomedical Science and Engineering (JBISE), 3, 167-180. [7] Happer, W., et al. (1984) Polarization of the nuclear spins of noble-gas atoms by spin exchange with optically pumped alkali-metal atoms. Physical Review A, 29, 3092-3110. [8] Raoof, K. Asfour, A. and Fournier, J.-M. (2002) A com- plete digital magnetic resonance imaging (MRI) system at low magnetic field (0.1 T). Proceedings of the IEEE Instrumentation and Measurement Technology Confer- ence IMTC 2002, Anchorage, Alaska, 20-23 May 2002. [9] Shen J., et al. (2005) Home-built magnetic resonance imaging system (0.3 T) with a complete digital spec- trometer, Review of Scientific Instruments, 76, 105101- 105108. [10] Michal, C.A., Broughton, K. and Hansen, E. (2002) A high performance digital receiver for home-built nuclear magnetic resonance spectrometers. Review of Scientific Instruments, 73(2), 453-458. [11] Saam, B.T. and Conradi, M.S. (1998) Low frequency NMR polarimeter for hyperpolarized gases. Journal of Magnetic Resonance (JMR), 134, 67-71. [12] Pobell, F. (1991) Matter and methods at low temperatures. Spring, Berlin. |