 Journal of Water Resource and Protection, 2013, 5, 446-457 http://dx.doi.org/10.4236/jwarp.2013.54044 Published Online April 2013 (http://www.scirp.org/journal/jwarp) Adsorption of Three Commercial Dyes onto Chitos an Beads Using Spectrophotometric Determination and a Multivariate Calibration Method Manuela Mincea1*#, Viorica Patrulea1#, Ana Negrulescu1, Robert Szabo2, Vasile Ostafe1† 1Advanced Environmental Research Laboratories, West University of Timisoara, Timisoara, Romania 2Faculty of Mathematics and Computer Science, West University of Timisoara, Timisoara, Romania Email: †vostafe@cbg.uvt.ro Received December 16, 2012; revised January 21, 2013; accepted January 30, 2013 Copyright © 2013 Manuela Mincea et al. This is an open access article distributed under the Creative Commons Attribution License, which permits unrestricted use, distribution, and reproduction in any medium, provided the original work is properly cited. ABSTRACT A simple and rapid analytical method for the simultaneous quantification of three commercial azo dyes—Tartrazine (TAR), Congo Red (CR), and Amido Black (AB) in water is presented. The simultaneous assessment of the individual concentration of an organic dye in mixtures using a spectrophotometric method is a difficult procedure in analytical chemistry, due to spectral overlapping. This drawback can be overcome if a multivariate calibration method such as Partial Least Squares Regression (PLSR) is used. This study presents a calibration model based on absorption spectra in the 300 - 650 nm range for a set of 20 different mixtures of dyes, followed by the prediction of the concentrations of dyes in 6 validation mixtures, randomly selected, using the PLSR method. Estimated limits of detection (LOD) were 0.106, 0.047 and 0.079 mg/L for TAR, CR, and AB, respectively, and limits of quantification (LOQ) were 0.355, 0.157 and 0.265 mg/L for TAR, CR, and AB, respectively. Quantitative determination of the three azo dyes was performed following optimized adsorption experiments onto chitosan beads of mixtures of TAR, CR and AB. Adsorption isotherm and kinetic studies were carried out, proving that the proposed PLSR method is rapid, accurate and reliable. Keywords: Univariate Calibration; Multivariate Calibration; Spectral Overlap; Partial Least Squares Regression; Commercial Dyes; Adsorption 1. Introduction During the past decades, many methods for the assay and removal of chemical compounds from wastewaters have been developed. This is an important consequence of the growing awareness raised by the effect of water pollution on the environment [1]. One major contributor to wastewater pollution is dyes. Both natural and synthetic dyes are extensively used in many human activities, such as food and beverages in- dustry, textile, leather, cosmetic and drugs industries and many more [2,3]. The present study focuses on three in- dustrially used dyes, Tartrazine (TAR) (Figure 1(a)), which is applied in coloring soft drinks, foods, drugs and cosmetics [3], Congo Red (CR) (Figure 1(c)), used in paper, plastic, textile and dyes industries [4,5], and Amido Black (AB) (Figure 1(b)), which can be con- tained by inks, paints and leather colorings, due to its applicability on different natural and synthetic fibers, such as cotton, silk, polyesters, rayon and so on [6]. In higher amount, besides the intense colors of wastewaters resulting from the previously mentioned industries, these dyes are toxic [2,7,8]. Previous studies emphasized that a concentration of dye as low as 1 mg/L, determines the visible coloration of water [2] and concentrations from 10 - 25 mg/L have serious effects on the health and life of zooplankton and water ecosystem fish populations [9]. When dyes are discharged in rivers they are diluted, and in wastewaters they have concentration ranging within the level of μg/L [10]. Due to the fact that dyes are stable to oxidizing agents, light and heat, their removal from wastewaters represents a great challenge. Moreover, most dyes, especially synthetic ones are biologically non-de- gradable [7]. *Manuela Mincea is temporally affiliated to “Alexandru Ioan Cuza” University, Iasi, Romania. #Co-first authors. †Corresponding autho . The spectrophotometric determination has been widely used for dyes, especially when the purpose was to assess singular dye concentrations. Nevertheless, there is more C opyright © 2013 SciRes. JWARP 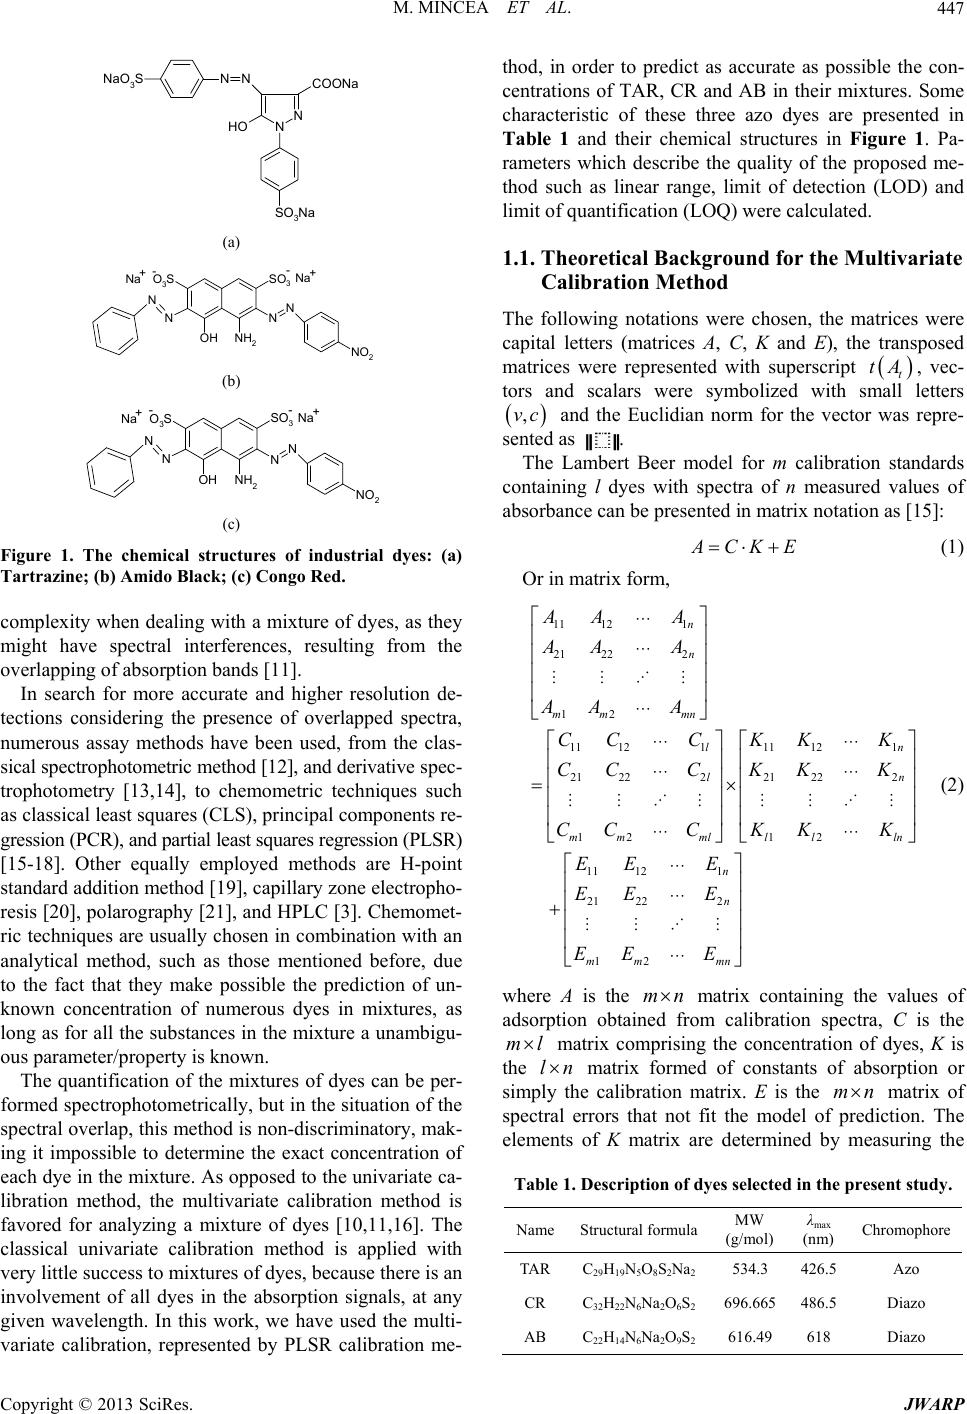 M. MINCEA ET AL. 447 N N NaO3SN N OH COONa SO3Na (a) Na Na OH NH2 N N O3SSO3 NN NO2 - +-+ Na (b) Na OH NH2 N N O3SSO3 NN NO2 - +-+ (c) Figure 1. The chemical structures of industrial dyes: (a) Tartrazine; (b) Amido Black; (c) Congo Red. complexity when dealing with a mixture of dyes, as they might have spectral interferences, resulting from the overlapping of absorption bands [11]. In search for more accurate and higher resolution de- tections considering the presence of overlapped spectra, numerous assay methods have been used, from the clas- sical spectrophotometric method [12], and derivative spec- trophotometry [13,14], to chemometric techniques such as classical least squares (CLS), principal components re- gression (PCR), and partial least squares regression (PLSR) [15-18]. Other equally employed methods are H-point standard addition method [19], capillary zone electropho- resis [20], polarography [21], and HPLC [3]. Chemomet- ric techniques are usually chosen in combination with an analytical method, such as those mentioned before, due to the fact that they make possible the prediction of un- known concentration of numerous dyes in mixtures, as long as for all the substances in the mixture a unambigu- ous parameter/property is known. The quantification of the mixtures of dyes can be per- formed spectrophotometrically, but in the situation of the spectral overlap, this method is non-discriminatory, mak- ing it impossible to determine the exact concentration of each dye in the mixture. As opposed to the univariate ca- libration method, the multivariate calibration method is favored for analyzing a mixture of dyes [10,11,16]. The classical univariate calibration method is applied with very little success to mixtures of dyes, because there is an involvement of all dyes in the absorption signals, at any given wavelength. In this work, we have used the multi- variate calibration, represented by PLSR calibration me- thod, in order to predict as accurate as possible the con- centrations of TAR, CR and AB in their mixtures. Some characteristic of these three azo dyes are presented in Table 1 and their chemical structures in Figure 1. Pa- rameters which describe the quality of the proposed me- thod such as linear range, limit of detection (LOD) and limit of quantification (LOQ) were calculated. 1.1. Theoretical Background for the Multivariate Calibration Method The following notations were chosen, the matrices were capital letters (matrices A, C, K and E), the transposed matrices were represented with superscript tA t, vec- tors and scalars were symbolized with small letters ,vc and the Euclidian norm for the vector was repre- sented as . The Lambert Beer model for m calibration standards containing l dyes with spectra of n measured values of absorbance can be presented in matrix notation as [15]: CK E 11 121 21 222 12 11 12111 121 2122221 222 12 12 11 121 21 222 12 n n mm mn ln ln mmmll lln n n mm mn AA A AA A AA A CCCKKK CCC KKK CCC KKK EE E EE E EE E (1) Or in matrix form, Λ Λ ΜΜ Μ Λ ΛΛ ΛΛ ΜΜΜΜΜ ΛΛ Λ Λ Ν Ν ΜΜ Ν ΝΜ Λ mn (2) where A is the matrix containing the values of adsorption obtained from calibration spectra, C is the ml matrix comprising the concentration of dyes, K is the ln matrix formed of constants of absorption or simply the calibration matrix. E is the matrix of spectral errors that not fit the model of prediction. The elements of K matrix are determined by measuring the mn Table 1. Description of dyes selected in the present study. NameStructural formulaMW (g/mol) λmax (nm) Chromophore TARC29H19N5O8S2Na2534.3 426.5 Azo CR C32H22N6Na2O6S2696.665 486.5 Diazo AB C22H14N6Na2O9S2616.49 618 Diazo Copyright © 2013 SciRes. JWARP 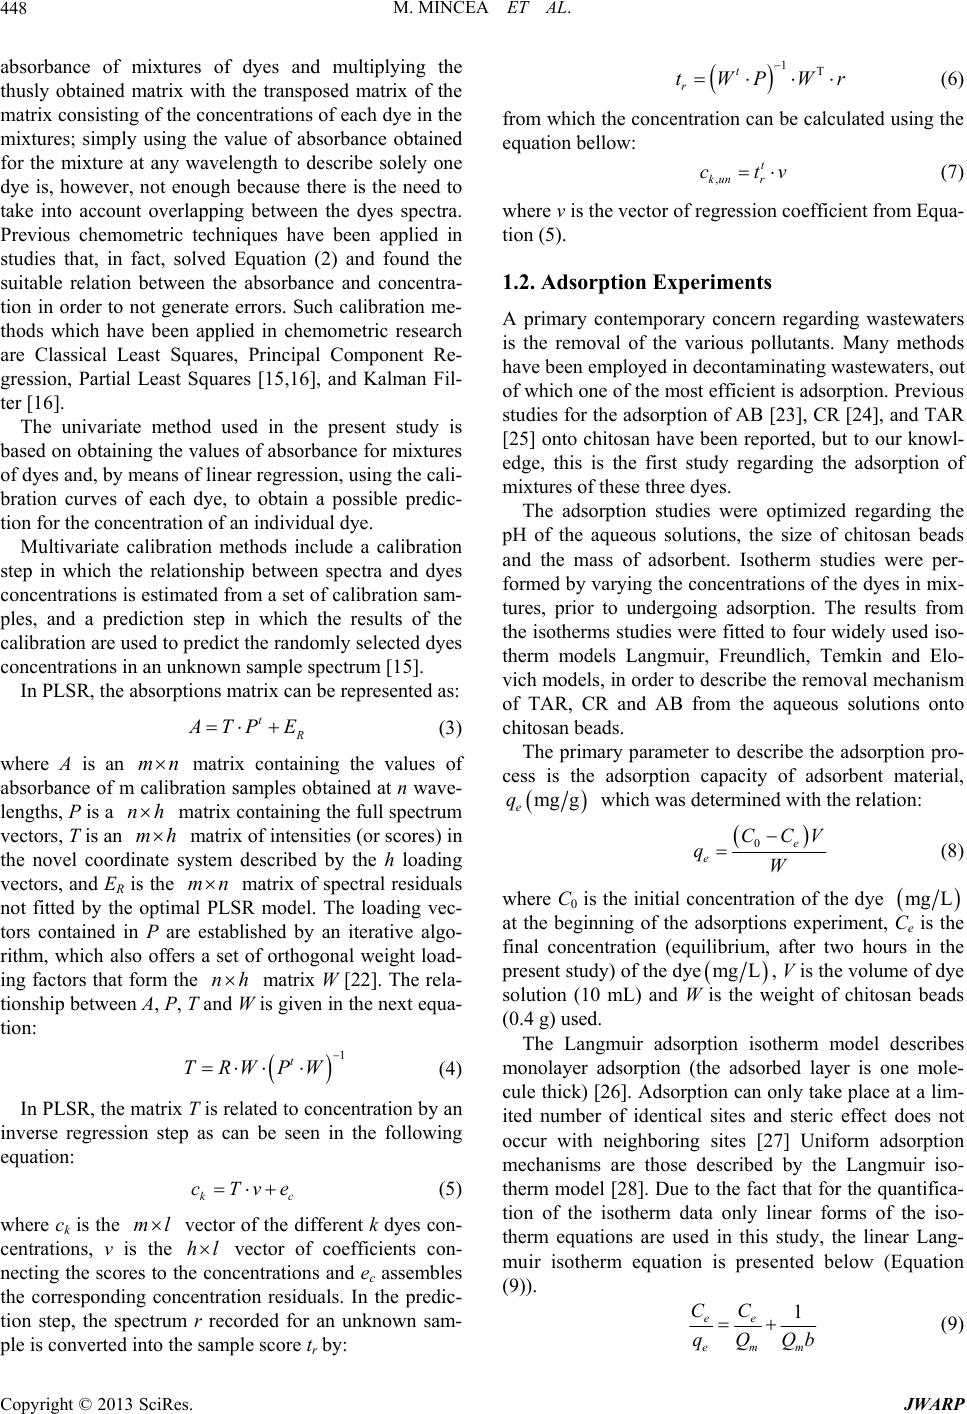 M. MINCEA ET AL. 448 absorbance of mixtures of dyes and multiplying the thusly obtained matrix with the transposed matrix of the matrix consisting of the concentrations of each dye in the mixtures; simply using the value of absorbance obtained for the mixture at any wavelength to describe solely one dye is, however, not enough because there is the need to take into account overlapping between the dyes spectra. Previous chemometric techniques have been applied in studies that, in fact, solved Equation (2) and found the suitable relation between the absorbance and concentra- tion in order to not generate errors. Such calibration me- thods which have been applied in chemometric research are Classical Least Squares, Principal Component Re- gression, Partial Least Squares [15,16], and Kalman Fil- ter [16]. The univariate method used in the present study is based on obtaining the values of absorbance for mixtures of dyes and, by means of linear regression, using the cali- bration curves of each dye, to obtain a possible predic- tion for the concentration of an individual dye. Multivariate calibration methods include a calibration step in which the relationship between spectra and dyes concentrations is estimated from a set of calibration sam- ples, and a prediction step in which the results of the calibration are used to predict the randomly selected dyes concentrations in an unknown sample spectrum [15]. In PLSR, the absorptions matrix can be represented as: t TP E mn nh mh mn nh 1 t WPW kc cTve ml l 1Tt r tWPWr , t kunr ctv (3) where A is an matrix containing the values of absorbance of m calibration samples obtained at n wave- lengths, P is a matrix containing the full spectrum vectors, T is an matrix of intensities (or scores) in the novel coordinate system described by the h loading vectors, and ER is the matrix of spectral residuals not fitted by the optimal PLSR model. The loading vec- tors contained in P are established by an iterative algo- rithm, which also offers a set of orthogonal weight load- ing factors that form the matrix W [22]. The rela- tionship between A, P, T and W is given in the next equa- tion: TR (4) In PLSR, the matrix T is related to concentration by an inverse regression step as can be seen in the following equation: (5) where ck is the vector of the different k dyes con- centrations, v is the h vector of coefficients con- necting the scores to the concentrations and ec assembles the corresponding concentration residuals. In the predic- tion step, the spectrum r recorded for an unknown sam- ple is converted into the sample score tr by: (6) from which the concentration can be calculated using the equation bellow: (7) where v is the vector of regression coefficient from Equa- tion (5). 1.2. Adsorption Experiments A primary contemporary concern regarding wastewaters is the removal of the various pollutants. Many methods have been employed in decontaminating wastewaters, out of which one of the most efficient is adsorption. Previous studies for the adsorption of AB [23], CR [24], and TAR [25] onto chitosan have been reported, but to our knowl- edge, this is the first study regarding the adsorption of mixtures of these three dyes. The adsorption studies were optimized regarding the pH of the aqueous solutions, the size of chitosan beads and the mass of adsorbent. Isotherm studies were per- formed by varying the concentrations of the dyes in mix- tures, prior to undergoing adsorption. The results from the isotherms studies were fitted to four widely used iso- therm models Langmuir, Freundlich, Temkin and Elo- vich models, in order to describe the removal mechanism of TAR, CR and AB from the aqueous solutions onto chitosan beads. The primary parameter to describe the adsorption pro- cess is the adsorption capacity of adsorbent material, mg g e q which was determined with the relation: 0e e CCV qW (8) where C0 is the initial concentration of the dye mg L at the beginning of the adsorptions experiment, Ce is the final concentration (equilibrium, after two hours in the present study) of the dye mg L, V is the volume of dye solution (10 mL) and W is the weight of chitosan beads (0.4 g) used. The Langmuir adsorption isotherm model describes monolayer adsorption (the adsorbed layer is one mole- cule thick) [26]. Adsorption can only take place at a lim- ited number of identical sites and steric effect does not occur with neighboring sites [27] Uniform adsorption mechanisms are those described by the Langmuir iso- therm model [28]. Due to the fact that for the quantifica- tion of the isotherm data only linear forms of the iso- therm equations are used in this study, the linear Lang- muir isotherm equation is presented below (Equation (9)). 1 ee emm CC qQQb (9) Copyright © 2013 SciRes. JWARP 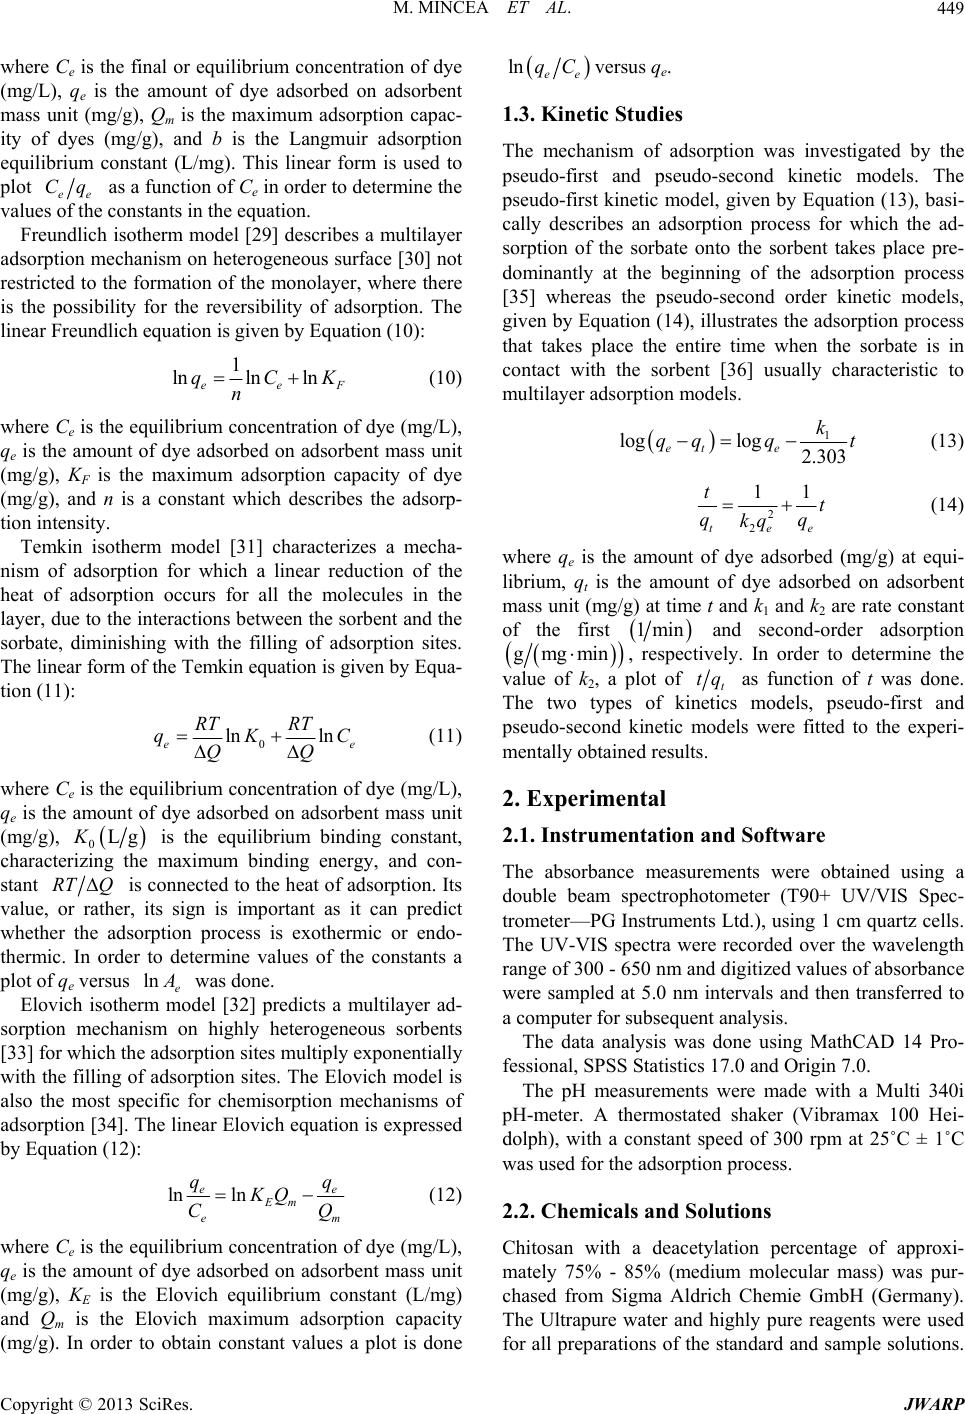 M. MINCEA ET AL. 449 where Ce is the final or equilibrium concentration of dye (mg/L), qe is the amount of dye adsorbed on adsorbent mass unit (mg/g), Qm is the maximum adsorption capac- ity of dyes (mg/g), and b is the Langmuir adsorption equilibrium constant (L/mg). This linear form is used to plot ee as a function of Ce in order to determine the values of the constants in the equation. Cq Freundlich isotherm model [29] describes a multilayer adsorption mechanism on heterogeneous surface [30] not restricted to the formation of the monolayer, where there is the possibility for the reversibility of adsorption. The linear Freundlich equation is given by Equation (10): 1 ln nln ln eeF qCK (10) where Ce is the equilibrium concentration of dye (mg/L), qe is the amount of dye adsorbed on adsorbent mass unit (mg/g), KF is the maximum adsorption capacity of dye (mg/g), and n is a constant which describes the adsorp- tion intensity. Temkin isotherm model [31] characterizes a mecha- nism of adsorption for which a linear reduction of the heat of adsorption occurs for all the molecules in the layer, due to the interactions between the sorbent and the sorbate, diminishing with the filling of adsorption sites. The linear form of the Temkin equation is given by Equa- tion (11): 0ln ee RT C QQ ln RT qK (11) where Ce is the equilibrium concentration of dye (mg/L), qe is the amount of dye adsorbed on adsorbent mass unit (mg/g), 0 is the equilibrium binding constant, characterizing the maximum binding energy, and con- stant LgK RT Q ln is connected to the heat of adsorption. Its value, or rather, its sign is important as it can predict whether the adsorption process is exothermic or endo- thermic. In order to determine values of the constants a plot of qe versus e was done. Elovich isotherm model [32] predicts a multilayer ad- sorption mechanism on highly heterogeneous sorbents [33] for which the adsorption sites multiply exponentially with the filling of adsorption sites. The Elovich model is also the most specific for chemisorption mechanisms of adsorption [34]. The linear Elovich equation is expressed by Equation (12): ln ln ee Em em qq KQ CQ (12) where Ce is the equilibrium concentration of dye (mg/L), qe is the amount of dye adsorbed on adsorbent mass unit (mg/g), KE is the Elovich equilibrium constant (L/mg) and Qm is the Elovich maximum adsorption capacity (mg/g). In order to obtain constant values a plot is done lnee qC versus qe. 1.3. Kinetic Studies The mechanism of adsorption was investigated by the pseudo-first and pseudo-second kinetic models. The pseudo-first kinetic model, given by Equation (13), basi- cally describes an adsorption process for which the ad- sorption of the sorbate onto the sorbent takes place pre- dominantly at the beginning of the adsorption process [35] whereas the pseudo-second order kinetic models, given by Equation (14), illustrates the adsorption process that takes place the entire time when the sorbate is in contact with the sorbent [36] usually characteristic to multilayer adsorption models. 1 loglog 2.303 et e k qq qt (13) 2 2 11 te e tt qq kq (14) where qe is the amount of dye adsorbed (mg/g) at equi- librium, qt is the amount of dye adsorbed on adsorbent mass unit (mg/g) at time t and k1 and k2 are rate constant of the first 1min and second-order adsorption gmgmin, respectively. In order to determine the value of k2, a plot of t as function of t was done. The two types of kinetics models, pseudo-first and pseudo-second kinetic models were fitted to the experi- mentally obtained results. tq 2. Experimental 2.1. Instrumentation and Software The absorbance measurements were obtained using a double beam spectrophotometer (T90+ UV/VIS Spec- trometer—PG Instruments Ltd.), using 1 cm quartz cells. The UV-VIS spectra were recorded over the wavelength range of 300 - 650 nm and digitized values of absorbance were sampled at 5.0 nm intervals and then transferred to a computer for subsequent analysis. The data analysis was done using MathCAD 14 Pro- fessional, SPSS Statistics 17.0 and Origin 7.0. The pH measurements were made with a Multi 340i pH-meter. A thermostated shaker (Vibramax 100 Hei- dolph), with a constant speed of 300 rpm at 25˚C ± 1˚C was used for the adsorption process. 2.2. Chemicals and Solutions Chitosan with a deacetylation percentage of approxi- mately 75% - 85% (medium molecular mass) was pur- chased from Sigma Aldrich Chemie GmbH (Germany). The Ultrapure water and highly pure reagents were used for all preparations of the standard and sample solutions. Copyright © 2013 SciRes. JWARP 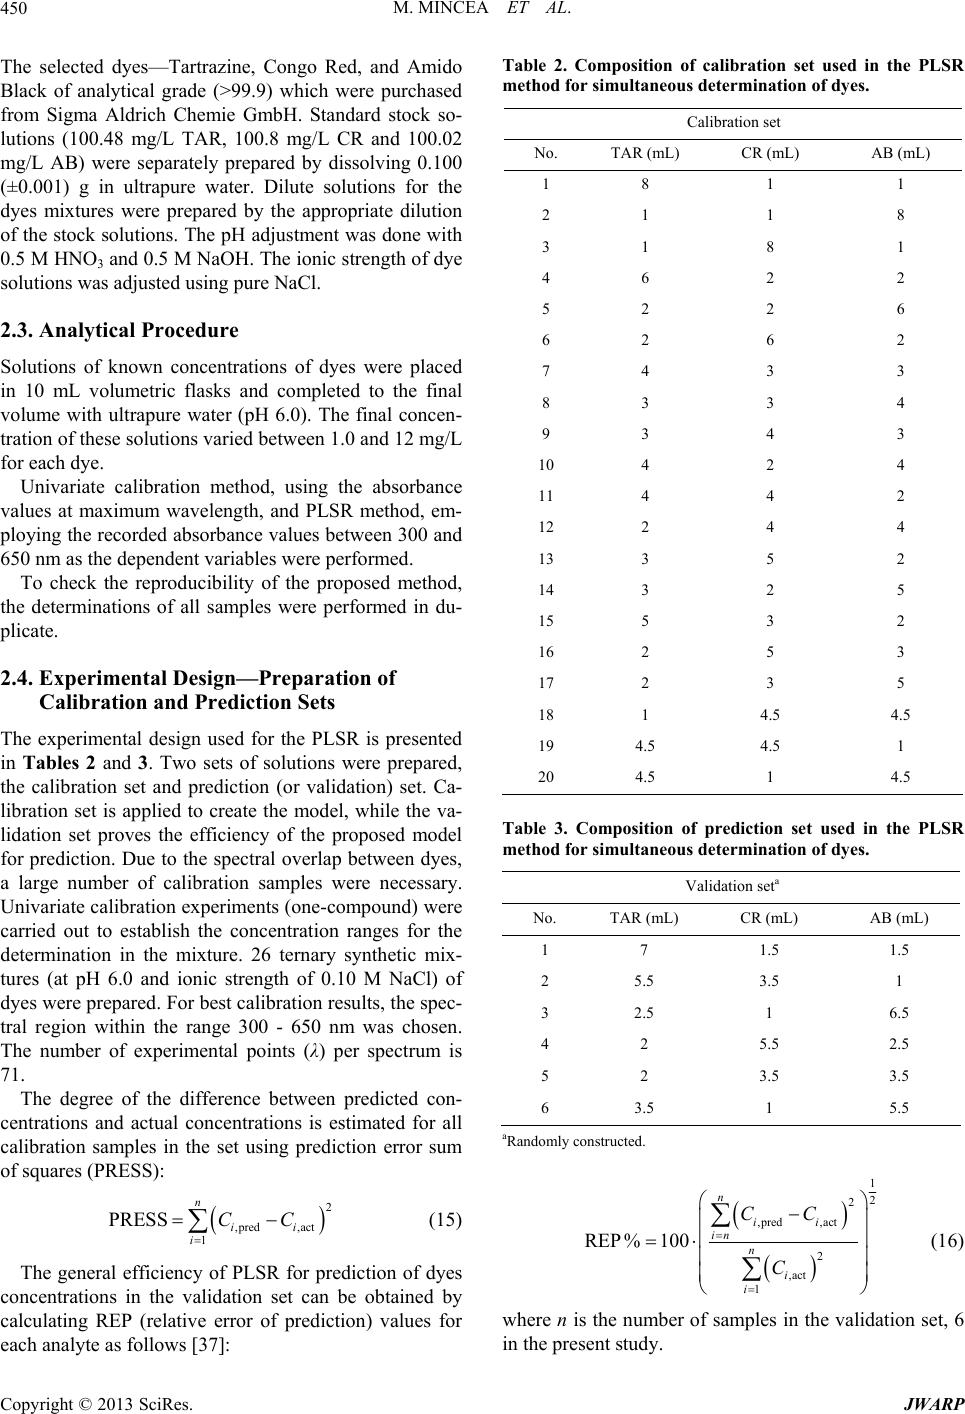 M. MINCEA ET AL. 450 The selected dyes—Tartrazine, Congo Red, and Amido Black of analytical grade (>99.9) which were purchased from Sigma Aldrich Chemie GmbH. Standard stock so- lutions (100.48 mg/L TAR, 100.8 mg/L CR and 100.02 mg/L AB) were separately prepared by dissolving 0.100 (±0.001) g in ultrapure water. Dilute solutions for the dyes mixtures were prepared by the appropriate dilution of the stock solutions. The pH adjustment was done with 0.5 M HNO3 and 0.5 M NaOH. The ionic strength of dye solutions was adjusted using pure NaCl. 2.3. Analytical Procedure Solutions of known concentrations of dyes were placed in 10 mL volumetric flasks and completed to the final volume with ultrapure water (pH 6.0). The final concen- tration of these solutions varied between 1.0 and 12 mg/L for each dye. Univariate calibration method, using the absorbance values at maximum wavelength, and PLSR method, em- ploying the recorded absorbance values between 300 and 650 nm as the dependent variables were performed. To check the reproducibility of the proposed method, the determinations of all samples were performed in du- plicate. 2.4. Experimental Design—Preparation of Calibration and Prediction Sets The experimental design used for the PLSR is presented in Tables 2 and 3. Two sets of solutions were prepared, the calibration set and prediction (or validation) set. Ca- libration set is applied to create the model, while the va- lidation set proves the efficiency of the proposed model for prediction. Due to the spectral overlap between dyes, a large number of calibration samples were necessary. Univariate calibration experiments (one-compound) were carried out to establish the concentration ranges for the determination in the mixture. 26 ternary synthetic mix- tures (at pH 6.0 and ionic strength of 0.10 M NaCl) of dyes were prepared. For best calibration results, the spec- tral region within the range 300 - 650 nm was chosen. The number of experimental points (λ) per spectrum is 71. The degree of the difference between predicted con- centrations and actual concentrations is estimated for all calibration samples in the set using prediction error sum of squares (PRESS): 2 ,pred ,actii CC 1 PRESS n i (15) The general efficiency of PLSR for prediction of dyes concentrations in the validation set can be obtained by calculating REP (relative error of prediction) values for each analyte as follows [37]: Table 2. Composition of calibration set used in the PLSR method for simultaneous determination of dyes. Calibration set No. TAR (mL) CR (mL) AB (mL) 1 8 1 1 2 1 1 8 3 1 8 1 4 6 2 2 5 2 2 6 6 2 6 2 7 4 3 3 8 3 3 4 9 3 4 3 10 4 2 4 11 4 4 2 12 2 4 4 13 3 5 2 14 3 2 5 15 5 3 2 16 2 5 3 17 2 3 5 18 1 4.5 4.5 19 4.5 4.5 1 20 4.5 1 4.5 Table 3. Composition of prediction set used in the PLSR method for simultaneous determination of dyes. Validation seta No. TAR (mL) CR (mL) AB (mL) 1 7 1.5 1.5 2 5.5 3.5 1 3 2.5 1 6.5 4 2 5.5 2.5 5 2 3.5 3.5 6 3.5 1 5.5 aRandomly constructed. 1 2 2 ,pred ,act 2 ,act 1 REP% 100 n ii in n i i CC C (16) where n is the number of samples in the validation set, 6 in the present study. Copyright © 2013 SciRes. JWARP 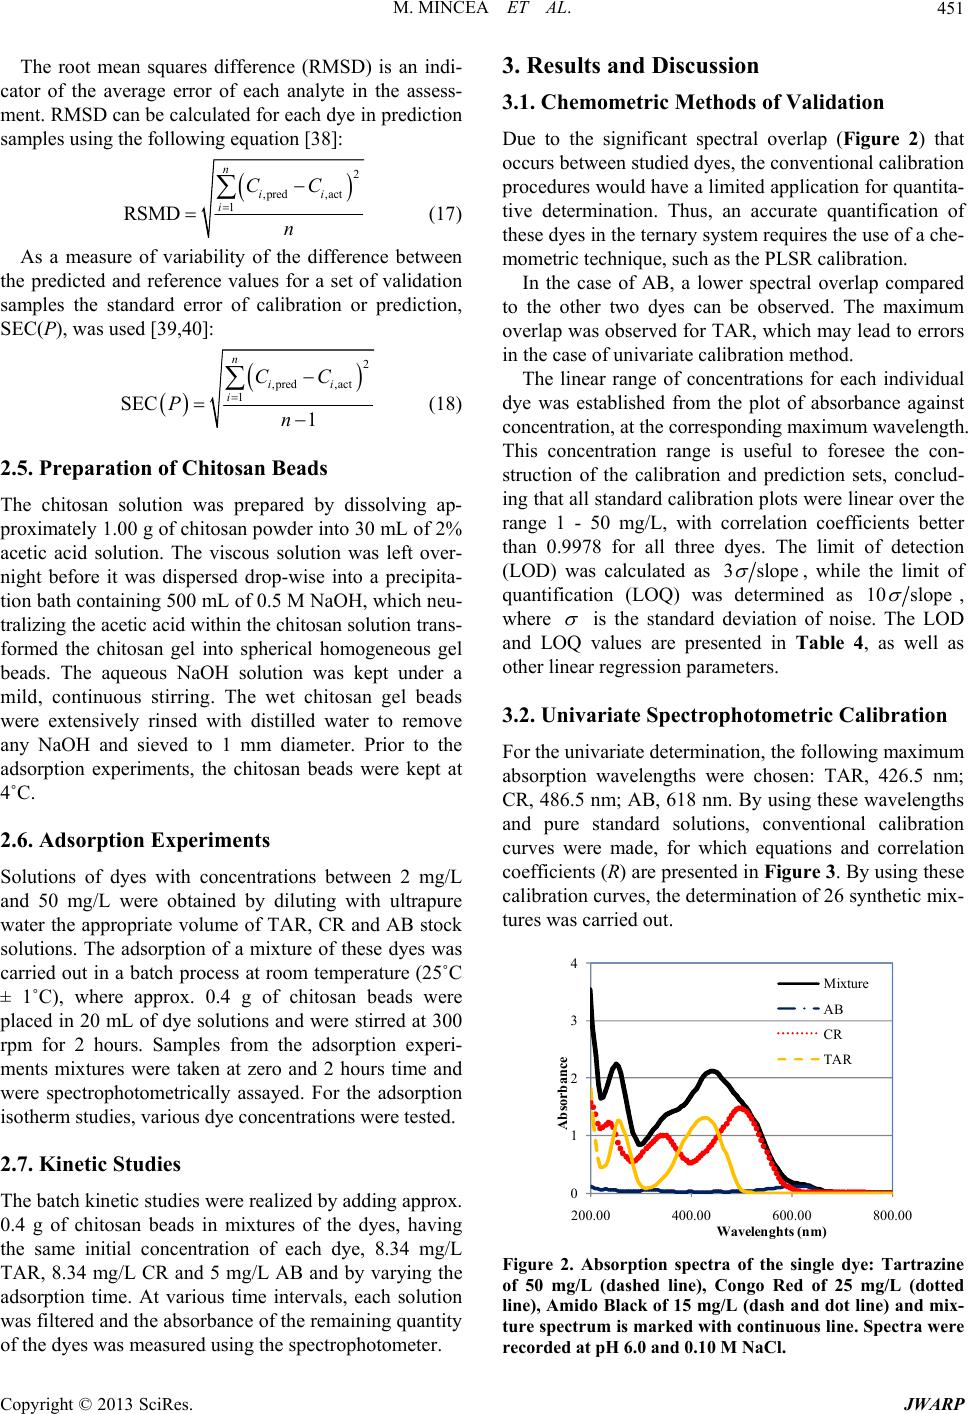 M. MINCEA ET AL. 451 The root mean squares difference (RMSD) is an indi- cator of the average error of each analyte in the assess- ment. RMSD can be calculated for each dye in prediction samples using the following equation [38]: 2 ,pred ,acti CC n 1 RSMD i n i (17) As a measure of variability of the difference between the predicted and reference values for a set of validation samples the standard error of calibration or prediction, SEC(P), was used [39,40]: 2 ,pred ,act 1 ii CC n 1 SEC i n P (18) 2.5. Preparation of Chitosan Beads The chitosan solution was prepared by dissolving ap- proximately 1.00 g of chitosan powder into 30 mL of 2% acetic acid solution. The viscous solution was left over- night before it was dispersed drop-wise into a precipita- tion bath containing 500 mL of 0.5 M NaOH, which neu- tralizing the acetic acid within the chitosan solution trans- formed the chitosan gel into spherical homogeneous gel beads. The aqueous NaOH solution was kept under a mild, continuous stirring. The wet chitosan gel beads were extensively rinsed with distilled water to remove any NaOH and sieved to 1 mm diameter. Prior to the adsorption experiments, the chitosan beads were kept at 4˚C. 2.6. Adsorption Experiments Solutions of dyes with concentrations between 2 mg/L and 50 mg/L were obtained by diluting with ultrapure water the appropriate volume of TAR, CR and AB stock solutions. The adsorption of a mixture of these dyes was carried out in a batch process at room temperature (25˚C ± 1˚C), where approx. 0.4 g of chitosan beads were placed in 20 mL of dye solutions and were stirred at 300 rpm for 2 hours. Samples from the adsorption experi- ments mixtures were taken at zero and 2 hours time and were spectrophotometrically assayed. For the adsorption isotherm studies, various dye concentrations were tested. 2.7. Kinetic Studies The batch kinetic studies were realized by adding approx. 0.4 g of chitosan beads in mixtures of the dyes, having the same initial concentration of each dye, 8.34 mg/L TAR, 8.34 mg/L CR and 5 mg/L AB and by varying the adsorption time. At various time intervals, each solution was filtered and the absorbance of the remaining quantity of the dyes was measured using the spectrophotometer. 3. Results and Discussion 3.1. Chemometric Methods of Validation Due to the significant spectral overlap (Figure 2) that occurs between studied dyes, the conventional calibration procedures would have a limited application for quantita- tive determination. Thus, an accurate quantification of these dyes in the ternary system requires the use of a che- mometric technique, such as the PLSR calibration. In the case of AB, a lower spectral overlap compared to the other two dyes can be observed. The maximum overlap was observed for TAR, which may lead to errors in the case of univariate calibration method. The linear range of concentrations for each individual dye was established from the plot of absorbance against concentration, at the corresponding maximum wavelength. This concentration range is useful to foresee the con- struction of the calibration and prediction sets, conclud- ing that all standard calibration plots were linear over the range 1 - 50 mg/L, with correlation coefficients better than 0.9978 for all three dyes. The limit of detection (LOD) was calculated as 3 slope , while the limit of quantification (LOQ) was determined as 10 slope , where is the standard deviation of noise. The LOD and LOQ values are presented in Table 4, as well as other linear regression parameters. 3.2. Univariate Spectrophotometric Calibration For the univariate determination, the following maximum absorption wavelengths were chosen: TAR, 426.5 nm; CR, 486.5 nm; AB, 618 nm. By using these wavelengths and pure standard solutions, conventional calibration curves were made, for which equations and correlation coefficients (R) are presented in Figure 3. By using these calibration curves, the determination of 26 synthetic mix- tures was carried out. 0 1 2 3 4 200.00 400.00 600.00 800.00 Absorbance Wa ve le nghts (nm ) Mixture AB CR TA Figure 2. Absorption spectra of the single dye: Tartrazine of 50 mg/L (dashed line), Congo Red of 25 mg/L (dotted line), Amido Black of 15 mg/L (dash and dot line) and mix- ture spectrum is marked with continuous line. Spectra were recorded at pH 6.0 and 0.10 M NaCl. Copyright © 2013 SciRes. JWARP 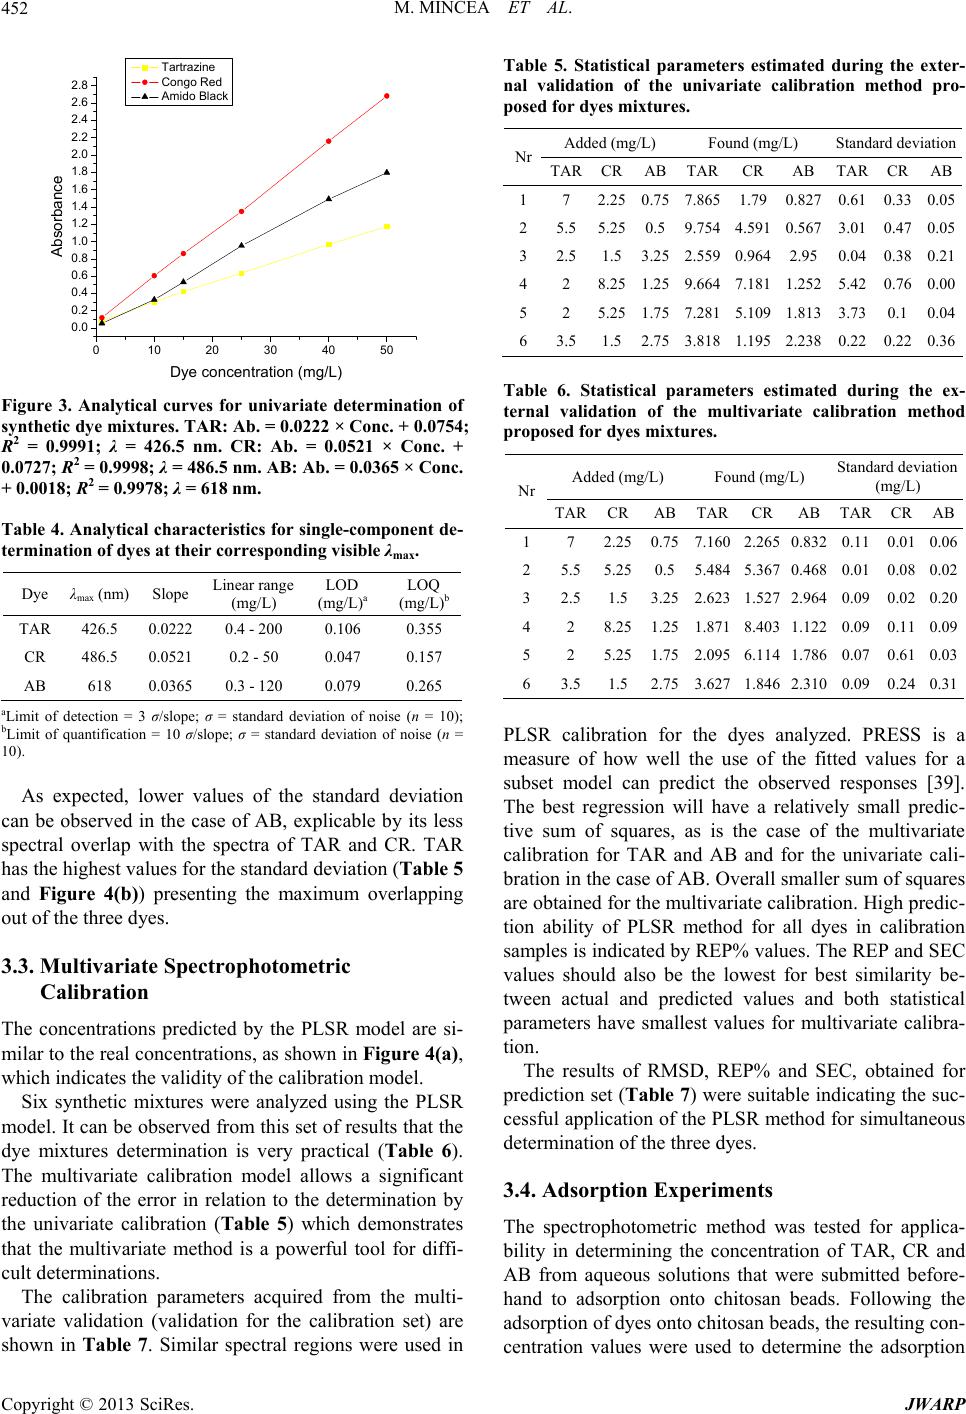 M. MINCEA ET AL. 452 0 1020304050 0.0 0.2 0.4 0.6 0.8 1.0 1.2 1.4 1.6 1.8 2.0 2.2 2.4 2.6 2.8 Absorbance Dye concentration (mg/L) Tartrazine Congo Red Amido Black Figure 3. Analytical curves for univariate determination of synthetic dye mixtures. TAR: Ab. = 0.0222 × Conc. + 0.0754; R2 = 0.9991; λ = 426.5 nm. CR: Ab. = 0.0521 × Conc. + 0.0727; R2 = 0.9998; λ = 486.5 nm. AB: Ab. = 0.0365 × Conc. + 0.0018; R2 = 0.9978; λ = 618 nm. Table 4. Analytical characteristics for single-component de- termination of dyes at their corresponding visible λmax. Dye λmax (nm) Slope Linear range (mg/L) LOD (mg/L)a LOQ (mg/L)b TAR 426.5 0.0222 0.4 - 200 0.106 0.355 CR 486.5 0.0521 0.2 - 50 0.047 0.157 AB 618 0.0365 0.3 - 120 0.079 0.265 aLimit of detection = 3 σ/slope; σ = standard deviation of noise (n = 10); bLimit of quantification = 10 σ/slope; σ = standard deviation of noise (n = 10). As expected, lower values of the standard deviation can be observed in the case of AB, explicable by its less spectral overlap with the spectra of TAR and CR. TAR has the highest values for the standard deviation (Table 5 and Figure 4(b)) presenting the maximum overlapping out of the three dyes. 3.3. Multivariate Spectrophotometric Calibration The concentrations predicted by the PLSR model are si- milar to the real concentrations, as shown in Figure 4(a), which indicates the validity of the calibration model. Six synthetic mixtures were analyzed using the PLSR model. It can be observed from this set of results that the dye mixtures determination is very practical (Table 6). The multivariate calibration model allows a significant reduction of the error in relation to the determination by the univariate calibration (Table 5) which demonstrates that the multivariate method is a powerful tool for diffi- cult determinations. The calibration parameters acquired from the multi- variate validation (validation for the calibration set) are shown in Table 7. Similar spectral regions were used in Table 5. Statistical parameters estimated during the exter- nal validation of the univariate calibration method pro- posed for dyes mixtures. Added (mg/L) Found (mg/L) Standard deviation Nr TARCRABTARCR AB TAR CRAB 17 2.250.757.8651.79 0.827 0.61 0.330.05 25.55.250.59.7544.591 0.567 3.01 0.470.05 32.51.53.252.5590.964 2.95 0.04 0.380.21 42 8.251.259.6647.181 1.252 5.42 0.760.00 52 5.251.757.2815.109 1.813 3.73 0.10.04 63.51.52.75 3.818 1.195 2.238 0.22 0.220.36 Table 6. Statistical parameters estimated during the ex- ternal validation of the multivariate calibration method proposed for dyes mixtures. Added (mg/L) Found (mg/L) Standard deviation (mg/L) Nr TARCR ABTARCR AB TARCRAB 1 7 2.250.757.160 2.265 0.832 0.11 0.010.06 2 5.55.250.55.484 5.367 0.468 0.01 0.080.02 3 2.51.53.252.623 1.527 2.964 0.09 0.020.20 4 2 8.251.251.871 8.403 1.122 0.09 0.110.09 5 2 5.251.752.095 6.114 1.786 0.07 0.610.03 6 3.51.52.753.627 1.846 2.310 0.09 0.240.31 PLSR calibration for the dyes analyzed. PRESS is a measure of how well the use of the fitted values for a subset model can predict the observed responses [39]. The best regression will have a relatively small predic- tive sum of squares, as is the case of the multivariate calibration for TAR and AB and for the univariate cali- bration in the case of AB. Overall smaller sum of squares are obtained for the multivariate calibration. High predic- tion ability of PLSR method for all dyes in calibration samples is indicated by REP% values. The REP and SEC values should also be the lowest for best similarity be- tween actual and predicted values and both statistical parameters have smallest values for multivariate calibra- tion. The results of RMSD, REP% and SEC, obtained for prediction set (Table 7) were suitable indicating the suc- cessful application of the PLSR method for simultaneous determination of the three dyes. 3.4. Adsorption Experiments The spectrophotometric method was tested for applica- bility in determining the concentration of TAR, CR and AB from aqueous solutions that were submitted before- hand to adsorption onto chitosan beads. Following the adsorption of dyes onto chitosan beads, the resulting con- centration values were used to determine the adsorption Copyright © 2013 SciRes. JWARP 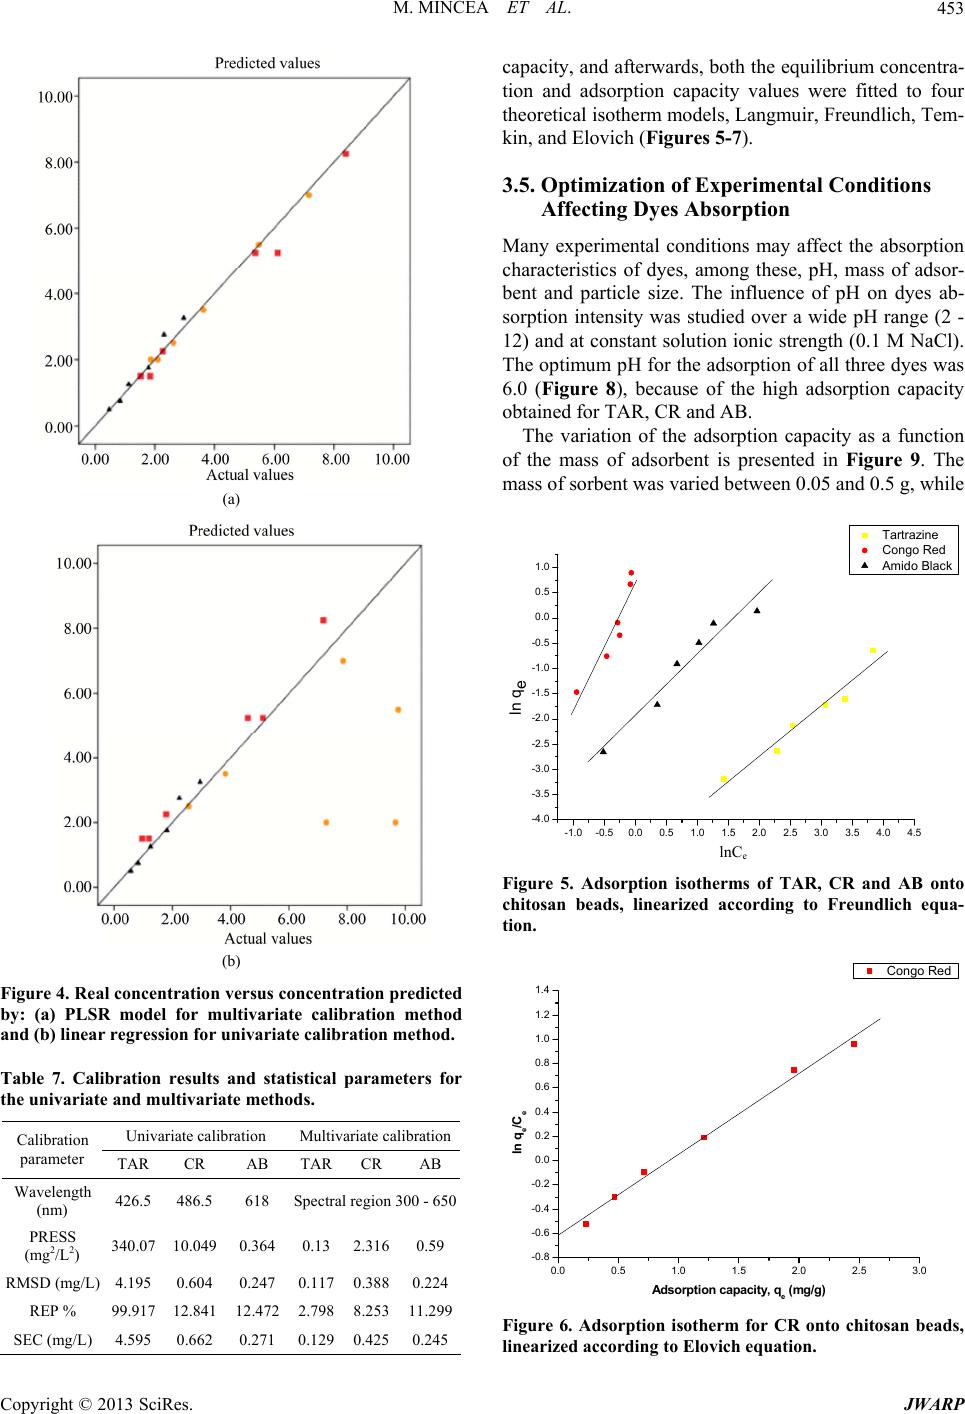 M. MINCEA ET AL. 453 (a) (b) Figure 4. Real concentration versus concentration predicted by: (a) PLSR model for multivariate calibration method and (b) linear regression for univariate calibration method. Table 7. Calibration results and statistical parameters for the univariate and multivariate methods. Univariate calibration Multivariate calibration Calibration parameter TAR CR AB TAR CRAB Wavelength (nm) 426.5 486.5 618 Spectral region 300 - 650 PRESS (mg2/L2) 340.07 10.049 0.364 0.13 2.3160.59 RMSD (mg/L) 4.195 0.604 0.247 0.117 0.3880.224 REP % 99.917 12.841 12.472 2.798 8.25311.299 SEC (mg/L) 4.595 0.662 0.271 0.129 0.4250.245 capacity, and afterwards, both the equilibrium concentra- tion and adsorption capacity values were fitted to four theoretical isotherm models, Langmuir, Freundlich, Tem- kin, and Elovich (Fi gures 5-7). 3.5. Optimization of Experimental Conditions Affecting Dyes Absorption Many experimental conditions may affect the absorption characteristics of dyes, among these, pH, mass of adsor- bent and particle size. The influence of pH on dyes ab- sorption intensity was studied over a wide pH range (2 - 12) and at constant solution ionic strength (0.1 M NaCl). The optimum pH for the adsorption of all three dyes was 6.0 (Figure 8), because of the high adsorption capacity obtained for TAR, CR and AB. The variation of the adsorption capacity as a function of the mass of adsorbent is presented in Figure 9. The mass of sorbent was varied between 0.05 and 0.5 g, while -1.0-0.50.0 0.5 1.0 1.5 2.0 2.5 3.0 3.54.0 4.5 -4.0 -3.5 -3.0 -2.5 -2.0 -1.5 -1.0 -0.5 0.0 0.5 1.0 Tartrazine Congo Red Amido Black 0.0 0.5 1.0 1.5 2.02.5 3.0 ln qe lnCe Figure 5. Adsorption isotherms of TAR, CR and AB onto chitosan beads, linearized according to Freundlich equa- tion. Congo Red -0.8 -0.6 -0.4 -0.2 0.0 0.2 0.4 0.6 0.8 1.0 1.2 1.4 ln q e /C e Adsorption capacity, q e (mg/g) Figure 6. Adsorption isotherm for CR onto chitosan beads, linearized according to Elovich equation. Copyright © 2013 SciRes. JWARP 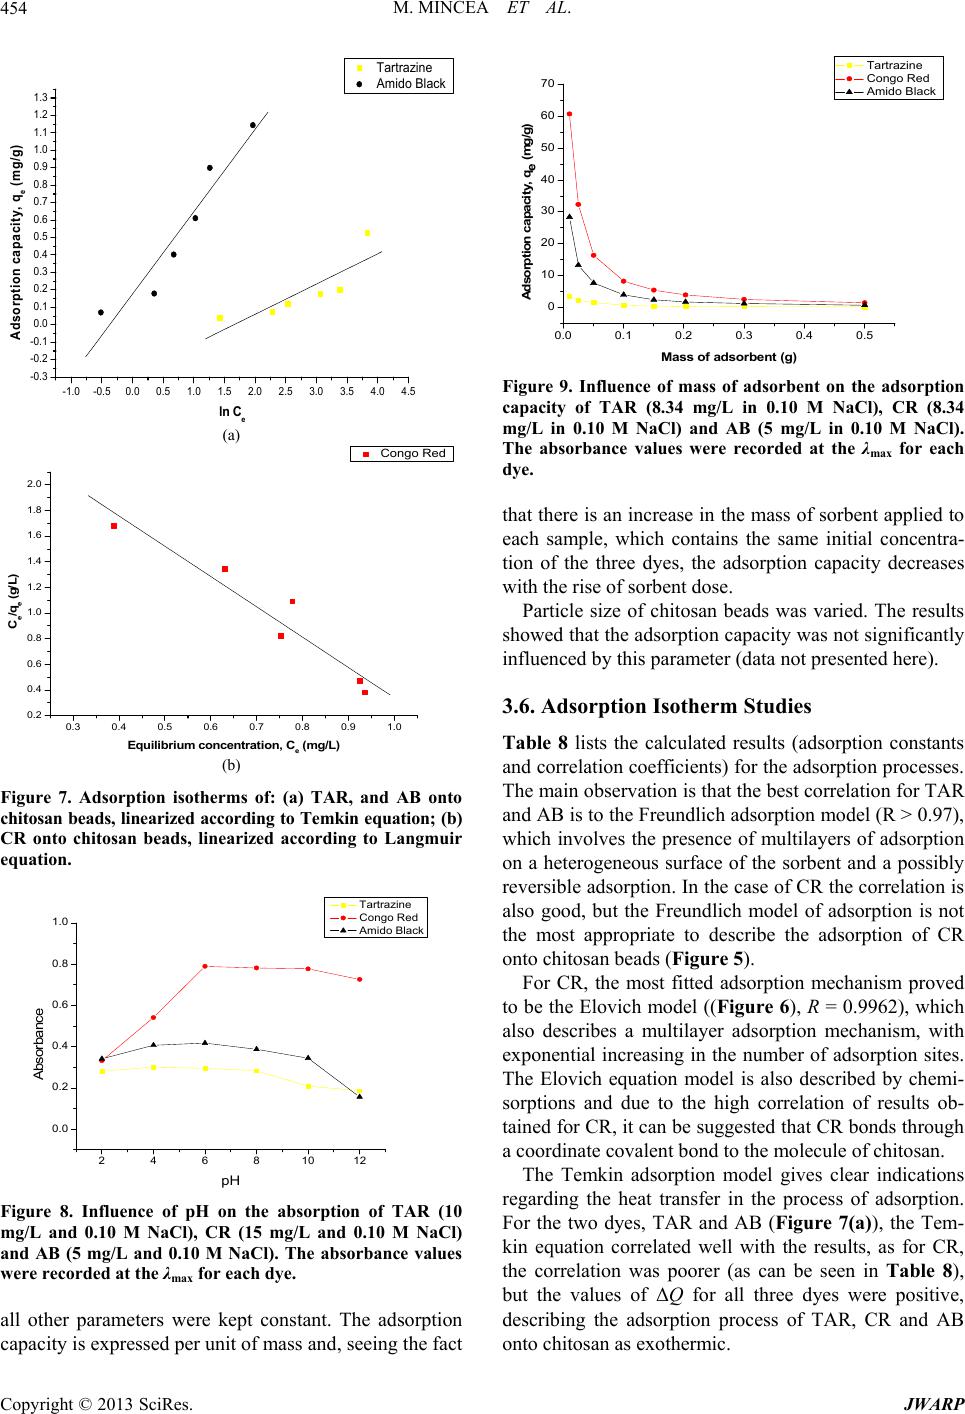 M. MINCEA ET AL. 454 -1.0-0.50.0 0.5 1.0 1.5 2.0 2.5 3.0 3.5 4.0 4.5 -0.3 -0.2 -0.1 0.0 0.1 0.2 0.3 0.4 0.5 0.6 0.7 0.8 0.9 1.0 1.1 1.2 1.3 Adsorption capacity, q e (m g /g) ln C e Tartrazine Amido Black 9 1.0 (a) 0.3 0.4 0.5 0.6 0.7 0.80. 0.2 0.4 0.6 0.8 1.0 1.2 1.4 1.6 1.8 2.0 C e /q e (g/L ) Equilib riu m c o nc e n tra tion, C e (mg/L) Congo Red 1012 (b) Figure 7. Adsorption isotherms of: (a) TAR, and AB onto chitosan beads, linearized according to Temkin equation; (b) CR onto chitosan beads, linearized according to Langmuir equation. 2468 0.0 0.2 0.4 0.6 0.8 1.0 Absorbance pH Tartrazine Congo Red Amido Black 0.0 0.1 0.2 0.3 0.4 0.5 Figure 8. Influence of pH on the absorption of TAR (10 mg/L and 0.10 M NaCl), CR (15 mg/L and 0.10 M NaCl) and AB (5 mg/L and 0.10 M NaCl). The absorbance values were record ed at the λmax for each dye. all other parameters were kept constant. The adsorption capacity is expressed per unit of mass and, seeing the fact 0 10 20 30 40 50 60 70 Tartrazine Congo Red Amido Black Adsorption capacity, qe (mg/g) Mass of adsorbent (g) Figure 9. Influence of mass of adsorbent on the adsorption capacity of TAR (8.34 mg/L in 0.10 M NaCl), CR (8.34 mg/L in 0.10 M NaCl) and AB (5 mg/L in 0.10 M NaCl). The absorbance values were recorded at the λmax for each dye. that there is an increase in the mass of sorbent applied to each sample, which contains the same initial concentra- tion of the three dyes, the adsorption capacity decreases with the rise of sorbent dose. Particle size of chitosan beads was varied. The results showed that the adsorption capacity was not significantly influenced by this parameter (data not presented here). 3.6. Adsorption Isotherm Studies Table 8 lists the calculated results (adsorption constants and correlation coefficients) for the adsorption processes. The main observation is that the best correlation for TAR and AB is to the Freundlich adsorption model (R > 0.97), which involves the presence of multilayers of adsorption on a heterogeneous surface of the sorbent and a possibly reversible adsorption. In the case of CR the correlation is also good, but the Freundlich model of adsorption is not the most appropriate to describe the adsorption of CR onto chitosan beads (Figure 5). For CR, the most fitted adsorption mechanism proved to be the Elovich model ((Figure 6), R = 0.9962), which also describes a multilayer adsorption mechanism, with exponential increasing in the number of adsorption sites. The Elovich equation model is also described by chemi- sorptions and due to the high correlation of results ob- tained for CR, it can be suggested that CR bonds through a coordinate covalent bond to the molecule of chitosan. The Temkin adsorption model gives clear indications regarding the heat transfer in the process of adsorption. For the two dyes, TAR and AB (Figure 7(a)), the Tem- kin equation correlated well with the results, as for CR, the correlation was poorer (as can be seen in Table 8), but the values of ΔQ for all three dyes were positive, describing the adsorption process of TAR, CR and AB onto chitosan as exothermic. Copyright © 2013 SciRes. JWARP 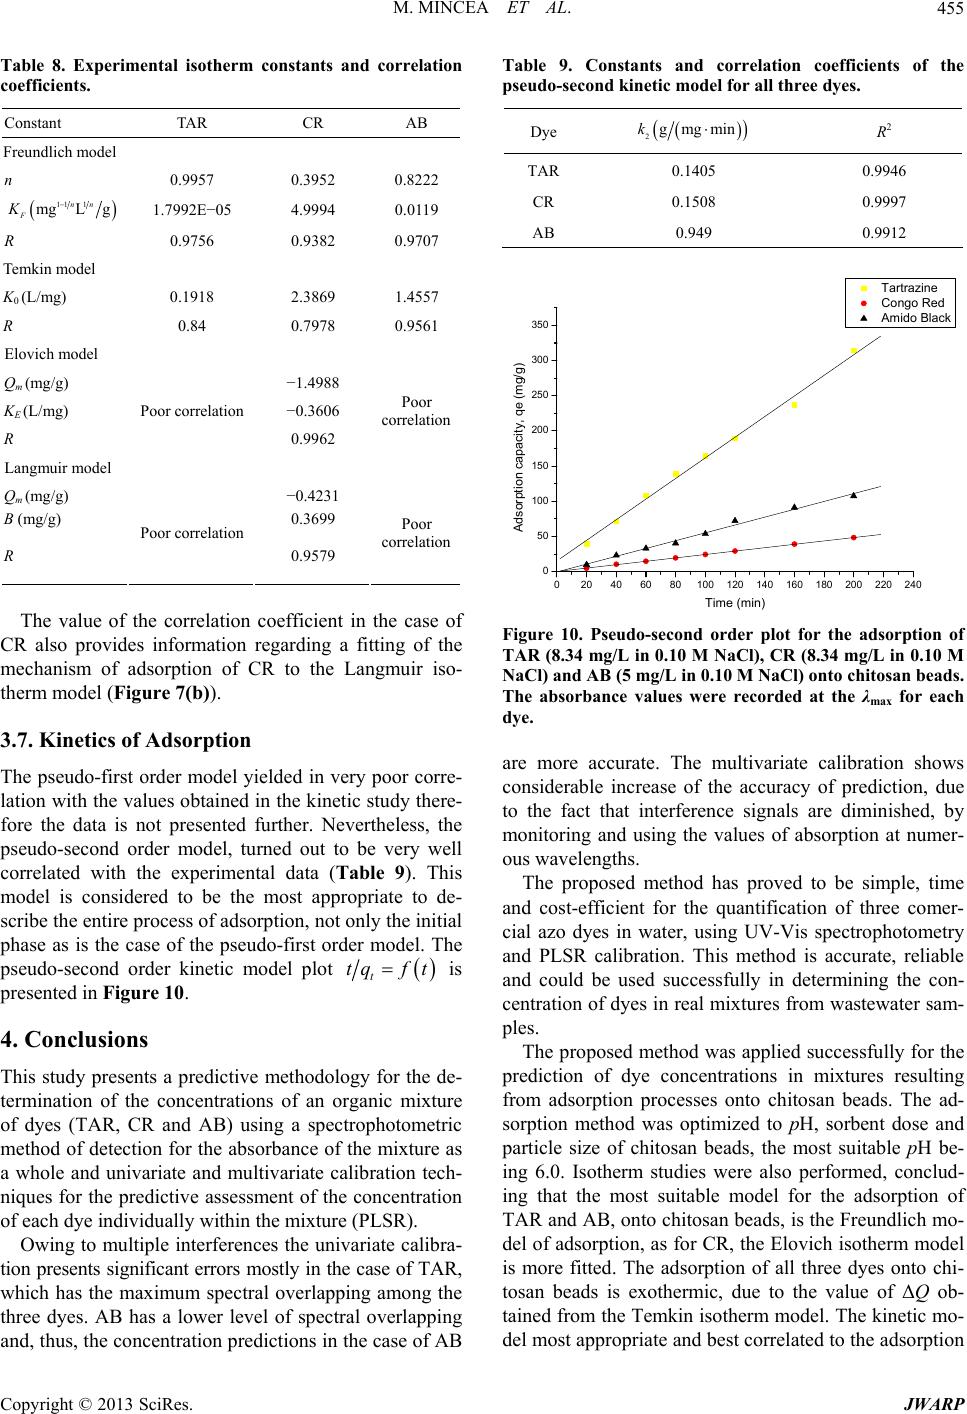 M. MINCEA ET AL. 455 Table 8. Experimental isotherm constants and correlation coefficients. Constant TAR CR AB Freundlich model n 0.9957 0.3952 0.8222 11 1 mgL g nn F K 1.7992E−05 4.9994 0.0119 R 0.9756 0.9382 0.9707 Temkin model K0 (L/mg) 0.1918 2.3869 1.4557 R 0.84 0.7978 0.9561 Elovich model Qm (mg/g) −1.4988 KE (L/mg) −0.3606 R Poor correlation 0.9962 Poor correlation Langmuir model Qm (mg/g) −0.4231 B (mg/g) 0.3699 R Poor correlation 0.9579 Poor correlation The value of the correlation coefficient in the case of CR also provides information regarding a fitting of the mechanism of adsorption of CR to the Langmuir iso- therm model (Figure 7(b) ). 3.7. Kinetics of Adsorption The pseudo-first order model yielded in very poor corre- lation with the values obtained in the kinetic study there- fore the data is not presented further. Nevertheless, the pseudo-second order model, turned out to be very well correlated with the experimental data (Table 9). This model is considered to be the most appropriate to de- scribe the entire process of adsorption, not only the initial phase as is the case of the pseudo-first order model. The pseudo-second order kinetic model plot t tqf t is presented in Figure 10. 4. Conclusions This study presents a predictive methodology for the de- termination of the concentrations of an organic mixture of dyes (TAR, CR and AB) using a spectrophotometric method of detection for the absorbance of the mixture as a whole and univariate and multivariate calibration tech- niques for the predictive assessment of the concentration of each dye individually within the mixture (PLSR). Owing to multiple interferences the univariate calibra- tion presents significant errors mostly in the case of TAR, which has the maximum spectral overlapping among the three dyes. AB has a lower level of spectral overlapping and, thus, the concentration predictions in the case of AB Table 9. Constants and correlation coefficients of the pseudo-second kinetic model for all thre e dyes. 2gmgmink Dye R2 TAR 0.1405 0.9946 CR 0.1508 0.9997 AB 0.949 0.9912 020406080100 120 140 160 180 200220 240 0 50 100 150 200 250 300 350 Tartrazine Congo Red Amido Black Adsorption capacity, qe (mg/g) Time ( m i n) Figure 10. Pseudo-second order plot for the adsorption of TAR (8.34 mg/L in 0.10 M NaCl), CR (8.34 mg/L in 0.10 M NaCl) and AB (5 mg/L in 0.10 M NaCl) onto chitosan beads. The absorbance values were recorded at the λmax for each dye. are more accurate. The multivariate calibration shows considerable increase of the accuracy of prediction, due to the fact that interference signals are diminished, by monitoring and using the values of absorption at numer- ous wavelengths. The proposed method has proved to be simple, time and cost-efficient for the quantification of three comer- cial azo dyes in water, using UV-Vis spectrophotometry and PLSR calibration. This method is accurate, reliable and could be used successfully in determining the con- centration of dyes in real mixtures from wastewater sam- ples. The proposed method was applied successfully for the prediction of dye concentrations in mixtures resulting from adsorption processes onto chitosan beads. The ad- sorption method was optimized to pH, sorbent dose and particle size of chitosan beads, the most suitable pH be- ing 6.0. Isotherm studies were also performed, conclud- ing that the most suitable model for the adsorption of TAR and AB, onto chitosan beads, is the Freundlich mo- del of adsorption, as for CR, the Elovich isotherm model is more fitted. The adsorption of all three dyes onto chi- tosan beads is exothermic, due to the value of ΔQ ob- tained from the Temkin isotherm model. The kinetic mo- del most appropriate and best correlated to the adsorption Copyright © 2013 SciRes. JWARP 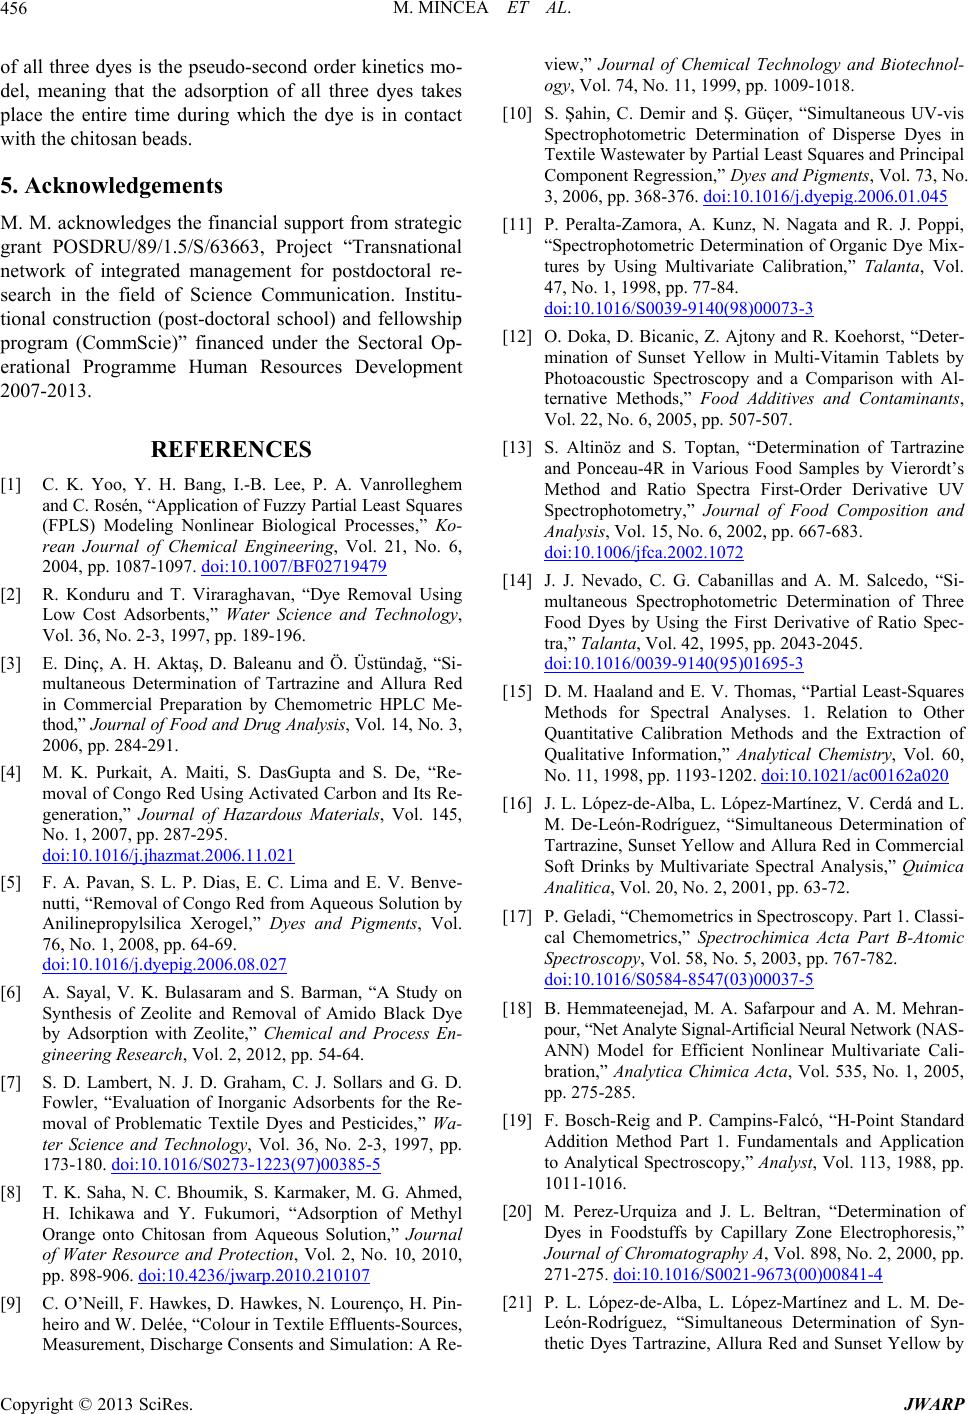 M. MINCEA ET AL. 456 of all three dyes is the pseudo-second order kinetics mo- del, meaning that the adsorption of all three dyes takes place the entire time during which the dye is in contact with the chitosan beads. 5. Acknowledgements M. M. acknowledges the financial support from strategic grant POSDRU/89/1.5/S/63663, Project “Transnational network of integrated management for postdoctoral re- search in the field of Science Communication. Institu- tional construction (post-doctoral school) and fellowship program (CommScie)” financed under the Sectoral Op- erational Programme Human Resources Development 2007-2013. REFERENCES [1] C. K. Yoo, Y. H. Bang, I.-B. Lee, P. A. Vanrolleghem and C. Rosén, “Application of Fuzzy Partial Least Squares (FPLS) Modeling Nonlinear Biological Processes,” Ko- rean Journal of Chemical Engineering, Vol. 21, No. 6, 2004, pp. 1087-1097. doi:10.1007/BF02719479 [2] R. Konduru and T. Viraraghavan, “Dye Removal Using Low Cost Adsorbents,” Water Science and Technology, Vol. 36, No. 2-3, 1997, pp. 189-196. [3] E. Dinç, A. H. Aktaş, D. Baleanu and Ö. Üstündağ, “Si- multaneous Determination of Tartrazine and Allura Red in Commercial Preparation by Chemometric HPLC Me- thod,” Journal of Food and Drug Analysis, Vol. 14, No. 3, 2006, pp. 284-291. [4] M. K. Purkait, A. Maiti, S. DasGupta and S. De, “Re- moval of Congo Red Using Activated Carbon and Its Re- generation,” Journal of Hazardous Materials, Vol. 145, No. 1, 2007, pp. 287-295. doi:10.1016/j.jhazmat.2006.11.021 [5] F. A. Pavan, S. L. P. Dias, E. C. Lima and E. V. Benve- nutti, “Removal of Congo Red from Aqueous Solution by Anilinepropylsilica Xerogel,” Dyes and Pigments, Vol. 76, No. 1, 2008, pp. 64-69. doi:10.1016/j.dyepig.2006.08.027 [6] A. Sayal, V. K. Bulasaram and S. Barman, “A Study on Synthesis of Zeolite and Removal of Amido Black Dye by Adsorption with Zeolite,” Chemical and Process En- gineering Research, Vol. 2, 2012, pp. 54-64. [7] S. D. Lambert, N. J. D. Graham, C. J. Sollars and G. D. Fowler, “Evaluation of Inorganic Adsorbents for the Re- moval of Problematic Textile Dyes and Pesticides,” Wa- ter Science and Technology, Vol. 36, No. 2-3, 1997, pp. 173-180. doi:10.1016/S0273-1223(97)00385-5 [8] T. K. Saha, N. C. Bhoumik, S. Karmaker, M. G. Ahmed, H. Ichikawa and Y. Fukumori, “Adsorption of Methyl Orange onto Chitosan from Aqueous Solution,” Journal of Water Resource and Protection, Vol. 2, No. 10, 2010, pp. 898-906. doi:10.4236/jwarp.2010.210107 [9] C. O’Neill, F. Hawkes, D. Hawkes, N. Lourenço, H. Pin- heiro and W. Delée, “Colour in Textile Effluents-Sources, Measurement, Discharge Consents and Simulation: A Re- view,” Journal of Chemical Technology and Biotechnol- ogy, Vol. 74, No. 11, 1999, pp. 1009-1018. [10] S. Şahin, C. Demir and Ş. Güçer, “Simultaneous UV-vis Spectrophotometric Determination of Disperse Dyes in Textile Wastewater by Partial Least Squares and Principal Component Regression,” Dyes and Pigments, Vol. 73, No. 3, 2006, pp. 368-376. doi:10.1016/j.dyepig.2006.01.045 [11] P. Peralta-Zamora, A. Kunz, N. Nagata and R. J. Poppi, “Spectrophotometric Determination of Organic Dye Mix- tures by Using Multivariate Calibration,” Talanta, Vol. 47, No. 1, 1998, pp. 77-84. doi:10.1016/S0039-9140(98)00073-3 [12] O. Doka, D. Bicanic, Z. Ajtony and R. Koehorst, “Deter- mination of Sunset Yellow in Multi-Vitamin Tablets by Photoacoustic Spectroscopy and a Comparison with Al- ternative Methods,” Food Additives and Contaminants, Vol. 22, No. 6, 2005, pp. 507-507. [13] S. Altinöz and S. Toptan, “Determination of Tartrazine and Ponceau-4R in Various Food Samples by Vierordt’s Method and Ratio Spectra First-Order Derivative UV Spectrophotometry,” Journal of Food Composition and Analysis, Vol. 15, No. 6, 2002, pp. 667-683. doi:10.1006/jfca.2002.1072 [14] J. J. Nevado, C. G. Cabanillas and A. M. Salcedo, “Si- multaneous Spectrophotometric Determination of Three Food Dyes by Using the First Derivative of Ratio Spec- tra,” Talanta, Vol. 42, 1995, pp. 2043-2045. doi:10.1016/0039-9140(95)01695-3 [15] D. M. Haaland and E. V. Thomas, “Partial Least-Squares Methods for Spectral Analyses. 1. Relation to Other Quantitative Calibration Methods and the Extraction of Qualitative Information,” Analytical Chemistry, Vol. 60, No. 11, 1998, pp. 1193-1202. doi:10.1021/ac00162a020 [16] J. L. López-de-Alba, L. López-Martínez, V. Cerdá and L. M. De-León-Rodríguez, “Simultaneous Determination of Tartrazine, Sunset Yellow and Allura Red in Commercial Soft Drinks by Multivariate Spectral Analysis,” Quimica Analitica, Vol. 20, No. 2, 2001, pp. 63-72. [17] P. Geladi, “Chemometrics in Spectroscopy. Part 1. Classi- cal Chemometrics,” Spectrochimica Acta Part B-Atomic Spectroscopy, Vol. 58, No. 5, 2003, pp. 767-782. doi:10.1016/S0584-8547(03)00037-5 [18] B. Hemmateenejad, M. A. Safarpour and A. M. Mehran- pour, “Net Analyte Signal-Artificial Neural Network (NAS- ANN) Model for Efficient Nonlinear Multivariate Cali- bration,” Analytica Chimica Acta, Vol. 535, No. 1, 2005, pp. 275-285. [19] F. Bosch-Reig and P. Campins-Falcó, “H-Point Standard Addition Method Part 1. Fundamentals and Application to Analytical Spectroscopy,” Analyst, Vol. 113, 1988, pp. 1011-1016. [20] M. Perez-Urquiza and J. L. Beltran, “Determination of Dyes in Foodstuffs by Capillary Zone Electrophoresis,” Journal of Chromatography A, Vol. 898, No. 2, 2000, pp. 271-275. doi:10.1016/S0021-9673(00)00841-4 [21] P. L. López-de-Alba, L. López-Martínez and L. M. De- León-Rodríguez, “Simultaneous Determination of Syn- thetic Dyes Tartrazine, Allura Red and Sunset Yellow by Copyright © 2013 SciRes. JWARP  M. MINCEA ET AL. Copyright © 2013 SciRes. JWARP 457 Differential Pulse Polarography and Partial Least Squares. A Multivariate Calibration Method,” Electroanalysis, Vol. 14, No. 3, 2002, pp. 197-205. doi:10.1002/1521-4109(200202)14:3<197::AID-ELAN19 7>3.0.CO;2-N [22] S. Y. Al-Degs, H. A. El-Sheikh, M. A. Al-Ghouti and M. S. Sunjuk, “Determination of Commercial Colorants in Different Water Bodies Using Partial Least Squares Re- gression (PLS): A Chemometric Study,” Jordan Journal of Chemistry, Vol. 3, No. 3, 2008, pp. 321-336. [23] Y. Bingchao, R. Huang and Q. Lui, “Adsorption of Amido Black 10B onto Cross-Linked Chitosan,” Research Jour- nal of Chemistry and Environment, Vol. 16, No. 3, 2012, pp. 110-115. [24] S. Chatterjee, W. M. Min and H. W. Seung, “Adsorption of Congo Red by Chitosan Hydrogel Beads Impregnated with Carbon Nanotubes,” Bioresource Technology, Vol. 101, No. 6, 2010, pp. 1800-1806. doi:10.1016/j.biortech.2009.10.051 [25] W. S. W. Ngah, F. M. A. Noorul and A. K. M. H. Megat, “Preparation, Characterization, and Environmental Appli- cation of Crosslinked Chitosan-Coated Bentonite for Tar- trazine Adsorption from Aqueous Solutions,” Water Air and Soil Pollution, Vol. 206, No. 1-4, 2010, pp. 225-236. [26] I. Langmuir, “The Constitution and Fundamental Proper- ties of Solids and Liquids,” Journal of the American Chemical Society, Vol. 38, No. 11, 1916, pp. 2221-2295. doi:10.1016/S0016-0032(17)90088-2 [27] K. Vijayaraghavan, T. V. N. Padmesh, K. Palanivelu and M. Velan, “Biosorption of Nickel (II) Ions onto Sargas- sum Wightii: Application of Two-Parameter and Three Parameter Isotherm Models,” Journal of Hazardous Ma- terials, Vol. B133, No. 1-3, 2006, pp. 304-308. [28] S. Kundu and A. K. Gupta, “Arsenic Adsorption onto Iron Oxide-Coated Cement (IOCC): Regression Analysis of Equilibrium Data with Several Isotherm Models and Their Optimization,” Chemical Engineering Journal, Vol. 122, 2006, pp. 93-106. [29] H. M. F. Freundlich, “Over the Adsorption in Solution,” Journal of Physical Chemistry A, Vol. 57, 1906, pp. 385- 471. [30] A. W. Adamson and A. P. Gast, “Physical Chemistry of Surfaces,” 6th Edition, Wiley-Interscience, New York, 1997. [31] M. I. Temkin, “Adsorption Equilibrium and the Kinetics of Processes on Nonhomogeneous Surfaces and in the In- teraction between Adsorbed Molecules,” Zhurnal Fiziche- skoi Khimii, Vol. 15, 1941, pp. 296-332. [32] S. Y. Elovich and O. G. Larinov, “Theory of Adsorption from Solutions of Non Electrolytes on Solid (I) Equation Adsorption from Solutions and the Analysis of Its Sim- plest Form, (II) Verification of the Equation of Adsorp- tion Isotherm from Solutions,” Izvestiya Akademii Nauk. SSSR, Otdelenie Khimicheskikh Nauk, Vol. 2, 1962, pp. 209-216. [33] E. Bulut, M. Ozacar and I. A. Sengil, “Adsorption of Ma- lachite Green onto Bentonite: Equilibrium and Kinetic Studies and Process Design,” Microporous Mesoporous Materials, Vol, 115, No. 3, 2008, pp. 234-246. doi:10.1016/j.micromeso.2008.01.039 [34] I. S. McLintock, “The Elovich Equation in Chemisorption Kinetics,” Nature, Vol. 216, No. 5121, 1967, pp. 1204- 1205. doi:10.1038/2161204a0 [35] Y. S. Ho and G. Mckay, “The Sorption of Lead (II) Ions on Peat,” Water Research, Vol. 33, No. 2, 1999, pp. 578- 584. doi:10.1016/S0043-1354(98)00207-3 [36] M. S. Chiou and H. Y. Li, “Adsorption Behavior of Reac- tive Dye in Aqueous Solution on Chemical Cross-Linked Chitosan Beads,” Chemosphere, Vol. 50, No. 8, 2003, pp. 1095-1105. doi:10.1016/S0045-6535(02)00636-7 [37] B. Hemmateenejad, A. Abbspour, H. Maghami, R. Miri and M. Panjehshahin, “Partial Least Squares-Based Mul- tivariate Spectral Calibration Method for Simultaneous Determination of Beta-Carboline Derivatives,” Analytica Chimica Acta, Vol. 575, No. 2, 2006, pp. 290-299. [38] A. Abbaspour and M. Najafi, “Simultaneous Determina- tion of Sb(III) and Sb(V) by Partial Least Squares Re- gression,” Talanta, Vol. 60, No. 5, 2003, pp. 1079-1084. [39] A. M. C. Davies and T. Fearn, “Back to Basics: Calibra- tion Statistics,” Spectroscopy Europe, Vol. 18, No. 2, 2006, pp. 31-32. [40] P. López-de-Alba, L. López-Martínez, V. Cerdáa and J. Amador-Hernández, “Simultaneous Determination and Classification of Riboflavin, Thiamine, Nicotinamide and Pyridoxine in Pharmaceutical Formulations, by UV-Visi- ble Spectrophotometry and Multivariate Analysis,” Jour- nal of the Brazilian Chemical Society, Vol. 17, No. 4, 2006, pp. 715-722. doi:10.1590/S0103-50532006000400012
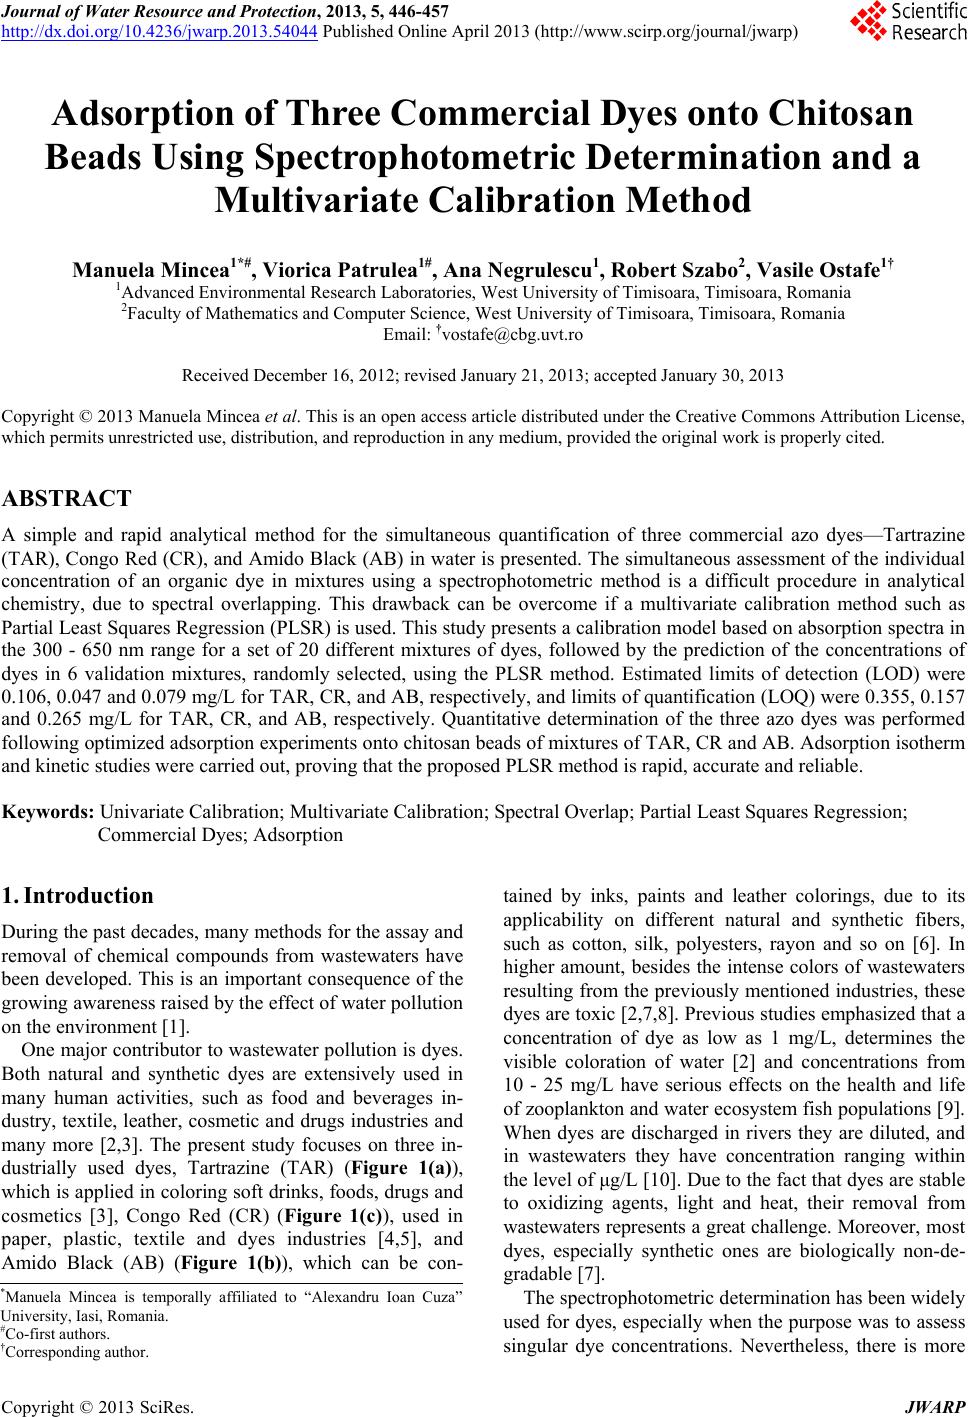
|