American Journal of Plant Sciences
Vol.5 No.15(2014), Article
ID:48271,8
pages
DOI:10.4236/ajps.2014.515262
Geostatistics as a Methodology for Studying the Spatiotemporal Dynamics of Ramularia areola in Cotton Crops
Jaqueline A. Pizzato1,2*, Dejânia V. Araújo1,2, Edinéia A. S. Galvanin3, Jair Romano Júnior1,4, Ândrea N. A. Matos1,5, Michelle Vecchi1,4, Francieli D. Zavislak1,2
1Center for Research, Studies and Agro-Environmental Development (CPEDA), Mato Grosso State University, Tangara da Serra, Brazil
2Graduate Program in Environment and Agricultural Production Systems, Mato Grosso State University, Tangara da Serra, Brazil
3Graduate Program in Environment and Agricultural Production Systems, Mato Grosso State University, Barra Bugres, Brazil
4Biological Sciences Course, Mato Grosso State University, Tangara da Serra, Brazil
5Agronomy Course, Mato Grosso State University, Tangara da Serra, Brazil
Email: *japizzato@gmail.com
Copyright © 2014 by authors and Scientific Research Publishing Inc.
This work is licensed under the Creative Commons Attribution International License (CC BY).
http://creativecommons.org/licenses/by/4.0/


Received 4 April 2014; revised 23 June 2014; accepted 25 July 2014
ABSTRACT
Geostatistics as a methodology for studying the spatiotemporal dynamics of Ramularia areola in cotton crops. Geostatistics is a tool that has been used to study plant pathology, by modeling the spatiotemporal pattern of diseases, generating hypotheses about their epidemiological aspects in order to use tactics and strategies of rational control. The objective of this study was to use geostatistics to study the spatiotemporal dynamics of Ramularia areola in cotton crops. The experiment was conducted at the experimental area of Mato Grosso State University-Tangará da Serra campus, and arranged in a 2 × 3 factorial design, with randomized blocks, with two spaicngs (0.45 and 0.90 cm) and three conditions of soil coverage (no cover, P. glaucum and C. spectabilis). Geostatistical analysis of data was performed using data from temporal and spatial progress of R. areola, obtained through assessments of the incidence and severity of the disease in plants, and spatial dependence, and analyzed using semivariogram fittings. Through the isotropic exponential semivariogram model, it was possible to check the distribution pattern and spatial dependence of Ramularia leaf spot. Spatial dependence was observed for the disease—moderate to strong for most data evaluated. The pathogen spread from the primary source of inoculum, from the center portion towards the edges, forming foci originating from a source of secondary inoculum.
Keywords:Ramularia areola, Spatial Dependence, Isotropic Exponential Semivariogram, Kriging

1. Introduction
The onset of plant diseases has become one of main challenges to the establishment of cotton crops in several regions of Brazil and worldwide [1] .
Likewise, Ramularia leaf spot (Ramularia areola G.F. Atk., [syn. = Ramularia gossypii (Speg.) Cif., Cercosporella gossypii Speg.]) has been regarded as a limiting factor for cotton crops in practically all producing regions of Brazil, particularly in the Center-West. It can lead to premature defoliation and losses of up to 30% if control measures are not taken [2] . In rainy periods, it can cause parts of branches closer to the ground to rot [3] .
This disease occurs from the start of the crop cycle, with symptoms like angular lesion between veins, initially between 1 and 3 mm, white in color, then later yellowish with powdery aspect and characterized by pathogen sporulation [4] .
Due to variation in the infectious process of R. areola, as well as the lack of more information on this topic [1] , further studies are required to provide more detailed knowledge on this disease over time and space [5] .
In that regard, geostatistics has been used to study plant pathology in order to analyze the spatial distribution of disease outbreaks, by selecting rational tactics and strategies for control, with the lowest cost-benefit ratio and environmental impact [6] [7] .
Geostatistics is regarded as a set of techniques for estimating regional and spatial values of attributes or traits over a given area [8] [9] , and is applied to model the spatiotemporal pattern and generate hypotheses on epidemiological aspects of plant diseases from the aggregate pattern of the inoculum and disease [10] .
According to Andriotti [11] , geostatistics techniques can be used to describe and model spatial models (variography), to predict values at non-sampled locations (kriging), obtaining the uncertainty associated with an estimated value at non-sampled locations (Krigagem variance), and optimizing sampling grids, in which its advantages over other conventional interpolation techniques are the study of spatial variability, smoothness, declustering, anisotropy determination, precision and uncertainty.
In studies on the spatiotemporal dynamics of diseases associated with Colletotrichum spp., transmitted by seeds, [12] were able to analyze the spatial dependence and aggregate pattern of outbreaks in function of the source of point-type inoculum, and also observe anthracnose dispersal strategies involving the formation of a secondary inoculum, with expressive severity, but distant from the primary inoculum source.
In this context, Araújo et al. [13] and Pinto et al. [14] , using methods based on quadrat maps and ordinary run analysis, respectively, to describe the dispersal pattern of fungi from seeds, observed that in these methods the distance between observations was not considered, and that observations on pathology systems were often limited, leading those authors to highlight the need to use geostatistics.
As such, the objective of this work was to use geostatistics to study the spatiotemporal dynamics of R. areola in cotton crops.
2. Materials and Methods
2.1. Procedures
The experiment was carried out at the experimental area of Mato Grosso State University-Tangará da Serra campus-Mato Grosso State, Brazil, located at 14˚38'52.19''S and 14˚38'57.80''S and 57˚25'52.38''W and 57˚25'51.85''W, at an altitude of 320 meters. It used randomized blocks in a 2 × 3 factorial design, with two spacings (0.45 m and 0.90 m) and three soil cover conditions (no cover, Penisetum glaucum L. and Crotalaria spectabilis L.) with four replications.
The soil in the experimental area was classified as a clayish dystroferric Red Latossol [15] . Fertilization was carried out in the rows (P) and in cover of (N and K), at 30 and 45 days after sowing (DAS), respectively, in function of the nutritional requirements of the crop and chemical analysis of the soil, which showed adequate nutrient levels overall (Table 1).
Plot size was 7 m × 7.20 m and the useful area under evaluation was 5.0 m long, using six and 14 useful area rows, according to their respective spacings. A border was set at 1.0 m long, with a border strip in width on each side, while the space between blocks and plots was 2.0 m and 0.50 m, respectively.
The variety chosen was FMT 701, which features a late cycle and is moderately susceptible to ramularia leaf spot [16] . R. areola was inoculated in plants within 1 m² of the center of each plot, making it a point-type inoculum source [17] , 60 days after sowing, at the start of the reproductive stage (B1) of plants. The inoculum was obtained by wetting the leaves of the cotton plant using a brush, in an Erlenmeyer flask containing distilled water. The spore suspension was adjusted to the concentration of 104 conidia mL−1 of distilled water [18] , with the aid of a Neubauer chamber.
The evaluations regarding the progress of the disease began with the first symptoms and lasted until the plants were harvested. These evaluations took place weekly in ten marked plants per plot, according to a systematic sampling [18] based on a diagram scale adapted from Aquino et al. [19] , with nine levels of severity: 1 = leaves with 0.05% of symptoms, 2 = leaves with 0.50% of symptoms, 3 = leaves with 1.0% of symptoms, 4 = leaves with 2.0% of symptoms, 5 = leaves with 4.0% of symptoms, 6 = leaves with 8.0% of symptoms, 7 = leaves with 16% of symptoms, 8 = leaves with 32% of symptoms, 9 = leaves with 67.20% of symptoms.
2.2. Geostatistic Analysis
Geostatistics was used to study the spatial variability of R. areola and to define the semivariogram model to be used and the fitting method that best described the variability in the data. The spatial dependence of the transmissibility of ramularia leaf on plants was analyzed by fitting semivariograms, while the geostatistic analysis of the data was carried out from the values of the severity scores obtained at the different evaluation periods [7] .
The exponential isotropic semivariogram theoretical model used herein was defined by Diggle & Ribeiro Junior [20] :

in which: h is the distance and a is the range.
The fit of the models was chosen given the parameters of the semivariograms, the coefficients of determination (R²), the sum of squares of the residue and self-validation (Jack-knife) [12] . The parameters of the semivariograms were represented by the nugget effect (C0), baseline (C0 + C) and Range (a). Surfer 10 software was used to generate the semivariograms, carry out kriging interpolation in 2 × 2 blocks with 16 neighbors, and to obtain two-dimension maps [21] .
To analyze the degree of spatial dependence (DSD) of the transmissibility of ramularia leaf, 

Table 1. Interpretation of the chemical analysis of macroand micro-nutrients of experimental area soil, a dystroferric Red Latossol.
was used, considering values up to 25% as strong, 25% to 75% as moderate, and weak above 75% [22] . In order to use the kriging technique and obtain satisfactory accuracy and precision, there must be a spatial dependence defined by the semivariogram [23] .
3. Results and Discussion
The development of the disease was also monitored through baseline (C0 + C) and range (a) values, according to evaluation period, indicating growing disease severity and higher number of sick plants starting from the primary inoculum source, according to the spatial progress of the disease in the field.
The variographic models made it possible to observe spatial dependence and the dispersal pattern of R. areola leaf spot, of which the exponential isotropic semivariogram model best fit the development of the disease at all evaluation periods (Table 2).
The values for range, which represented the distance threshold in which there is still spatial dependence between samples, showed variations between the evaluation periods, reaching levels between 0.10 m and 7.65 m in T1, 0.10 m and 0.56 m in T2, 0.01 m and 39.96 in T3, 0.88 m and 92.00 m in T4, 0.10 m and 22.80 m in T5, and 0.01 m and 0.69 m in T6; in treatments T3, T4 and T5, range values were higher than the size of the study area.
Analyzing the values of range, Biffi & Rafaeli Neto [24] observed in studies on the spatial behavior of agronomic variables of apples that range values were greater than 500 m and 300 m for fruit weight per plant (FWP) and number of fruits per plant (NF), respectively—numbers were higher than the study area. This indicated greater spatial continuity among these variables, according to the authors. Noetzold [25] also found range values that were larger than the size of the plots, using the maximum likelihood method (ML).
It was observed that treatment T3 showed the range with increasing values (ranging from 0.001 m and 39.96 m), as a function of the increase in inoculum, confirming the aggressiveness of the pathogen and indicating the radius of the reach of spatial dependence in the transmissibility of R. areola to other plants.
The R² values found in this work stood below 27%, and were therefore considered low (Table 2). A similar result was observed in the work by Dinardo-Miranda et al. [26] , who evaluated the spatial distribution of Mahanarva fimbriolata (Stâl., 1854) in sugar cane, on a field under mechanized harvest of raw cane, finding that R² values was below 40%.
Although the R² values had been considered low, they were validated through the Jack-knife test, which confirmed the consistency of the estimated parameters with the model chosen.
The relationship between nugget effect (C0) and baseline (C0 + C) showed that the strength of the degree of spatial dependence of the disease ranged between moderate (45.8%) and strong (50%), as per Cambardella et al. [22] , throughout all four evaluation periods, with a report of weak spatial dependence of the disease in only one treatment (T4), which for its part showed the highest value for nugget effect (6.06) and range (92.00 m) of the experiment.
These results could be compared with Alves et al. [12] studies on bean anthracnose (Colletotrichum lindemuthianum) (SACC. & MAGN.) and grey mildew (Colletotrichum gossypii South var. cephalosporioides A. S. Costa), which found spatial dependence of both diseases, whose range and baseline values corresponded to the progress of the disease on the field as a function of the evaluation periods. They also observed a degree of dependence similar to that found in this study, ranging from moderate to strong in the behavior of grey mildew.
According to Valeriano & Santos [27] , data featuring a high nugget effect (in relation to the baseline obtained) indicated low spatial dependence and required greater care for their specialization and subsequent mapping.
Spatial dependence was also observed by Alves et al. [7] , working with coffee berry borer (Hypothenemus hampei, Ferrari 1867) (Coleoptera scolytidae) and brown eyespot (Cercospora caffeicola). In that study, the best fitting model was the isotropic spherical semivariogram, explained by the high R² values obtained.
The spatial variability of the disease was analyzed though Kriging maps in all four evaluation periods, at 72, 82, 104 and 111 days after sowing (DAS), and was first detected at 72 DAS.
Overall, occurrence of the disease started from a point-type primary inoculum, and starting at 82 DAS a secondary inoculum of the disease began to form, as a result of the pathogen being disseminated to the other plants (Figure 1 and Figure 2).
These results can be explained by the characterization of ramularia leaf spot as a polycyclic disease, featuring several cycles of pathogen infection, in which plants infected at the start of the cycle serve as sources of the pathogen inoculum for later infections during the same crop cycle of the host [28] .
Table 2. Coefficients and parameters of the exponential isotropic semivariogram related to ramularia leaf severity of cotton crop in different evaluation times.
*R2: coefficient of determination. *DSD: degree of spatial dependence.
Moreover, it is necessary to evidence characteristics regarding the sporulation pattern of pathogens that occur in warm climates (tropical and subtropical climates), considering that they show a daily spore production curve with several peaks of maximum sporulation, distributed throughout the infective period, thus guaranteeing the dispersal of the disease [29] .
Later, at 104 DAS, greater spatial variability of the disease was seen towards the edges of the plot and further from the point-type inoculum source, causing the false impression that there had been a marked reduction in the
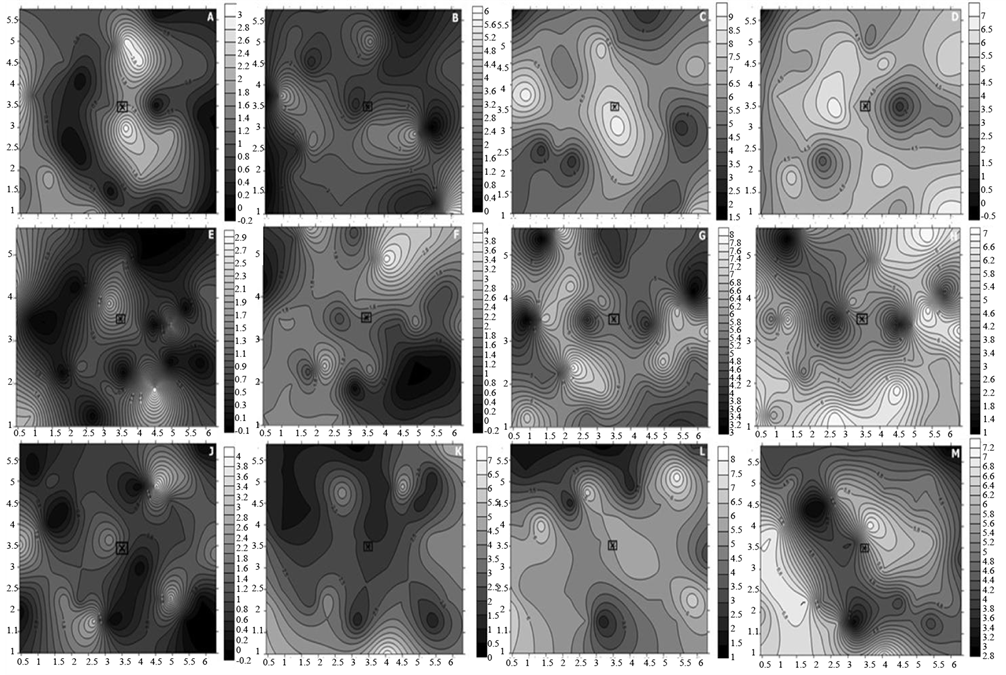
Figure 1. Kriging maps of the severity of ramularia leaf spot of cotton plants, at 72, 84, 104 and 111 DAS, under three cover and spacing situations: a) no cover 0.45 m (72 DAS); b) no cover 0.45 m (82 DAS); c) no cover 0.45 m (104 DAS); d) no cover 0.45 m (111 DAS); e) P. glaucum 0.45 m (72 DAS); f) P. glaucum 0.45 m (82 DAS); g) P. glaucum 0.45 m (104 DAS); h) P. glaucum 0.45m (111 DAS); j) C. spectabillis 0.45 m (72 DAS); k) C. spectabillis 0.45 m (82 DAS); l) C. spectabillis 0.45 m (104 DAS); m) C. spectabillis 0.45 m (111 DAS).
disease at the central portion of the plot. However, that situation could be justified given the leaf loss that occurred in the bottom of the plant. Defoliation is one of the main damages caused by ramularia leaf spot, particularly in microclimatic conditions ideal to disease infection, especially in the lower third of plants, caused by the closing of the canopy and by favorable moisture and temperature conditions [1] [2] [19] .
For the last evaluation period (111 DAS), the different foci of the diseases ended up merging given the intense severity of the disease, progressing towards the entire plot. The fact that the disease “returned” to the center of the plots was due to improved moisture and temperature conditions within the plots compared to their edges, following the closing of plant canopies—a factor that led to a microclimate favorable to the progress of the disease [3] .
Analyzing the maps more specifically with regard to the different treatments, it was possible to observe visual differences in the behavior of the disease in the plots according to evaluation periods. Relevance in these observations was seen in T1 (no cover, 0.45) when compared to the other treatments, with a possible “reduction” in the disease from the first to last evaluation period, especially when the same cover condition was observed; however, no “reduction” of the disease was seen in the plots over time with regard to the 0.90 m spacing in T4.
So, these observations can be justified as a result of the defoliation that initially occurred in the lower third of the plants, as a consequence of the marked severity of the disease, considering the moisture accumulated in the lower part of the plant canopy, and due to dense cropping (0.45 m) that caused earlier shading in the crop [3] .
Nevertheless, when observing the overall behavior of the disease, spatial dependence was found between the sampled plants, indicating the range of pathogen transmissibility, starting from the source of the primary inoculum of the disease, at the center of the plots, towards the edges, coalescing throughout the plot.
Figure 2. Kriging maps of the severity of ramularia leaf spot of cotton plants, at 72, 84, 104 and 111 DAS, under three cover and spacing situations: n) no cover 0.90 m (72 DAS); o) no cover 0.90m (82 DAS); p) no cover 0.90 m (104 DAS); q) no cover 0.90 m (111 DAS); r) P. glaucum 0.90 m (72 DAS); s) P. glaucum 0.90 m (82 DAS); t) P. glaucum 0.90 m (104 DAS); u) P. glaucum 0.90 m (111 DAS); y) C. spectabillis 0.90 m (72 DAS); w) C. spectabillis 0.90 m (82 DAS); x) C. spectabillis 0.90 m (104 DAS); z) C. spectabillis 0.90 m (111 DAS).
In this work, although R² values detected stood below 27%, “Jack-kinfe” test however, validated the parameters estimated using exponential isotropic model.
References
- Curvêlo, C.R.S., Rodrigues, F.A., Berger, P.G. and Rezende, D.C. (2010) Microscopia eletrônica de varredura do processo infeccioso de Ramularia areola em folhas de algodoeiro. Tropical Plant Pathology, 35, 108-113. http://www.scielo.br/pdf/tpp/v35n2/v35n2a06.pdf
- Suassuna, N.D. and Coutinho, W.M. (2007) Manejo das principais doenças do algodoeiro no Cerrado brasileiro. In: Freire, E.C., Ed., Algodão no Cerrado do Brasil, Brasília DF, 479-521.
- PAIVA, F.A. (2001) Doenças. In: Algodão, E., Ed., Algodão: Tecnologia de produção. Embrapa Agropecuária do Oeste, Dourados MS, 245-266.
- Cassetari Neto, D. and Machado, A. Q. (2000) Diagnose e controle de doenças do algodão. Cuiabá: UFMT/FAMEV, 55 p.
- Bergamin Filho. A., Hau, B., et al (2004) Análise especial de epidemias. In: Vale, F.X.R., Jesus Jr., W.C. et al., Eds., Epidemiologia aplicada ao manejo de doenças de plantas, Perffil, Belo Horizonte MG, 193-240.
- Nelson, M.R., Orum, T.V., Jaime-Garcia, R. and Nadeen, A. (1999) Applications of Geographic Information Systems and Geostatistics in Plant Disease Epidemiology and Management. Plant Disease, 83, 308-319. http://dx.doi.org/10.1094/PDIS.1999.83.4.308
- Alves, M., Pozza, E.A., Silva, F.M., Moraes, J.C., Oliveira, M.S., Souza, Z.M. and Figueiredo, C.A.P. (2005) Análise geoestatística da variabilidade espacial da broca-do-café (Hypothenemus hampei) (Coleoptera: Scolytidae) e da cercosporiose (Cercospora coffeicola Berk e Cke.) do cafeeiro (Coffea arabica L.). V Congresso Brasileiro de Agroinformática, SBI-AGRO Londrina, 28 a 30 de setembro de 2005, 8. http://www.sbiagro.org.br/pdf/v_congresso/Trabalho12.pdf
- Journel, A.G. and Huijbregts, C.J. (1991) Mining Geostatistics. 1st Editon, Academic, London.
- Isaaks, E.H. and Srivastava, R.M. (1989) Applied Geostatistics, 1st Editon, Oxford University Press, New York.
- Jaime-Garcia, R. and Cotty, P. J. (2003) Aflatoxin Contamination of Commercial Cottonseed in South Texas. Phytopathology, 93, 1190-1200. http://dx.doi.org/10.1094/PHYTO.2003.93.9.1190
- Andriotti, J.L.S. (2003) Fundamentos de Estatística e Geoestatística. Editora Unisinos, São Leopoldo.
- Alves, M.C., Pozza, E.A., Machado, J.C., Araújo, D.V., Talamini, V. and Oliveira, M.S. (2006) Geoestatística como metodologia para estudar a dinamica espaço-temporal de doenças associadas a Colletotrichum spp. transmitidos por sementes. Fitopatologia Brasileira, 31, 557-563. http://dx.doi.org/10.1590/S0100-41582006000600004
- Araújo, D.V., Pozza, E.A., Machado, J.C., Zambenedetti, E.B., Celano, F.A.O., Carvalho, E.M. and Camargos, V.N. (2005) Influência da temperatura e do tempo de inoculação das sementes de algodão na transmissibilidade de Colletotrichul gossypii var. cephalosporioides. Fitopatologia Brasileira, 31, 035-040. http://www.scielo.br/pdf/fb/v31n1/a06v31n1.pdf
- Pinto, A.C.S., Pozza, E.A., Talamini, V., Machado, J.C., Sales, N.L.P., Garcia Júnior, D. and Santos, D.M. (2001) Análise do padrão espacial e do gradiente da Antracnose do feijoeiro em duas épocas de cultivo. Summa Phytopathologica, 27, 392-398. http://www.scielo.br/pdf/fb/v31n6/a04v31n6.pdf
- Embrapa (2006) Sistema Brasileiro de Classificação de Solos. 2nd Edition, Centro Nacional de Pesquisa de Solos, Rio de Janeiro.
- Fundação MT http://www.fundacaomt.com.br/algodao/?cult=fmt701
- Campbell, C.L. and Madden, L.V. (1990) Introduction to Plant Disease Epidemiology. Journal Wiley Sons, New York.
- Rocha Jr., O.M. (2007) Padrão espacial e tamanho da amostra para avaliação da severidade da Sigatoka-amarela da bananeira. MSc. Tese, Universidade Federal Rural de Pernambuco, Recife. http://www.pgfitopat.ufrpe.br/teses/ms115.pdf
- Aquino, L.A., Berger, P.G., Rodrigues, F.A., Zambolim, L., Ogoshi, F., Miranda, L.M. and Lélis, M.M. (2008) Controle alternativo da mancha de ramulária do algodoeiro. Summa Phytopathologica, 34, 131-136. http://dx.doi.org/10.1590/S0100-54052008000200004
- Diggle, P.J. and Ribeiro Jr., P.J. (2007) Model based geostatistics. Springer, Londres.
- Golden Software Inc. (1999) Surfer for Windows. Surfer 7.0. Contouring and 3D Surface Mapping for Scientist’s Engineers. User’s guide. Golden Software, Golden, CO., New York, 619 p.
- Cambardella, C.A., Moorman, T.B., Novak, J.M., Parkin, T.B., Karlen, D.R., Turco, R.F. and Conopka, A.E. (1994) Field-Scale Variability of Soil Properties in Central Iowa Soils. Soil Science Society of America Journal, 58, 150-151. http://dx.doi.org/10.2136/sssaj1994.03615995005800050033x
- Salviano, A.A.C. (1996) Variabilidade de atributos de solo e de Crotalaria juncea em solo degradado do município de Piracicaba-SP. Drs. Tese, Escola Superior de Agricultura “Luiz de Queiroz”, Universidade de São Paulo. Piracicaba.
- Biffi, L.J. and Neto, S.L.R. (2008) Comportamento espacial de variáveis agronômica da maça ‘Fuji’ durante dois anos de avaliação no planalto serrano de Santa Catarina. Revista Brasileira de Fruticultura, 30, 975-980.http://dx.doi.org/10.1590/S0100-29452008000400023
- Noetzold, R. (2011) Avaliação de metodologias de análise estatística e geoestatística para estudar o progresso espacial de Colletotrichum truncatum em sementes de soja. MSc. Tese, Faculdade de Agronomia e Medicina Veterinária da Universidade Federal de Mato Grosso, Cuiabá. http://www.scielo.br/scielo.php?pid=S0100-54052014000100002&script=sci_arttext&tlng=pt
- Dinardo-Miranda, L.L., Vasconcelos, A.C.M., Vieira, S.R., Fracasso, J.V. and Grego, C.R. (2007) Uso da geoestatística na avaliação da distribuição espacial de Mahanarva fimbriolata em cana-de-açúcar. Bragantia, 66, 449-455. http://dx.doi.org/10.1590/S0006-87052007000300011
- Valeriano, M.M. and Santos, A.O. (2002) Mapping of Plant Soil Data with High Random Variability. Acta Scientiarum, 24, 221-228.
- Filho, A.B. (2011) Curvas de progresso da doença. In: Amorin, L., Rezende, J.A.M. and Filho, A.B., Eds., Manual de Fitopatologia, Agronômica Ceres, Piracicaba, 647-666.
- Amorim, L. and Pascholati, S.F. (2011) Ciclo de relações patógeno-hospedeiro. In: Amorin, L., Rezende, J.A.M. and Filho, A.B., Eds., Manual de Fitopatologia, Agronômica Ceres, Piracicaba, 59-100.
NOTES

*Corresponding author.