Advances in Microbiology
Vol. 2 No. 4 (2012) , Article ID: 26237 , 6 pages DOI:10.4236/aim.2012.24081
Semi-Automated Method for Multi-Tasking Measurement of Microbial Growth, Capsule, and Biofilm Formation
Department of Microbiology and Immunology, Midwestern University, Downers Grove, USA
Email: *BPlotk@Midwestern.edu
Received October 4, 2012; revised November 3, 2012; accepted November 10, 2012
Keywords: Biofilm; Staphylococcus aureus; Escherichia coli; Quorum-Signaling Compounds; Menaquinone; Insulin; Growth
ABSTRACT
The majority of bacterial infections involve the formation of biofilms. Biofilm formation is nutrient and growth dependent. Determination of the effects of nutrients on exopolysaccharide production and bacterial growth is labor and time intensive. We tested whether the Bioscreen C (Growth Curves, Inc.) would have utility as a high-throughput tool in the measurement of fundamental phenotype expression, as it relates to growth conditions. Within 48 - 72 hr, reproduceble, statistically significant data on the affects of growth conditions on generation time, capsule production and biofilm formation (maximally for 25 different conditions per 24 hr run cycle; n = 4) were obtained. Although all S. aureus strains produced similar amounts of capsule, sarA– and agr– strains grew significantly slower than parent strain (1.6 fold slower) and produced significantly (p < 0.05) less biofilm (~2 fold). E. coli growth rate, biofilm and capsule production in simulated nephropathic urine medium was similar for urine with insulin (20 µU). Addition of insulin to urine medium with proline increased generation time, capsule and biofilm production. Findings from this study show that the Bioscreen C is a rapid, reproducible, and easily manipulated system to concurrently measure bacterial growth, biofilm formation, and capsule production. In addition, there is the potential for further applications of this system by expanding the types of detector dyes used.
1. Introduction
The formation of biofilms is a major virulence phenotype which is associated with over half of all bacterial infections. Biofilms function to protect bacterial communities from environmental factors, e.g. serum proteases, antibodies and antibiotics, and help to anchor these communities to substrates ranging from industrial plastics and tubing to mucosal surfaces [1-3]. Polysaccharide capsule participates in both the protective and anchoring functions essential for biofilm stability. Biofilm formation and stability is dependent on the environment. Promotion, or inhibition, of biofilm formation occurs in response to available nutrients including pathway metabolites and quorum-signaling compounds. Bacterial growth conditions can affect the levels of biofilm formed. A flaw that can arise when interpreting the data is the assumption that the rate and maximum level of growth achieved is congruent for all growth conditions tested. Unfortunately, such bias can only be eliminated experimentally. To be able to compare biofilm formation in response to various growth conditions all measurements should be performed on cells grown under identical conditions which can be difficult and labor intensive to achieve. The focus of this study is to determine if a high-throughput semi-automated system for measuring growth kinetics (Bioscreen C) could be multi-purposed to accommodate measurement of biofilm formation and capsule production. This was tested by measurement of growth kinetics followed by assessment of biofilm and capsule formation in the same honeycomb microtiter plate wells. Initial measurements were done using a gram positive organism, Staphylococcus aureus. We then examined how alteration in growth affected biofilm and capsule formation in a model for E. coli colonization in response to the interkingdom quorum signal, insulin [4,5].
2. Materials and Methods
2.1. Chemicals and Reagents
Menaquinone (K2; stored at –20˚C; Sigma-Aldrich) was dissolved in dimethyl sulfoxide (DMSO) then diluted in media for use. Humulin-R (Lily) was used for all insulin assays [5].
2.2. Bacteria and Medium
Escherichia coli ATCC 25922 and Staphylococcus aureus (Table 1) were used. For testing, S. aureus, strains were grown in Mueller-Hinton broth (MH) and Yeast Nitrogen Base with 1% peptone (YNBP); E. coli was grown in YNBP and artificial urine (AU; g/L: CaCl2, 0.65 g; MgCl2, 0.65 g; NaCl, 4.6 g; Na2SO4, 2.3 g; Na3 C3H5O(CO2)3, 0.65 g; Na2C2O4, 0.02 g; KH2PO4, 2.8 g; KCl, 1.6 g; NH4Cl, 2.0 g; urea, 12.0 g; creatinine, 1.1 g; tryptic soy broth 3.0 g; NaSO4, 2.3 g) [6]. The amino acids tested for their effect on E. coli growth, biofilm and capsule formation are listed in Table 2.
2.3. Growth, Biofilm and Capsule Studies
Overnight cultures of E. coli and S. aureus were inoculated into homologous media (2 × 10⁴ CFU/mL final concentration). Various concentrations of menaquinone or insulin were added to the bacterial suspensions (S. aureus and E. coli, respectively) prior to incubation (24 or 48 hrs; 37˚C, continuous shaking). Generation times were calculated per formula (Bioscreen C). For E. coli, controls consisted of organisms grown in medium alone; S. aureus controls were organisms grown in medium with the highest concentration of DMSO used (1% v/v DMSO in MH). Experiments were performed in quadruplicate or octuplicate and repeated once. Biofilm and capsule determinations were done post-growth by staining washed (3×, PBS, pH 7.0) then dried honeycomb plates with crystal violet (biofilm; Abs595 nm) or Alcian blue (capsule; 1% w/v DDI), respectively [10]. For menaquinone, parallel biofilm and capsule formation determinations in 96 well flat bottom uncoated microtiter plates were handled similarly. Absorbance was determined with the Bioscreen C (honeycomb plates) and a Beckman Coulter DTX 880 multimode spectrophotometer (96 well plates).
2.4. Stain Decolorization
To determine if either crystal violet or Alcian blue could be completely removed from the stained biofilm or capsule, respectively, the wells of honeycomb plates (n = 6/stain/treatment) with adherent biofilm (S. aureus) were stained, washed, dried, then treated at least 3 times (300 µL/well) with each of the following: acetone, methanol, xylene, absolute ethanol or gram decolorizer (50/50 acetone/ethanol).
2.5. Statistics
Data were evaluated by ANOVA (GraphPad InStat 3.06 for Windows, GraphPad Software Inc.). Mean values were considered significantly different at p < 0.05.
3. Results and Discussion
Staphylococcus aureus. Menaquinone (vitamin K2) is produced via the mevalonate pathway by various bacteria, including S. aureus [11]. In S. aureus menaquinone has
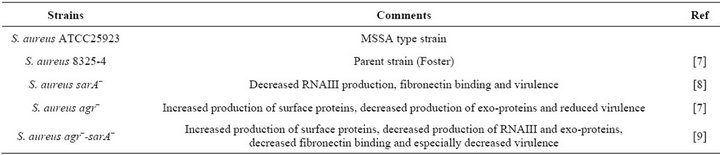
Table 1. Staphylococcus aureus strains tested.
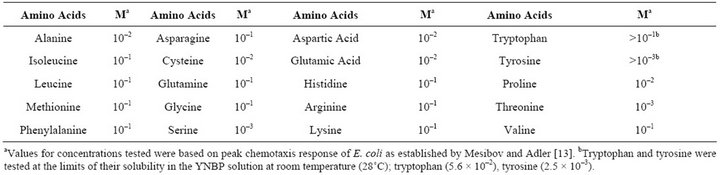
Table 2. Concentrations (M) of amino acids tested for their effect on E. coli ATCC 25922 growth, biofilm and capsule formation.
been found to play a key role in the electron transport chain [12]. The effect of exogenous menaquinone on staphylococcal growth, capsule and biofilm formation was determined. Regardless of strain or vitamin concentration present, no significant difference was measured for total absorbance achieved as compared to the control (1.7 Abs420 - 590). The effect of menaquinone on generation time was strain and menaquinone concentration specific with no discernable pattern detected (Table 3). Of the strains tested, S. aureus agr–-sarA– showed the slowest rate of growth and most variable doubling time in response to menaquinone. S. aureus ATCC 25923 exhibited the shortest doubling time regardless of menaquinone concentration. These findings are consistent with reports on the effects of exogenous hormones, i.e., the impact of menaquinone on growth is both strain and hormone concentration specific [5,14]. To determine if measurement of biofilm formation using the Bioscreen C is comparable to that measured for the standard microtiter plates method [10], parallel assays were performed (Figure 1). There was no significant difference between biofilm measurements regardless of the methodology (Bioscreen C vs. spectrophotometer) used. Both techniques indicated that menaquinone concentration tested had no effect on biofilm formation. In addition, menaquinone had no effect on capsule formation (Alcian Blue staining material).
These results confirmed our hypothesis that the same plates used for Bioscreen C growth measurements could also be subsequently used for measurement of biofilm or capsule production. We further tested to determine if the utility of the honeycomb plates could be expanded by using multiple stains/well. Wells prestained with gram’s crystal violet or Alcian Blue were treated with a variety of stain solvents, i.e., acetone, methanol, xylene, absolute ethanol or gram decolorizer (50/50 acetone/ethanol). None of the solvents tested completely destained the plate wells. Thus, with regards to the two standard stains used for biofilm and capsule determination the plates are single use.
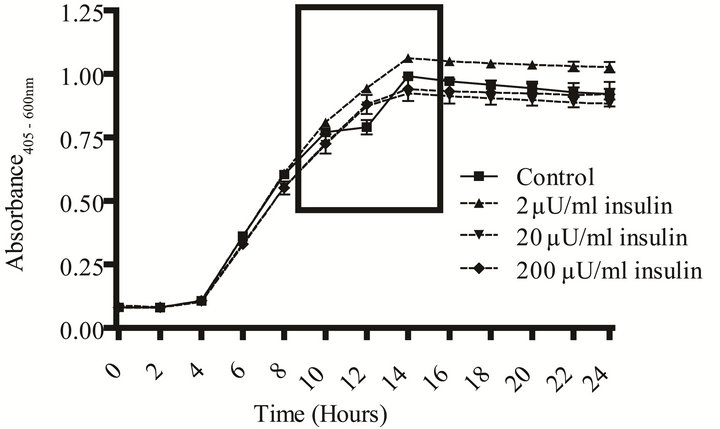
E. coli. Communication between individual bacterial cells and recognition of chemical signals in the environment are necessary for population survival and biofilm formation [1,4,15-20]. In vivo, pathogens are exposed to hormones and other micronutrients that are shared across the taxonomic kingdoms. Human recombinant insulin has been shown to function as an interkingdom signal for E. coli [4,5]. We tested a range of rh-insulin levels (2 - 200 µU/mL), that correspond to the human physiological range of insulin, to determine if this methodology also has utility in measurement of a gram negative’s growth, capsule and biofilm formation in response to a quorum signaling compound. The effect of insulin on growth in response to various amino acids in two different media (YNBP and artificial urine) was measured using amino acid concentrations (Table 1) previously reported to affect another behavioral phenotype, chemotaxis [4,5,13]. Of the amino acids tested in YNBP, insulin only affected the growth profile of E. coli grown in the presence of proline. E. coli exhibited biphasic growth in proline alone; however, with the addition of rh-insulin (2, 20, or 200 µU/mL) E. coli’s growth was monophasic (Figure 2). Growth of E. coli in YNBP-proline with 2 µU or
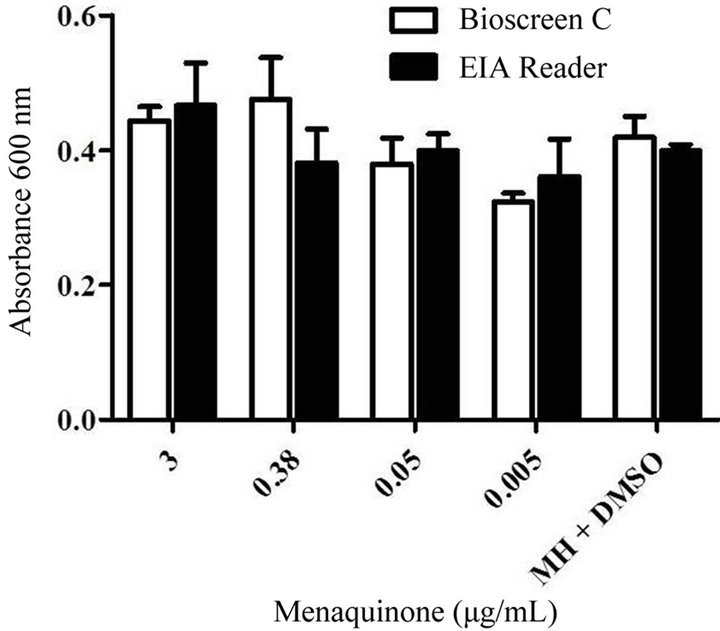
Figure 1. Comparison of the levels of biofilm after growth in 100 well honeycomb plates to levels in 96 well microtiter plates. Levels of S. aureus ATCC 25923 biofilm formation after growth in Mueller Hinton medium (48 hrs. 37˚C, shaking; pH 7) with various levels of menaquinone (0.05 - 3 μg/mL) were measured in either the Bioscreen C or Beckman EIA reader.
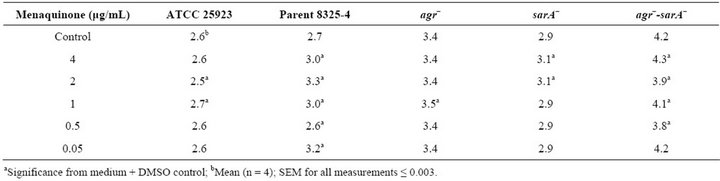
Table 3. Effect of menquinone on generation times of Staphylococcus aureus strains.
 (a) Growth curve.
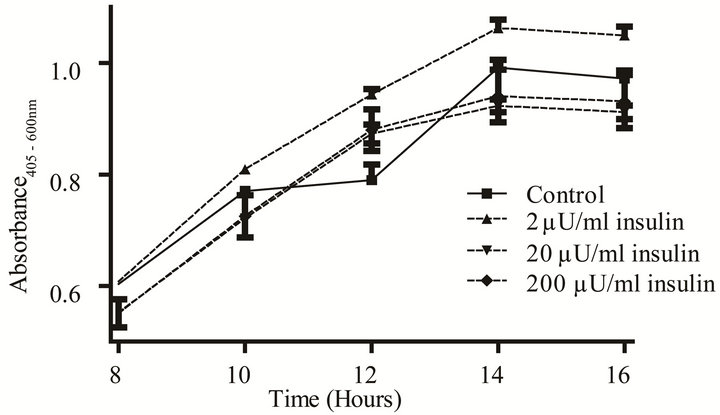 (b) Monophasic vs. diphasic growth.
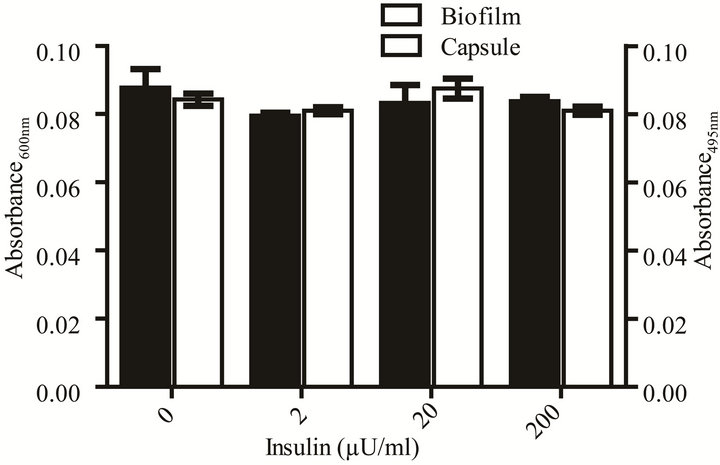 (c) Biofilm and capsule formation.
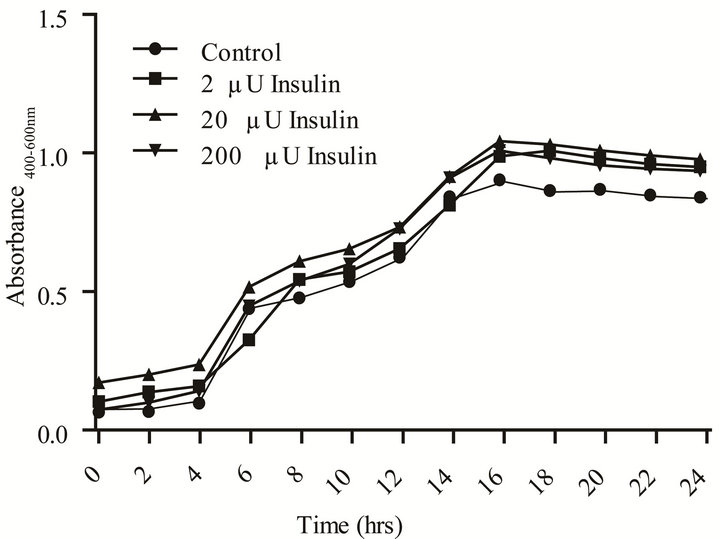
Figure 2. Effect of rh-insulin on E. coli ATCC 25922 growth, biofilm, and capsule production at 37˚C in YNBP with proline (10–2 M). (a) Organisms grown (37˚C, 24 hours, shaking) in YNBP with proline (10–2 M) at various levels of rh-insulin (2, 20, 200 µU/mL) were evaluated for growth and generation time by an automated system (Bioscreen C; absorbance reading: growth—Abs405-600 nm). Variations in growth curve pattern (monophasic vs. diphasic) are highlighted; (b) Enlarged view of area highlighted in Panel A, showing monophasic vs. diphasic growth curve shapes; (c) Organisms grown (37˚C, 24 hours, shaking) in YNBP with proline (10–2 M) at various levels of rh-insulin (2, 20, 200 µU/mL) were stained with Alcian blue and crystal violet and evaluated for capsule and biofilm formation, respectively, by an automated system (Bioscreen C; n = 6; absorbance reading: Alcian blue—Abs495 nm; crystal violetAbs600 nm).
200 µU while monophasic was slower by 4 and 6 minutes, respectively, while the level of final growth achieved was highest for YNBP-proline with 2 µU of insulin. However, although insulin, like other quorum-signaling compounds, appears to enhance gene expression, which would decrease the requirement for metabolic shift associated with biphasic growth, it does not affect biofilm formation or capsule production under these growth conditions [21].
The presence of insulin in artificial urine with proline, an amino acid naturally present in human urine, signifycantly increased (p < 0.05) doubling time and the overall level of stationary phase growth as compared to medium control (Table 4 and Figure 3). However, the doubling times decreased with increasing levels of insulin. In contrast to what was measured in YNBP medium, insulin in artificial urine with proline altered both biofilm formation and capsule production. The optimum insulin concentration for biofilm formation was 200 µU/mL resulting in a more than doubling of biofilm levels despite there being no significant difference in maximal growth measured. Capsule formation was also enhanced by the presence of insulin at all concentrations tested with optimum concentration for maximal capsule formation 20 µU insulin. This indicates that the level of capsule and biofilm produced per cell is enhanced, a finding that would be difficult to determine in the absence of parallel measurements of growth. Regardless of insulin concentration tested, a significant increase (p < 0.05) in acidic polysaccharide production (capsule) was measured which appears to parallel the relative effect of insulin on final level of growth achieved. These results support previous studies that rh-insulin has quorum signal-like properties affecting phenotypic expression in a concentration-specific manner. The phenotypes affected by rh-insulin (biofilm and capsule) are virulence factors associated with human infections [3]. As this study has shown, interacttions between rh-insulin and E. coli are complex and likely under the regulation of a multitude of factors. Further studies, examining the specific combinations of amino acids likely to be found in human urine in disease states, would help expand our understanding of rh-insulin effects on E. coli physiology in disease states.
In conclusion, the Bioscreen C, a growth curve analyzer, provides a highly reproducible platform for subsequent analyses of expression of virulence-associated phenotypes, e.g. biofilm formation or capsule production, for both gram positive and gram negative bacteria that is labor saving and cost effective. Using this system we were able to directly correlate growth kinetics to biofilm formation and capsule production in the same system. The biggest drawback to the use of this system is the inability to destain the honeycomb plates thus expanding their utility.
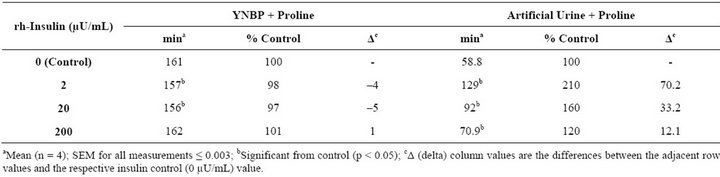
Table 4. Effect of rh-insulin on E. coli ATCC 25922 generation time in YNBP and artificial urine with proline.
 (a)
(a)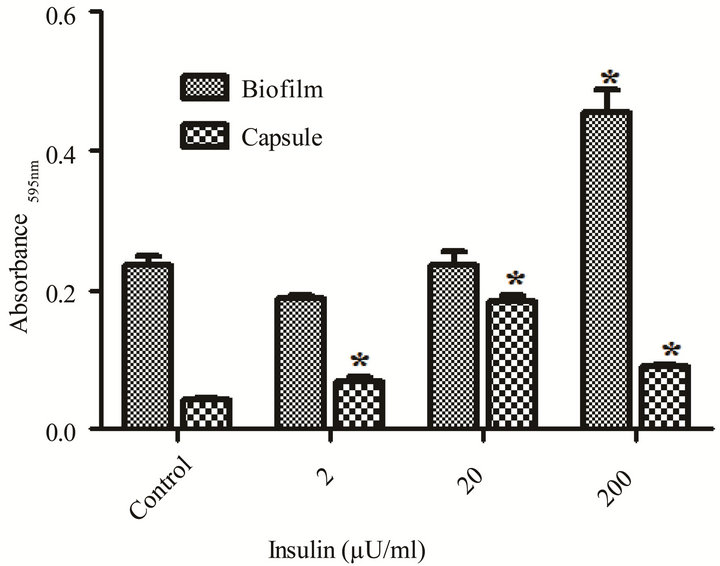 (b)
(b)
Figure 3. Effect of rh-insulin on E. coli ATCC 25922 growth, biofilm, and capsule production at 37˚C in artificial urine with proline (10–2 M). (a) Organisms grown (37˚C, 24 hours, shaking) in artificial urine with proline (10–2 M) at various levels of rh-insulin (2, 20, 200 µU/mL) were evaluated for growth and generation time by an automated system (Bioscreen C; (n = 6); absorbance reading: growth—Abs405 - 600 nm); (b) Biofilm (crystal violet stained material) and capsule production (Alcian blue stained material) was evaluated after growth as described in A for growth determinations. Significant (p < 0.05) differences between test and medium alone control are designated by asterisk.
4. Acknowledgements
This work was supported by the Office of ORSP at Midwestern University. No compensation was received from Growth Curves, Inc.
REFERENCES
- C. Goller and T. Romeo, “Environmental Influences on Biofilm Development,” Bacterial Biofilms, Vol. 322, 2008, pp. 37-66. doi:10.1007/978-3-540-75418-3_3
- S. Stoitsova, R. Ivanova and T. Paunova, “Biofilm Formation by Reference Strains of Escherichia coli,” Comptes Rendus de L Academie Bulgare Des Sciences, Vol. 60, 2007, pp. 71-76.
- B. Trautner and R. Darouiche, “Role of Biofilm in Catheter- Associated Urinary Tract Infection,” American Journal of Infection Control, Vol. 32, No. 3, 2004, pp. 177-183. doi:10.1016/j.ajic.2003.08.005
- K. Klosowska and B. Plotkin, “Human Insulin Modulation of Escherichia coli Adherence and Chemotaxis,” American Journal of Infectious Diseases, Vol. 2, 2006, pp. 197-200. doi:10.3844/ajidsp.2006.197.200
- B. J. Plotkin and S. M. Viselli, “Effect of Insulin on Microbial Growth,” Current Microbiology, Vol. 41, No. 1, 2000, pp. 60-64. doi:10.1007/s002840010092
- D. Griffith, D. Musher and C. Itin, “Urease. The Primary Cause of Infection-Induced Urinary Stones,” Investigative Urology, Vol. 13, 1976, pp. 346-350.
- R. Novick, H. Ross, S. Projan, J. Kornblum, B. Kreiswirth and S. Moghazeh, “Synthesis of Staphylococcal Virulence Factors Is Controlled by a Regulatory RNA Molecule,” EMBO Journal, Vol. 12, 1993, pp. 3967- 3975.
- P. Chan and S. Foster, “Role of SarA in Virulence Determinant Production and Environmental Signal Transduction in Staphylococcus aureus,” Journal of Bacteriology, Vol. 180, 1998, pp. 6232-6241.
- J. Blevins, K. Beenken, M. Elasri, B. Hurlburt and M. Smeltzer, “Strain-Dependent Differences in the Regulatory Roles of sarA and agr in Staphylococcus aureus,” Infection and Immunity, Vol. 70, No. 2, 2002, pp. 470- 480. doi:10.1128/IAI.70.2.470-480.2002
- F. Farzam and B. Plotkin, “Effect of Sub-MICs of Antibiotics on the Hydrophobicity and Production of Acidic Polysaccharide by Vibrio vulnificus,” Chemotherapy, Vol. 47, No. 3, 2001, pp. 184-193. doi:10.1159/000063220
- R. Bentley and R. Meganathan, “Biosynthesis of Vitamin K (menaquinone) in Bacteria,” Microbiology Reviews, Vol. 46, 1982, pp. 241-280.
- P. Goldenbaum, P. Keyser and D. White, “Role of Vitamin K2 in the Organization and Function of Staphylococcus aureus Membranes,” Journal of Bacteriology, Vol. 121, 1975, pp. 442-449.
- R. Mesibov and J. Adler, “Chemotaxis toward Amino Acids in Escherichia coli,” Journal of Bacteriology, Vol. 112, 1972, pp. 315-326.
- B. Plotkin, Q. Erickson, R. Roose and S. Viselli, “Effect of Androgens and Glucocorticoids on Microbial Growth and Antimicrobial Susceptibility,” Current Microbiology, Vol. 47, No. 6, 2003, pp. 514-520. doi:10.1007/s00284-003-4080-y
- A. Horswill, P. Stoodley, P. Stewart and M. Parsek, “The Effect of the Chemical, Biological, and Physical Environment on Quorum Sensing in Structured Microbial Communities,” Analytical and Bioanalytical Chemistry, Vol. 387, No. 2, 2007, pp. 371-380. doi:10.1007/s00216-006-0720-y
- M. Miller and B. Bassler, “Quorum Sensing in Bacteria,” Annual Review of Microbiology, Vol. 55, 2001, pp. 165- 199. doi:10.1146/annurev.micro.55.1.165
- M. Parsek and E. Greenberg, “Sociomicrobiology: The Connections between Quorum Sensing and Biofilms,” Trends in Microbiology, Vol. 13, No. 1, 2005, pp. 27-33. doi:10.1016/j.tim.2004.11.007
- N. Reading and V. Sperandio, “Quorum Sensing: The Many Languages of Bacteria,” FEMS Microbiology Letters, Vol. 254, No. 1, 2006, pp. 1-11. doi:10.1111/j.1574-6968.2005.00001.x
- D. Stickler, N. Morris, R. McLean and C. Fuqua, “Biofilms on Indwelling Urethral Catheters Produce QuorumSensing Signal Molecules in Situ and in Vitro,” Applied and Environmental Microbiology, Vol. 64, 1998, pp. 3486-3490.
- M. Surette and B. Bassler, “Quorum Sensing in Escherichia coli and Salmonella typhimurium,” Proceedings of the National Academy of Sciences USA, Vol. 95, No. 12, 1998, pp. 7046-7050. doi:10.1073/pnas.95.12.7046
- S. Hooshangi and W. Bentley, “LsrR Quorum Sensing ‘Switch’ Is Revealed by a Bottom-Up Approach,” PLOS Computational Biology, Vol. 7, No. 9, 2011, Article ID: e1002172. doi:10.1371/journal.pcbi.1002172
NOTES
*Corresponding author.