Technology and Investment
Vol.1 No.3(2010), Article ID:2492,9 pages DOI:10.4236/ti.2010.13021
The Feasibility of Using an Automated Net Asset Value Validation Tool in an International Investment Bank
School of Computer Science & Informatics, University College Dublin, Belfield, Dublin, Ireland
E-mail:{sammer.markos, an.lekhac, tahar.kechadi}@ucd.ie
Received April 1, 2010; revised July 5, 2010; accepted July 8, 2010
Keywords: Data Mining, Funds, Investment Banking, Alternative Investment, NAV, Hedge Funds
Abstract
Fund administration is a relatively new service that some banks and back office offer Investment Company’s. This service was regarded as “boutique” in some countries as it was not a necessity hence not enforced by law to have independent calculation and verification of a fund price. However, this sector of business was and has been a major factor in the economic boom for many countries worldwide. In general most companies have many human resources tagged to this service. This is mainly due to the high volume of manual work that needs to be carried out to validate a Net Asset Value. If the Net Asset Value is calculated incorrectly and hence not validated correctly then there is huge repercussions for the company that calculated the Net Asset Value (monetary, reputation, losing a client). With the turn in the current climate the operational requirements that was once affordable has snowballed out of control, this is why invest company’s are finding ways to reduce costs and hence use less labour intensive methods or relocate these specific jobs to lower cost countries such as Eastern Europe and India. However, this is not without its own set of problems, some being that most companies and in our case, the company always employs a distributed service requirement. Within the scope of a collaboration project which focuses on a Net Asset Value automated validation solution to replace a labour intensive manual approach. In this paper, we research the feasibility of using such a tool in a funds business of an international investment bank where parts of this process are based in Asia and Europe. Our approach is based on surveying people that are currently working in the Net Asset Value validation process, and in turn analyse the results attained. Throughout this process, we must not only focus on the efficient method of applying a Net Asset Value validation automated solution but we must also provide an overview of the important factors in building a solutions to be used in a fund administration environment.
1. Introduction
Funds administration is a subsection of the investments industry, i.e. trading on the stock exchange [1]. When it comes to trading on the stock exchange there are three tiers in administration, at the front line is front officethese are the traders, they execute the trades on behalf of a client. The second tier is middle office, here is where all the actual trade information and others are tabulated and sent in an agreed format to the final tier; back office [2]. Back office is were the accountancy work is carried out for all trades as per front office’s instructions hence the price or Net Asset Value (NAV) of a fund is calculated. A NAV is the price at which an investor can buy/sell shares of a fund, a fund is a collective investment entity hence a pool of different instruments.
There are many steps in the pricing or valuation of a fund. This depends on what type of fund it is, however, all funds consist of six core pieces: 1) Stock reconciliation, 2) reflection of corporate actions, 3) pricing of instruments, 4) Booking, calculating and reconciling fees and interest accruals, 5) cash reconciliation and finally, 6) NAV/price validation.
The NAV validation piece is so vital as this is were the verification for accuracy and correctness occurs, hence is the stock reflected correctly and in line with the prospectus or legal contract between client and administrator, are then prices correct and so on. In short the verification of points 1-5 of the NAV preparation. If a NAV price is released to a client is incorrect then the fund administrator is liable according to the fund administration agreement, this in cases can be hundreds of thousands of monetary compensation to investors and the client. This is why it is imperative that if the administrator is verifying the NAV manually that there should be a way to automate the NAV validation piece to not only reduce cost but also to reduce if not eliminate human error. One major factor as previously discussed is to cut costs, must reduce expenditure in the current climate, working on the Toyota LEAN methodology “Increase efficiency and decrease waste—more value less work” [1]. Hence reducing human resources and maintaining service we can theoretically run the business with a reduction in cost. A second reason is that most fund administration companies are located in the financial district IFSC (International Financial Services Centre-Dublin); therefore are regulated by the financial regulator (FR). and are audited yearly, so according to the Irish and EU directives there are many checks and standard reports that must be available, these reports are always checked for manual intervention, hence using a large amount of human interaction in a process increases the possibility of errors occurring. As this is an international fund administration company, their operation is spread throughout the world i.e. Europe, Asia, North America etc. There needs to be an improved approach to maintain and track all operations across this distributed environment.
The funds administration industry is trying to reduce the cost of the operational cost by implementing a NAV validation tool. Net asset Value (NAV) or the price at which a fund or pool of investments is priced in the market. Even though this process involves some human interaction hence solving an exception.
There are four companies that are regarded as the leaders in the market when it comes to a NAV validation tool, Comit (NAV Audit), Linedata (NavQuest), Moneymate (MoneyMate Control Platform) and Milestone (pControl), all these applications have an acceptable standard for compliance reasons and are therefore accepted as an automated tool by the FR.
However, they all have one weakness; the tools are generic for all companies, hence not tailor made to the organisations needs. For example, company A has a certain set of rules that are used for fund X and therefore only need certain rules to be applied; also, this company uses ± 20% tolerances as its parameters. Therefore, they have no dynamic rule selection; hence, if field A is populated then Rule Y should apply. As an extension to this study, we will explore the potential of automatic rule selection.
This study was a natural extension to that, we would like to investigate what are the obstacles in implementing such a radical solution, choosing the correct validation software, data integration, rule sets used, dynamic rule selection and not forgetting the infamous obstacle of the cultural issues associated.
However, in an economy that is currently very volatile and fragile, this reflects on the workers that implement this automated service. At this time, culture and human reactions take precedence. These obstacles are placed at the forefront of the discussion, as people feel threatened.
This paper is organised as follows: Section 2 is a brief review of the background in NAV validation and preparation in banking and finance. Section 3 shows the current operating model of an international investment bank. We present our approach in Section 4. We analyse some of the results achieved in Section 5. Finally, we conclude in Section 6
2. Background in NAV Validation and Preparation in Banking and Finance
2.1. What is a NAV?
A NAV is a price for an entity that is published on the stock exchange, which then allows investors to buy shares/invest in to this entity.
Fund administration is the name given to the set of activities that are carried out in support of the actual process of running a collective investment scheme, whether the scheme is a traditional mutual fund, a hedge fund, pension fund, unit trust or something in between. (Figure 1)
These administrative activities in the scope of this document would include the calculation of the Net Asset Value (NAV) of a fund (investment scheme or pool of money). Some investment management companies calculate their own NAV. However if it is an Irish regulated fund then the NAV must be calculated and verified independently (EU UCITS Regulations 1989) hence back office fund administrators. Figure 1 illustrates the components of a fund. A NAV can be calculated daily, weekly, bimonthly, quarterly, semi annually. Therefore, the NAV frequency is dependent on the characteristics of the fund.
2.2. What is Involved in the Calculation and Preparation of a NAV?
The core pieces for calculating a NAV on a specific day are: stock or portfolio reconciliation; executing any potential corporate actions on some of the securities held on the portfolio, pricing the securities/instruments on the portfolio, booking, calculating and reconciling fees and interest accruals; these could be legal fees, audit fees and some NAV based fees (calculated on the size of the NAV) such as administration fees, management fees and performance fees (the latter two are more common in hedge funds rather than mutual funds), reconciling the cash accounts of the fund and finally validating the NAV, once all aspects are completed (Figure 2).
2.2.1. Stock or Portfolio Reconciliation
This is the first step in NAV preparation; this is where the fund accountant will collate and reflect the below all shares bought and sold by the investment/portfolio manager on to the fund accounting system generally this step is either completely manual or has a considerable amount of manual intervention.
2.2.2. Executing any Potential Corporate Actions on Some of the Securities Held on the Portfolio
Once all trades/shares are reflected, corporate actions such as acquisitions, mergers, ISIN changes, dividends etc must be also reflected on the fund. These can impact the funds cash i.e. dividends payable/receivable, and also the number of holdings/name/entity i.e. ISIN change, merger etc. This is also a completely manual process no automation at all hence prone to human error.
2.2.3. Pricing the Securities/Instruments on the Portfolio
Once all stock positions and corporate actions are reflected on the fund accounting system, the next step is to price the stock/securities held on the funds portfolio. Pricing is a very important issue to many back office fund administered because they must be independent with the prices. They must reflect the price according to the legal contract or prospectus, this legal document outlines the strategy of the fund and that includes pricing sources and price types for example: The pricing hierarchy of equity in fund X is bid price source Extel, Telekurs then Bloomberg. That means the fund administrator must use first try to source the price from Extel if there is no price available from this source then they move to Telekurs and so on. This is a semi automatic process.
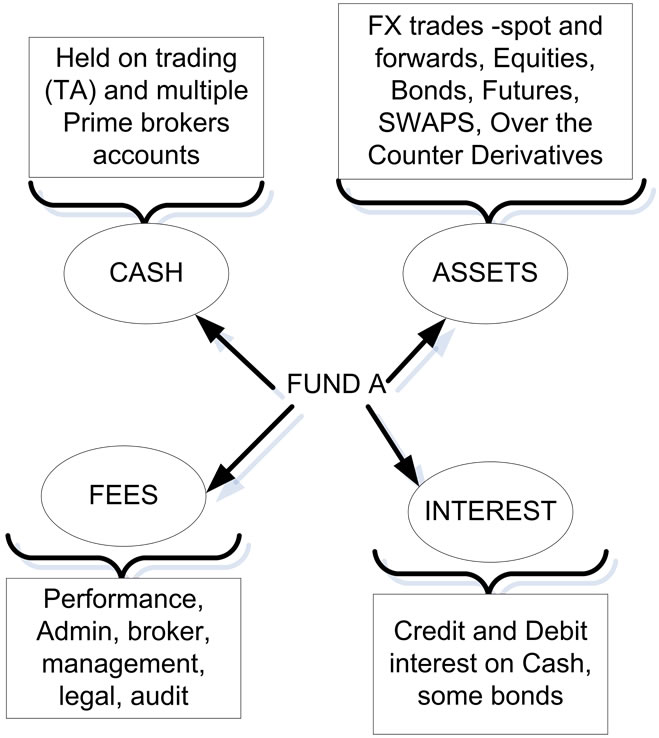
Figure 1. Components of a fund.
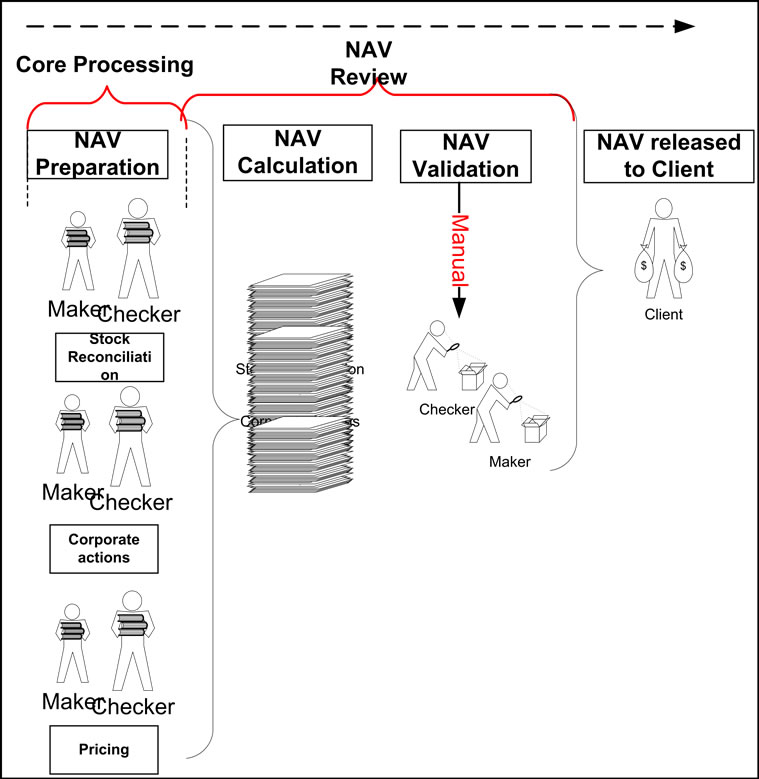
Figure 2. Flow chart of a NAV preparation/validation process.
2.2.4. Booking, Calculating and Reconciling Fees
Some of the fees/income are legal fees, audit fees and some NAV based fees (calculated on the size of the NAV) such as administration fees, management fees and performance fees (the latter two are more common in hedge funds rather than mutual funds), on the income side, it is more like credit interest accruals.
There are e parts when it comes to fees. First, the calculation of the correct amount of the fund charged as at particular NAV date. For example the NAV is monthly, the audit fees are EUR 12,000 annually, so the amount that should be reflected as an accrual on the NAV is EUR 1,000, however if these fees are prepaid then the amount that would be reflected is a prepaid expense that is reduced every month. Another scenario is that the fund paid the investment manager 1,000 of the 12,000, and then this amount must be reflected as leaving the fund cash account (more about this in cash reconciliation section below) and a reduction in the accrual. This process is semi automatic, the accrual is calculated by the accounting system, however any payments are reflected manually.
2.2.5. Reconciling the Cash Accounts of the Fund
At this stage of the NAV preparation has one final stage and it is reconciling all the cash accounts that the fund holds, these accounts can be multicurrency and be held in multiple locations. For Example: there is a EURO account held with JPMorgan, a USD margin account held at Goldman Sacs. Before the recession that hit the economy the funds used one broker, now the common investment manager strategy is to spread their liquid cash across many brokers to reduce the exposure to the market. This step is reconciling all cash statements with what is reflected on the fund accounting system. This is a manual process no automation.
2.2.6. Validating and Publishing the NAV
Once all the core pieces of the NAV are executed. The validation process of the NAV must then occur. This is the most time consuming and at present exclusively manual process. In this step, all points carried out in producing a NAV are checked. The figures that are reflected on the fund accounting system are checked against broker statements, pricing vendor reports, cash statements etc. This step is normally completed by eye balling the reports and making sure that the external reports match what is reflected on the NAV (in the fund accounting system). If the figures do not match or are not within the allowable tolerance dictated by the prospectus then valid evidence must be attained to answer why not, this evidence is attached as a hard copy within the file for audit purposes. This where it was decided that there is too much emphases on manual process and that there is a need for human resources as it is labour intensive and also implementing a automated solution reduces the risk of errors.
3. Current Operating Model in BIP1 Bank
In Section 2, the process of NAV preparation and validation was outlined in brief, NAV process can be completed by the same individual, however BIP bank employs a scatted model:
• Stock or portfolio reconciliation is carried out in Eastern Europe and Asia
• Corporate actions is carried out in Ireland, UK
• Pricing the securities/instruments on the portfolio: Luxembourg, India
• Booking, calculating and reconciling fees, audit fees is calculated in Ireland, UK
• Reconciling the cash accounts of the fund occurs in India and Eastern Europe
• Validating the NAV, once all aspects above are completed in the UK and Ireland Currently the means by which funds are administered in BIP bank is using a scattered approach. This is the same model employed by many other fund administration companies globally. Model currently deployed by BIP multinational bank to fund administration only (not including TA)
Figure 3 shows an example for Fund XYZ administered using a scattered approach. Poland will complete the trade/stock reconciliation part of the NAV. Poland will then inform Ireland as the NAV validation piece occurs in Ireland. Ireland valuation team will then ask the corporate actions team in the UK to execute all appropriate corporate actions on the fund. Once that is complete the Irish NAV validation team send a an email to Luxembourg to ask the team to price the securities on the fund Luxembourg once again inform the valuation team in Ireland to inform them that the task is complete. Ireland once again informs the cash team in Poland to complete the process of cash reconciliation. At this time, the valuation team in Ireland calculates the accruals on the fund. Upon completion of the cash reconciliation, the NAV should be ready for validation, and this as discussed above occurs in Ireland.
Using this approach is not cost effective, can have security and hence audit issues as all communication between the teams is via email and not one core system. This is why we recommend an automated solution, which is currently being researched for the current business; this is an automated solution where all actions will be centralised using one core validation application. All systems will feed into this tool hence points 1 to 5 as outlined in section 2.0. All resources in the multiple locations will have full visibility in to the process and hence no need for emails/other communication. First step in this analysis is to see:
1) Can an automated solution be applied to the hedge business technically?
2) What will the challenges be in adopting this model?
3) Is the business ready for this solution?
4) Is their a cost saving using this approach?
5) and anything else that the data showed?
Figure 4 illustrates the new automated solution and how it will affect the overall process.
In order to answer these questions, we carried out some research on the feasibility of this approach by making use of a survey on the daily activities of the NAV validation team and in turn analysing these results.
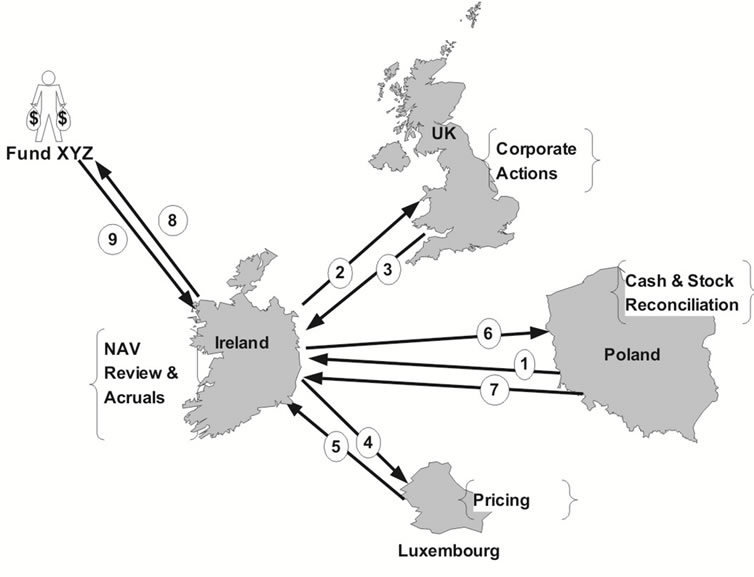
Figure 3. Current manual operating model of BIP bank.
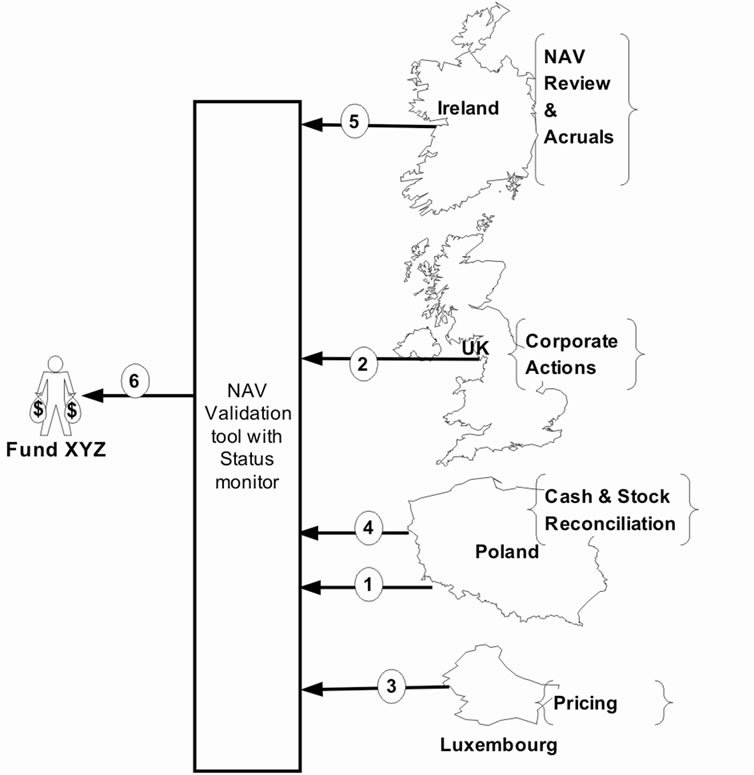
Figure 4. Automated solution.
4. Methodology
The evaluation of the NAV validation tool is a complicate task [3-5] in terms of resource capacities and to the best of our knowledge there is no related works on this axe. Therefore, our approach is composed of two main steps: preparing data and analysing of data collected to extract useful knowledge. This second step will be presented in Section 5.
As the purpose of this research is to efficiently apply a new NAV validation tool that has not been deployed yet and there is no experience of using same tools in the company profile, the data should be collected from the real activities of NAV validation teams. As a consequence, pre-processing step is also needed to make datasets ready and meaningful enough to analyse.
4.1. Data Collection
The raw data was collected through a survey carried out by interviewing experts in the fund accounting world [6]. The Survey was designed using knowledge of the funds business. It was agreed that the data will be collected using interviews and responses. These responses were categorical in nature and hence will assist in the analysis. Data collection segment involved interviewing 162 people across 2 sites. The data collection lasted approximately 15 business days, this process involved holding separate interviews which spanned between 5 and 20 min. Using this technique we were able to collect other important information which was more in line with cultural issues and procedures, this will be discussed further in the result section. Data collected included the following attributes:
• Number of people tagged to each fund and subsequently each client. This is important to collate exactly who does what and hence assist in collating information about cost savings with resource capacity in mind.
• Client Name: this was an informative field that acted as a marker—a descriptive field for purposes of reporting.
• Fund Legal Name and Fund Type e.g. Stand alone, master feeder fund of funds. This field was used for analytics and fund characterisation; hence when thinking about a validation tool can the validation tool take a hold of a specific type of fund hence is it “able” to mimic a manual approach or is the fund type too complex.
• Base CCY and Asset Value of a fund, this field was used also as a marker to convert non euro NAV balances to EUR so as to standardise the total that each fund holds-used in resource capacity for instance. If the NAV of fund A is 5 million and there are 4 people tagged to this fund and the cost to me is 4 million per year, will I have a cost saving if we automated the validation instead of manual validation; hence reduce cost and human resource.
• Prime Broker, this field was vital as a precursor to NAV validation tool because if we know what prime brokers are used by the clients then all the reports in question must be streamed into the software. This step needs iteration with prime brokers.
• NAV Frequency, monthly, weekly etc, this field was used to see how out time was spent on each client and subsequently fund and in future will dictate the checks that will need to be put in place for the validation of a NAV—for example if the NAV is monthly then there should be a rule that states that checking monthly price tolerance is irrelevant as stock prices will dramatically fluctuate however this rule needs to be in place for a daily NAV as you will not expect a large movement in price in one day.
• Type of instruments held on portfolio e.g. bonds, futures, options etc. This was used to dictate what is needed to value and validate a NAV, there are certain rules for each type of instrument hence this should give us an actual idea of the complexity of a fund, i.e. does it need more resources? Does the resource need extra time to validate the NAV?
• Number of open positions on the portfolio, volumes of trading per NAV period and Portfolio Size., these important in calculating man hours and resources, hence to check a portfolio of 10 instruments should - using logic be less time and resource draining than a portfolio with 1000 open positions. If a fund trades 100 times a month then this must also be less resource draining as 2500 trades per month. The asset size is important to evaluate the cost of providing a service compared to fees charged to the company.
• Perceived complexity of the fund: this was a vital indicator in the assessment of what the user thought was a complex fund. We used this as a comparison to actual complexity keeping mind variables outlined above.
• Processing time of checking the fund locally, processing time of checking the fund abroad, processing time of preparing the fund in Ireland and finally processing time of preparing the fund abroad. These attributes were used to evaluate the cost effectiveness of moving certain services to Asia and Eastern Europe, and also to ensure resource capacity of the NAV validation teams in Western Europe.
The information collected above was deemed necessary to evaluate the resource capacity according to certain attributes such a: how many people are needed to complete a NAV for a specific client, the level of the person was used as a marker. The characteristics of a fund were also defined by instrument that are held and others. We used the size of the portfolio as a bench mark for income and expenditure. Once this data was collected the data was normalised [7] hence upon data input, the interviewer could use difference abbreviations for the same question. This is discusses in the section following.
5. Analysis of Results
Most of the techniques used to analyse the results are standard descriptive statistics with an evaluation of correlated variables [8] e.g. are the complexity of the funds correlated to the type of fund? Is it negatively/positively correlated? The results are outlined and discussed in the following paragraphs.
There were 162 people surveyed across 2 sites, over 286 funds analysed (Table 1), we chose to analyse some funds that are going to liquidate therefore the figures can be somewhat skewed, we chose to do this as they are still part of the persons duties, the number of 286 include all run off classes - which in other words are feeders. The breakdown of fund types include: 113 master feeders, 72 standalone i.e. no feeders and 101 feeders/run-offs. The majority of the funds are administered monthly 91% of the total are monthly and only 1% are daily funds (Table 2).
We can therefore deduce that there are 450 (where funds liquidated are a total of 164) funds administered every month by 162 people which is 2.8 funds per person including feeder, if you were to remove the feeder count then the figure would be 337 funds for 162 = 2 funds per person/month.
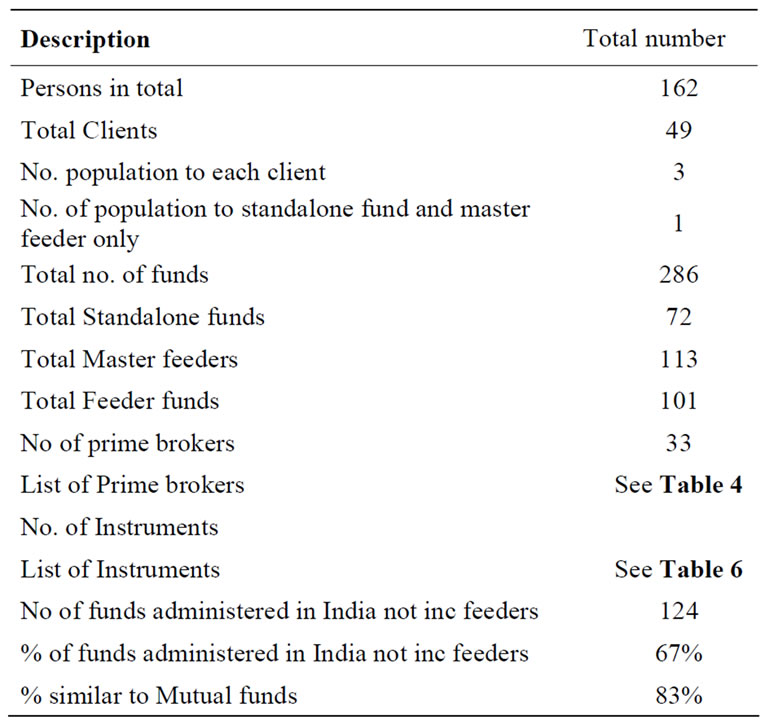
Table 1. Abstract results.
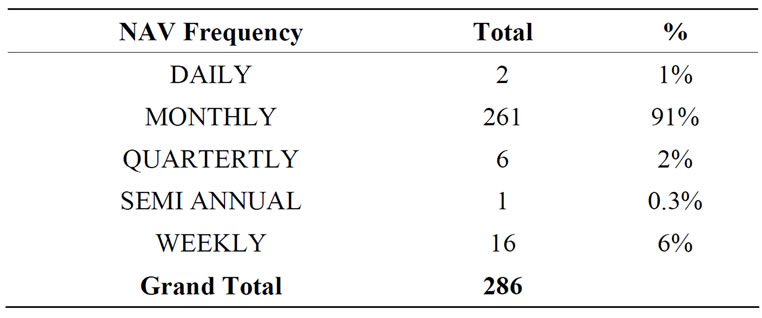
Table 2. NAV frequency of all funds.
All fund types were then analysed and certain information deemed necessary was collected, such as instruments held on the portfolio, list of prime brokers (Table 4), time that it takes to prepare the NAV, time to check the NAV, perceived complexity etc. Using this data we were able to ascertain whether the funds in question can be automated by using the validation software.
The next step in the analysis was the Ratio of people to standalone and master feeders was found to be 1 fund to 1 person. The total number of clients is 49 and that shows a ratio of 3 people per client. Classifying this proportion down into “level” of person i.e. Vice President, Assistant Vice President, Account Manager and Maker then the ratios are as per Table 3, for Funds not including feeders: there are approx 31 funds per VP, 11 funds per AVP almost 5 funds per account manager/checker and approx 2 funds per maker Even though there are over 67% of these funds (not feeders/run off classes) are partially administered in India (up to the GAV, therefore all that is needed to completed in Ireland is accrual calculation and reflection on the trial balance and P&L).
Automating the NAV validation step of the NAV preparation will logically reduce head count i.e. human resource as all manual checks done by humans can be automated. For example price checking, instead of eye balling 2 reports and ticking the reports using a red pen, the software can be fed the 2 figures from the 2 reports and it will complete the task automatically without manual tampering/error.
Upon further inspection into the variables that were attained from the analyses, people that administered the fund were asked to rate the complexity in terms of the difficulty, bearing in mind the duration of completion and the instruments on the portfolio etc. as they perceive it from 1 to 10, 1 being not complex to 10 which is equivalent to highly complex as per characterisation explained in the methodology, we cross referenced this to the size of the portfolio.
An important question when trying to improve a process by applying a validation tool is to show how to cut costs and hence become more efficient without diluting the service/the controls put in place, hence can we statistically justify the ratios seen above involving resources. Does the size of the portfolio dictate the complexity of the fund? (Table 5).
Figure 5 clearly shows that this is not the case as both high and medium levels fit a standard normal distribution hence bell shape yet the low complexity is high for all sizes of the portfolio this is shown as the trend line is skewed proving the size of the portfolio has no influence on the perceived complexity of the fund.
Another Hypothesis that was deemed necessary to be analysed when analysing the applicability of a validation tool is: does the volume of trading have a direct influence on the complexity of the fund (Figure 6 and Table 6).

Table 3. Breakdown of population into “Level” in organisation.
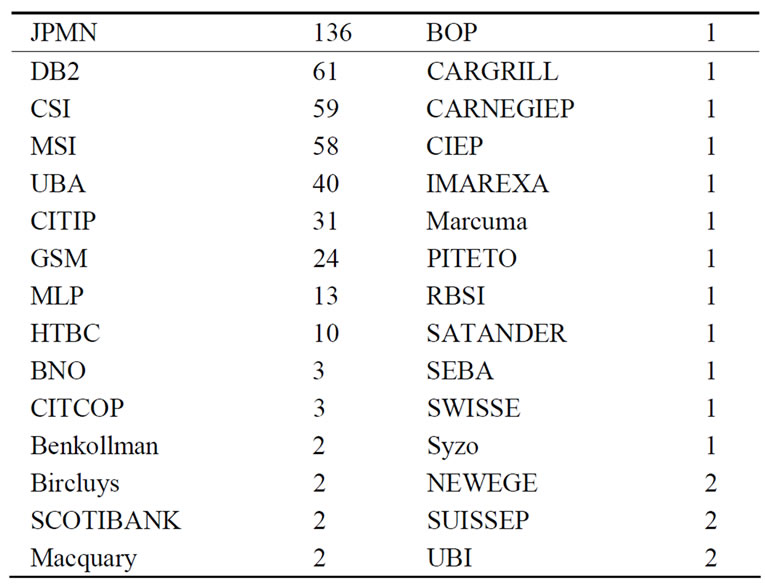
Table 4. List of prime brokers according to most commonly used.
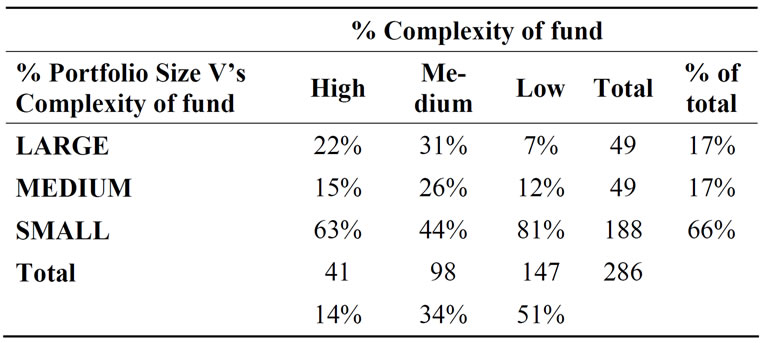
Table 5. Perceived complexity of fund V’s the size of the fund.
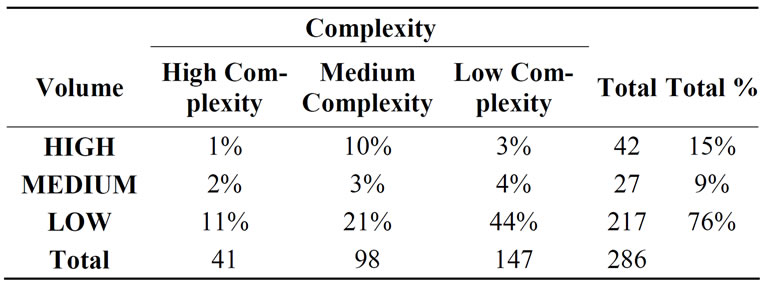
Table 6. Perceived complexity of fund V’s the volume of trading.

Figure 5. Size of the portfolio V’s the complexity of the fund.
From the figures it shows that 76% of the funds that are administered have a low volume of trades per month, so can this statistic account for the high ratio?
Figure 6 shows this is not the case as high and volumes fit a standard normal distribution and the medium volumes seems to be linear yet the low complexity is high for all volumes of the portfolio this is shown as the trend line is skewed proving the volumes of trading has no influence on the perceived complexity of the fund.
The final relevant statistic was to see how long it takes to prepare and check an official NAV on a monthly basis and how does this compare to our operations overseas (Asia and Eastern Europe) (Table 7 and Figure 7).
We used SPSS V.16.0 [9] to run a simple one way ANOVA test, to see if there was any significant difference between Asia/E. Europe and Ireland preparation time. The Results showed that there was no significant at the 95% level of confidence meaning that Ireland is still taking just as long collating and checking overseas work then we are preparing the NAV fully in Ireland. Keeping in mind that organisations are trying to keep costs down by being efficient at a minimum cost, hence minimal number of resources to carry out the tasks at hand yet still optimising their service.
Throughout the data collection and the hypothesis testing it seems there does not seem to be statistical reason why there is such a high resource drain i.e. too many human resources in place and apparently this is not to due to any technical factor but merely due to the process being manually intensive. Other factors that seemed to shine through during the interview process were cultural —people will complicate their daily task so as to secure their job, hence put obstacles in the path of an automated less labour intensive process. All that remains to discuss and show is how there could be another reason, not quantifiable explanation. Keeping in mind the bias of our sample size. When conducting this study some by-products of the study were discovered. Some of which are listed below.
1) All the process is Excel based.
2) It is based heavily on manual work from the teams; this is a huge hindrance when it comes to using a validation instrument.
3) Migration on to a new platform.
4) Difficult to price securities.
5) Market value manual reconciliation (main checkeyeballing over 1000 securities and making sure they match the broker, last months NAV figures and the investment manager).
6) All reports sent to client are via email in excel format (11 spreadsheets linked into one another huge compliance risk).
7) The NAV is prepared and checked section by section using a 15 page check sheet not all at once.
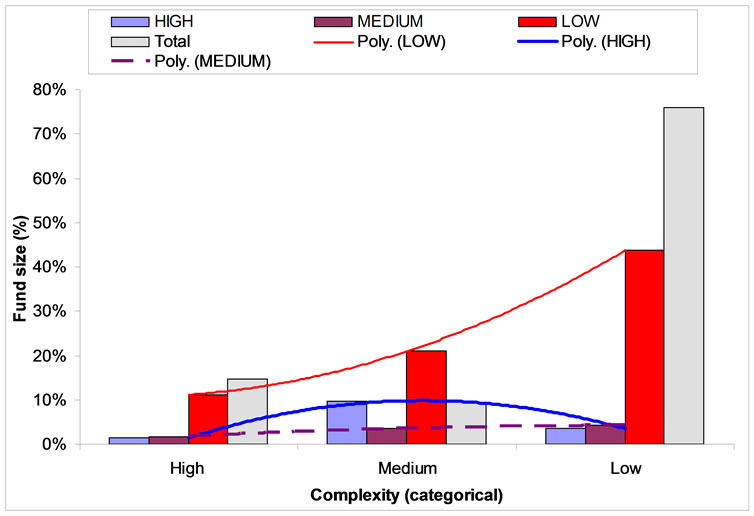
Figure 6. Volume of trading V’s perceived complexity of fund.

Figure 7. Preparation time classified into human resource.
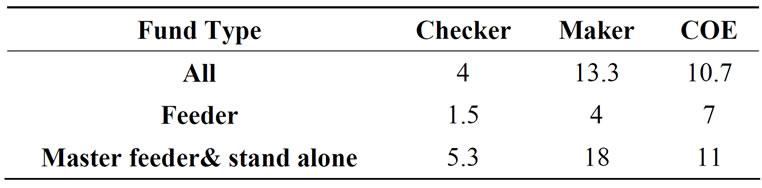
Table 7. Perceived hours per fund preparation.
There are 2 level checks for all funds (even funds partially administered in Asia hence this makes over a 4 level checks), this is waste of resources and hence profit.
We now discuss how to improve performance by using an automated NAV validation tool and improving the process flow of the NAV Preparation. Using the basis that there is no valid reason why an automated NAV validation tool cannot be used, there is nothing too complex that logical/SQL rules cannot handle. This tool should eliminate the above manual based approach and hence should reduce the number of checks that need to be carried out by multiple people, also manual spreadsheets need to be eliminated due to the fact that this manually intensive process hinders the ability for companies to pass audits [10,11] and also makes it difficult for companies to keep in line with the flaws laid down by financial regulators. And finally using a manual approach blinds management as there is no way of measuring performance of their staff, what is used is not system based it is once again manually based excel spreadsheets with manual statistics not system generated statistics.
6. Conclusions and Further Discussion
We found through this study using the strategy employed i.e. our statistical approach using the correct interview technique (friendly approach) and the selection of the correct data elements used in the interviews was essential to the success of the research. These was an underlying hypothesis that this study was designed for and that was can an automated NAV validation tool be fitted to the funds administration business for BIP bank replacing the current operating model.
The study was successful and all staff co-operated and seemed very eager to learn and be involved. We proved that a validation tool can be applied to this book of business, the only hindrance is cultural. The “this it’s the way it’s always been done” scenario. We found that there is no logical/statistical reason for a high human resource account, once again it’s the manually driven process and the reliance on excel. It seems some of the checks that are being done are “over the top” the one that stands out the most is checking the monthly price of a security against the previous months price—this does not seem logical as you would more than likely expect a movement unless it’s a fund of funds that has a NAV calculated quarterly.
One of the most astonishing findings was that even when funds are migrated to the new applications, the Excel spreadsheet will still be used and this once again falls in to culture rather than necessity. Upon further inspection into the checks that are being made almost 39% are manual and excel related and for this reason we can theoretically apply validation software.
From this study we recommend that processes are reviewed and recommendations are made to eliminate unnecessary manual checks hence rule validation can we according to the study results use an automated validation tool integrated in data/knowledge analysing framework [12-14].
7. References
[1] http://www.investopedia.com/
[2] L. L. Gremillion, “Mutual Fund Industry Handbook: A Comprehensive Guide for Investment,” John Wiley & Sons, New York, 2005.
[3] H. Levy and M. Sarnat, “Principles of Financial Management”, Prentice Hall, Upper Saddle River, 1988.
[4] “Mutual Fund Fact Book,” Investment Company Institute (U.S.). http://www.icifactbook.org/
[5] G. N. Gregoriou and J. Zhu, “Evaluating Hedge Fund and CTA Performance: Data Envelopment Analysis Approach,” John Wiley & Sons, New York, 2005.
[6] P. Giudici, “Applied Data Mining Statistical Methods for Business and Industry,” American Statistical Association Publisher, Alexandria, 2006.
[7] J. Han and M. Kamber, “Data Mining: Concept and Techniques,” 2nd Edition, Morgan Kaufmann Publishers, San Francisco, 2006, pp. 67-73.
[8] P-N. Tan, M. Steinbach and V. Kumar, “Introduction to Data Mining Errata,” Addison-Wesley Publisher, Boston, 2006, pp. 66-83.
[9] http://spss.com
[10] W. A. Rini, “Mathematics of the Securities Industry,” McGraw-Hill, New York, 2003.
[11] L. Jaeger, “The New Generation of Risk Management for Hedge Funds and Private Equity,” Institutional Investor Book, 2004.
[12] N.-A. Le-Khac, M.-T. Kechadi and J. Carthy, “ADMIRE Framework: Distributed Data Mining on Data Grid platforms,” Proceedings of International Conference on Software and Data Technologies, Setubal, 11-14 September 2006.
[13] N.-A. Le-Khac, L. M. Aouad and M.-T. Kechadi, “Knowledge Map: Toward a New Approach Supporting the Knowledge Management in Distributed Data Mining,” Proceedings of 3rd IEEE International Conference on Autonomic and Autonomous Systems, Computer Society Press, Athens, 19-25 June 2007.
[14] N.-A. Le Khac, S. Markos, M. O’Neill, A. Brabazon and M.-T. Kechadi, “An Efficient Search Tool for an AntiMoney Laundering Application of an Multi-National Bank’s Dataset,” Proceedings of International Conference on Information and Knowledge Engineering, Las Vegas, 13-16 July 2009.
NOTES
1Real name of fund cannot be disclosed due to confidentiality agreement of the project