Journal of Electromagnetic Analysis and Applications
Vol. 5 No. 4 (2013) , Article ID: 29661 , 6 pages DOI:10.4236/jemaa.2013.54024
Minimum Attenuation of Physiologically-Patterned, 1 µTesla Magnetic Fields through Simulated Skull and Cerebral Space
![]()
1Behavioural Neuroscience, Laurentian University, Sudbury, Canada; 2Biomolecular Science, Laurentian University, Sudbury, Canada; 3Human Studies Programs, Laurentian University, Sudbury, Canada.
Email: mpersinger@laurentian.ca
Copyright © 2013 Michael A. Persinger, Kevin S. Saroka. This is an open access article distributed under the Creative Commons Attribution License, which permits unrestricted use, distribution, and reproduction in any medium, provided the original work is properly cited.
Received January 31st, 2013; revised February 28th, 2013; accepted March 14th, 2013
Keywords: Time-Varying Magnetic Fields; Penetrability of the Skull; Attenuation Factors; Physiological Concentrations of Ions; 1 MicroTesla Magnetic Fields
ABSTRACT
To answer the queries concerning penetrability of ~1 µT, physiologically patterned, time-varying magnetic fields through the cranium, the proportions of attenuation through thicknesses and densities of ~3 times that of the human skull were measured directly. There was no reduction in the intensity of the magnetic field when two 2 cm thick dried pine boards (4.3 × 10³ kg∙m−3) were placed between the pairs of solenoids separated by the approximate width of the skull. Although volumes of water containing intracellular concentrations of ions did not attenuate the field intensity, placement of 290 cm2 of 2 mm sheets of duct metal reduced the amplitude by 25%. Spectra comparisons showed a clear congruence in profiles between direct measurement of the applied field and the original computer-generated pattern. These results indicate there is little validity to claims that weak, time-varying magnetic fields applied in this manner are eliminated or significantly attenuated by the human skull.
1. Introduction
Although magnetic fields are well known for their properties to penetrate matter with minimal attenuation [1], there have been occasional questions regarding the penetrability through the human cranium by magnetic field strengths in the order of 1 µT (10 mG) which are frequently found within the cultural electromagnetic environment. According to McElhaney et al. [2] the thickness of the average human skull is ~7 mm while the density is ~1.4 × 10³ kg∙m−3. We [3-5] have shown that these intensities of magnetic fields generated through the human brain between pairs of small externally located solenoids affect quantitative electroencephalographic activity that cannot be attributed to artifact and evoke cumulative changes in power within specific frequency bands that emerge after about 15 minutes of continuous exposure. The patterns of the applied fields are derived from theoretical or empirical imitations of whole-brain or localized activity by computerized software generated through custom-constructed digital-to-analogue converters. With this technology any pattern, particularly those from biologically natural origins, can be extracted, digitized, and applied through cerebral space.
Despite the repeated and systematic demonstration of intracerebral changes and their cognitive correlates that are predictable as a function of specific, applied patterns, there have been verbal arguments [6] that the strength of these fields would be eliminated by the density of the skull or “cancelled” by the ions within the approximately 1350 cc of tissue that comprise the brain mass. We designed a series of simple experiments that demonstrate that there is no measureable loss of intensity of magnetic field strength when these fields are applied through material that is 3 times the density and thickness of the human skull. Here we present the results.
2. Method and Materials
Two 8.5 cm by 5 cm by 3.5 cm (SAM-360 device) plastic boxes each containing four, SPST-5DVDC reed relays (275-0332) rated 0.5 A at 125 VAC (RadioShack) and their circuitry were placed on a table in a large industrial acoustic chamber. Each reed relay, effectively a solenoid, also contained a small nail to enhance the field strength. Each box was connected to the same commutator unit. Each pair of solenoids (one from each box) was connected by a digital to analogue custom constructed converter such that any current would be presented to only one pair. A magnetic field was generated between this pair. A commutator circuit rotated the deliver of current so that each successive pair of the four pairs within the boxes was activated for 0.5 s. Consequently one complete spatial cycle was completed in 2 s. The circumference of the array of the 4 solenoids in each box was 21 cm.
The two boxes were separated by 20 cm. An AC milligauss meter Model UHS (AlphaLab, www.trifield.com, USA) was placed in the middle between the apposing surfaces of the two boxes so that the sensor was along the same horizontal plane as the center of the axis of the arrangement of the solenoids. The digital output, for all three spatial axes, of the power meter could be measured (in mG) directly from the meter. In addition the output from the meter was connected to a laptop where it was recorded and stored in real time. The pattern selected for generation was a frequency-modulated configuration that we have applied in many previous experiments and that is associated with analgesia in rodents [7] and marked alterations in cognitive states in human volunteers [8]. The pattern was generated by converting each of the 839 numbers between 0 and 256 (0 through 126 = negative polarity; 127 = 0, 128 through 256 = positive polarity) to some increment of equivalence between −5 to +5 V. Each point (voltage) was 3 ms, a value that has been associated with maximum biological effects [9].
In part one, two dried yellow pine boards (18 cm wide, 60 cm long and 2 cm thick) were slowly pushed between the surfaces of the two solenoid containers and the meter. They were separated by about 12 cm to simulate the separation of the two sides (width) of the skull. The changes in the peak intensities of the physiologically patterned field were recorded manually as well as continuously by laptop. The time required to move the wooden planks between the two boxes of solenoids so that there was at least 25 cm of wood on either side of the meter and 9 cm above or below the sensor in the meter was about 4 s where they remained for 30 s before being slowly removed in the same manner This was repeated several times on two different days.
In part two, sheets (30 cm by 30 cm by 2 mm-thick) of duct metal were moved between the two boxes and removed several times using the same procedure employed for the boards. Visual and lap-top measures were taken. A 9 V battery was attached to either or both sheets of metal while measurements were taken to answer the question that small d.c. currents could “block” the applied time-varying fields.
In part three, 500 cc plastic bottles were filled with either 155 mM of potassium chloride to simulate the major resting membrane potential differential for neuronal cells or physiological (isotonic) saline to imitate general ionic microcurrents and placed on either side of the power meter before and after several repeated measurements. This was tested to answer the criticism that the applied µT, time-varying magnetic fields would be “grounded out” by the ionic environment. A diagram displaying an artistic representation of the test apparatus of the experiment is depicted in Figure 1.
To discern the fidelity of the pattern the changes in output from the power meter were sampled at 333, 666, 1000, and 2000 times per second in order to allow some congruence with the intrinsic 3 ms duration of each point (the value between 0 and 256; between –5 and +5 V) that constituted the 839 points forming the frequency-modulated pattern. Spectra analysis was then completed by MATLAB software for each of the raw data samples when the pine, metal, and ionic solutions were inserted (extracted as WAV files from Audacity software). Correlations between the spectra were completed with SPSS software for Windows.
3. Results
As can be seen in Figure 2, direct visual measurements of peaks of the strength of the magnetic field (in mG) indicated there was no change in the intensity of the magnetic field within the central space that would be occupied by brain when two interfaces that exceed the density and width of the cranial bones by a factor of 3 were placed in manner to simulate the skull’s width. There was no change in the intensity of the magnetic field when plastic bottles of 500 cc of water containing
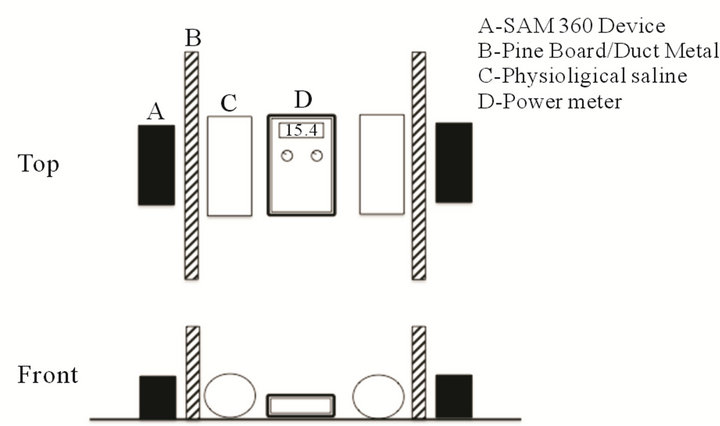
Figure 1. A schematic diagram of the testing apparatus for the experiment. Two wooden pine boards or duct metal were periodically inserted between the SAM-360 device and the power meter. In one condition physiological saline was placed adjacent to the power meter.
concentrations of ions to simulate the resting membrane potentials were placed between the source of the magnetic fields and the power meter. On the other hand insertion of sheets of a conductor, the 90 cm2 of duct metal between each box containing the solenoids and the power meter, reduced the strength of the magnetic field by about 25%. This attenuation can be seen in Figure 3. Application of 9 V across either metal plate to induce a “d.c. microcurrent” did not alter the change.
The results from the visual monitoring of the milligauss meter were similar to those of continuous real-time measurements at 250 samples per s. As shown in Figure 4, for the pine boards (or the pine boards with physiological saline in 500 cc plastic bottles between the sensor and the field-generating solenoids), there was no attenuation of the strength of the magnetic field. On the other hand the insertion of the duct metal quickly reduced the field strength as long as the metal was present.
The results of the most congruent spectra analysis are shown in Figure 5. Samples at 2000 per second which allowed the finest resolution showed a correlation of r = 0.78 between the spectra profile of the original points from which the field was generated and the actual field as measured by the power meter and recorded by the software on the lap top. The spectra profiles for the conditions are directly compared in Figure 6.

Figure 2. Peak intensity of physiologically-patterned magnetic fields generated between coupled solenoids through two wooden planks to simulate the thickness and density of the human skull. There was no attenuation of field strength.
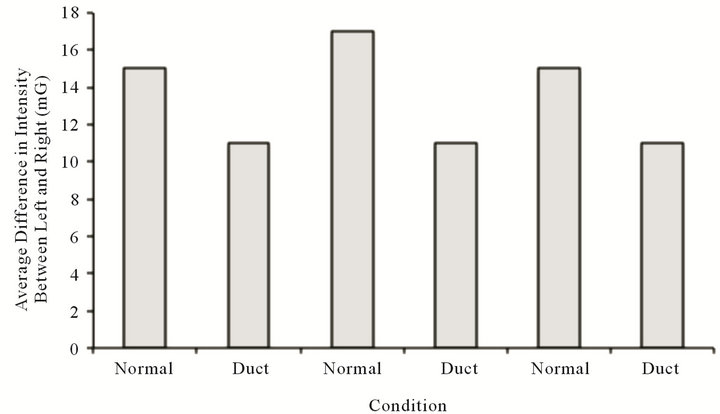
Figure 3. Peak intensities of the same physiologically patterned magnetic field strength generated between coupled solenoids through two layers of duct metal. There was still 75% penetrability.

Figure 4. Relative amplitude as measured by the software from direct input from the power meter demonstrating no change in amplitude when the pine boards (3 × the thickness and density of the human skull) were inserted or removed between the solenoids and the magnetic field sensor or when physiological saline in 500 cc bottles were added. Sections of duct metal however did reduce the intensity.
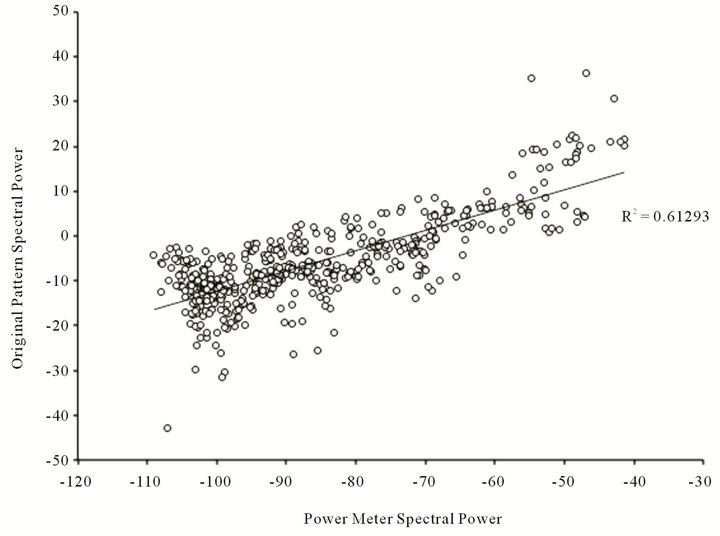
Figure 5. Scattergram of fractional Hz components across the spectra for the magnetic field induced within the power meter and recorded from its output by computer software.
4. Conclusion
The central differentiating procedure between Science and speculation is direct measurement. Although intuitive argument suggests “weak” magnetic fields cannot be
“strong enough” to penetrate the “thick” human skull, direct measurements of intensities demonstrated no attenuation of ~1 µT time-varying magnetic fields through materials that were three times thicker and three times denser than the bone matrix of the human skull. Even

Figure 6. Plots of the log transformation of the spectra for the original (from the computer program) physiologically-pattern “field” and the induced field after being generated through wooden or duct metal barriers and detected by the sensor of the milligauss meter.
relatively thick metal sheet only mildly attenuated penetrability. The fidelity of the pattern or “signal” was conserved, particularly the major spectra profiles, even though the magnetic field penetrated through metal or wood. We conclude that this particular geometry of application for physiologically-patterned or extremely low frequency, non-propagating magnetic fields penetrates the human skull and the brain tissue within its volume without appreciably loss of either intensity or configuration. Consequently, quantified values upon which previous calculations regarding the biophysical models that mediate the effects within brain tissue remain valid.
5. Acknowledgements
We thank Professor Blake Dotta for technical assistance. Special thanks to Professors Todd Murphy and Craig Aaen-Stockdale for positing critical questions.
REFERENCES
- H. E. Burke, “Handbook of Magnetic Phenomena,” Van Nostrand Reinhold Inc, New York, 1986.
- J. H. McElhaney, J. L. Fogle, J. W. Melvin, R. R. Haynes, V. L. Roberts and N. M. Alem, “Mechanical Properties of Cranial Bone,” Journal of Biomechanics, Vol. 3, No. 5, 1970, pp. 497-511. doi:10.1016/0021-9290(70)90059-X
- K. S. Saroka, B. P. Mulligan and M. A. Persinger, “Experimental Elicitation of an ‘Out-of-Body’ Experience and Concomitant Cross-Hemispheric Electroencephalographic Coherence,” Neuroquantology, Vol. 8, 2010, pp. 466-477.
- M. A. Persinger, K. S. Saroka, S. A. Koren and L. S. StPierre, “The Electromagnetic Induction of Mystical and Altered States within the Laboratory,” Journal of Consciousness and Research, Vol. 1, 2010, pp. 808-830.
- K. S. Saroka and M. A. Persinger, “Detection of Electromagnetic Equivalents of the Emotional Characteristics of Words: Implications for the Electronic-Listening Generation,” Open Behavioral Sciences Journal, Vol. 5, 2011, pp. 24-27. doi:10.2174/1874230001105010024
- C. Aaen-Stockdale, “The Neuroscience of the Soul,” Journal of the Psychologist, Vol. 25, 2012, pp. 520-523.
- L. J. Martin, S. A. Koren and M. A. Persinger, “Thermal Analgesic Effects from Weak, Complex Magnetic Fields and Pharmacological Interactions,” Pharmacology, Biochemistry and Behavior, Vol. 78, No. 2, 2004, pp. 217- 227. doi:10.1016/j.pbb.2004.03.016
- L. S. St-Pierre and M. A. Persinger, “Experimental Facilitation of the Sensed Presence Is Predicted by Specific Patterns of Applied Magnetic Fields Not by Suggestibility: Re-Analyses of 19 Experiments,” International Journal of Neuroscience, Vol. 116, 2006, pp. 1-18.
- B. T. Dotta and M. A. Persinger, “‘Doubling’ of Local Photon Emissions When Two Simultaneous, SpatiallySeparated, Chemiluminescent Reactions Share the Same Magnetic Field Configurations,” Journal of Biophysical Chemistry, Vol. 3, No. 1, 2012, pp. 72-80. doi:10.4236/jbpc.2012.31009