Journal of Electromagnetic Analysis and Applications
Vol.4 No.9(2012), Article ID:22475,4 pages DOI:10.4236/jemaa.2012.49050
Effect of Cavity Dimensions on TE01δ Mode Resonance in Split-Post Dielectric Resonator Techniques
![]()
1Electrical and Computer Engineering Department, Michigan Technological University, Houghton, USA; 2Materials Research Institute, The Pennsylvania State University, University Park, USA.
Email: esemouch@mtu.edu
Received July 8th, 2012; revised August 7th, 2012; accepted August 17th, 2012
Keywords: Split Post-Dielectric Resonator; TE01δ Mode; Cavity Dimensions
ABSTRACT
The effects of cavity dimensions on the resonance frequency and resonance strength of the TE01δ mode in split postdielectric resonator (SPDR) technique are investigated by using full-wave simulations. The results of simulations provide guidance for adjusting the dimensional parameters of the set-up to ensure that a strong TE01δ resonance mode is excited. The scaled designs of SPDR fixtures for operation at frequencies that are most important for applications are presented. These designs employ two sets of dielectric resonators (DRs) that can be fabricated from the standard ceramic materials. In addition, it is demonstrated that the resonance frequency of the TE01δ mode in the fixture can be tuned by adjusting the gap of the split DR.
1. Introduction
The split-post dielectric resonator (SPDR) provides an accurate technique for the measurement of the complex permittivity of low loss dielectric materials, thin films and wideband gap semiconductors that are difficult to measure by other techniques [1-3]. SPDR typically operates at the TE01δ mode that restricts the electric field component to the azimuthal direction so that the electric field remains continuous on the dielectric interfaces. The resonance mode is insensitive to the presence of air gaps perpendicular to the longitudinal axis of the fixture [4,5]. The real part of the permittivity of the sample is determined from the resonance frequency shift due to the sample insertion gap of the split post. The loss tangent can be found from the Q factors of an empty cavity and a cavity with the sample, respectively.
SPDR technique originates from the resonant post technique for measurements microwave permittivity of a cylindrical dielectric sample, which is based on excitation of a well-defined TE011 mode by means of metal plates on each end of the dielectric cylinder [6]. The dielectric loss is determined by subtracting the conduction Q of the metal boundaries from the measured Q for the TE011 resonance mode [7]. For high Q dielectrics, the metal boundary loss is a significant fraction of the measured loss so that the resonant post technique cannot be used. High Q dielectric resonators are suspended on a quartz rod in the center of a metal cavity to minimize radiation and conduction loss and the TE01δ instead of the TE011 mode is used [8,9]. The concepts from the monolithic dielectric resonator measurements were applied to the SPDR technique [5,6].
In this paper, the effect of cavity dimensions on the TE01δ resonance formation is investigated and the importance of having an appropriate cavity size, in order to accentuate the desired resonance mode in the measurements, in demonstrated.
2. Cavity Dimensions Effect on Resonance Formation
For an isolated dielectric cylinder, the resonant frequency of the TE01δ mode is completely defined by the relative permittivity εr of the material and the dimensions of the resonator. An empirical estimation of the resonant frequency fr for the TE01δ mode of an isolated dielectric cylinder in free space is given by [9]:
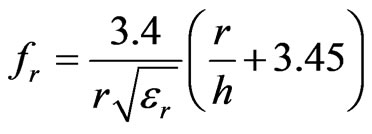 (1)
(1)
where, r is the radius in mm, h is the height of the cylinder, and fr is in the GHz units. As seen from Figure 1, the SPDR is a circular cylindrical dielectric resonator that is separated into two halves by an air gap, which modifies the resonant frequency given in Equation (1). A sample is placed in the gap, and coupling loop is used to excite and detect the TE01δ resonance. From measurements of the resonance frequency and quality factor, the relative permittivity and loss tangent of the sample can be determined. The SPDR fixture is shielded by a metal enclosure, which contains strong evanescent electromagnetic waves not only in the air gap region between the dielectric resonators, but also in the entire cavity region for radii greater than the radius of dielectric resonators. Cavity enclosed by the metal complicates the resonance formation.
In order to investigate the effect of cavity dimensions on the resonance strength, the SPDR fixture shown in Figure 1 has been modeled and simulated by using the CST Microwave Studio commercial software package for two sets of cavity dimensions and the same DR configuration. The two DR halves have the relative permittivity εd of 34.4, the diameter dr of 25.4 mm, the height hr of 5.7 mm, and the gap distance hg is 1.3 mm. For the cavity set 1, its diameter is D = 76.3 mm, the height is L = 63.6 mm, while for the set 2 these parameters are D = 50 mm and L = 30 mm, respectively.
Cavity set 1 is an example of a design that does not provide a prominent mode peak due to large cavity size. Figure 2(a) presents the simulated S21 spectrum for the structure, which exhibits several resonance peaks. From
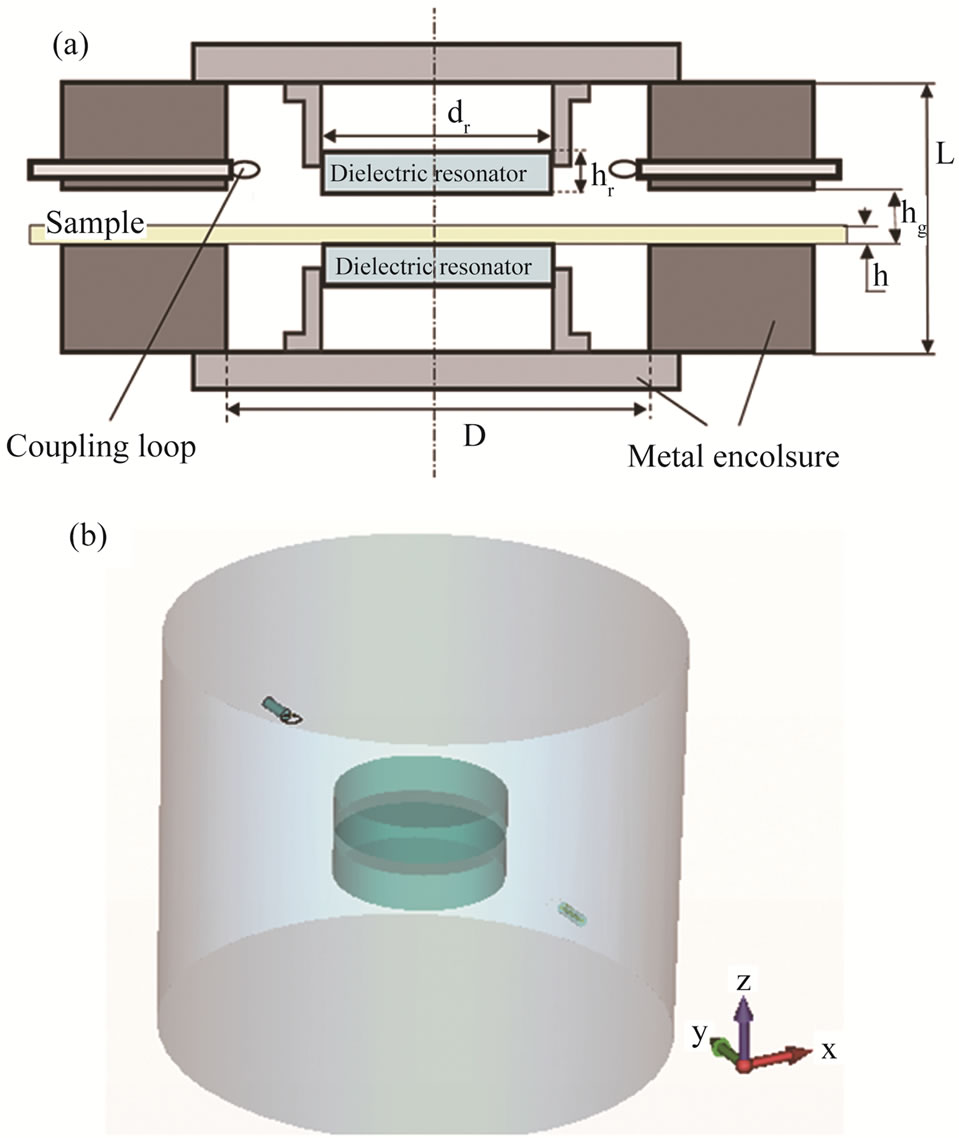
Figure 1. (a) Schematic diagram of a SPDR fixture; (b) CST simulation model of the SPDR without a sample. Parameters of the two DR halves: relative permittivity εd = 34.4, diameter dr = 25.4 mm, height hr = 5.7 mm, gap distance hg = 1.3 mm.
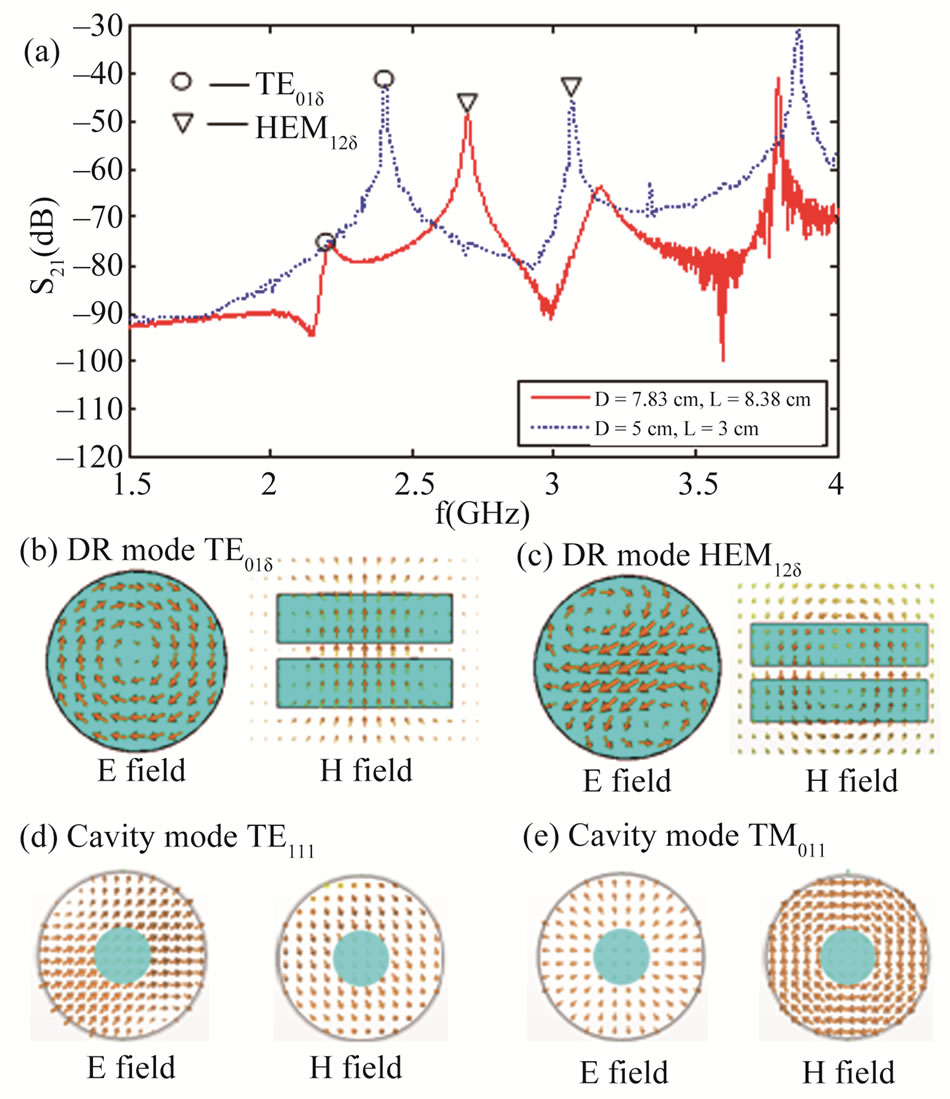
Figure 2. (a) Simulated S21 for a SPDR fixture for cavity set 1: D = 76.3 mm, L = 63.6 mm (in solid curve) and cavity set 2: D = 50 mm, L = 30 mm (in dotted curve); (b)-(c) Electric field distributions in the median x-y cross-section of the DR and magnetic field distributions at y-z plane of the DRs for: (b) the TE01δ mode at 2.21 GHz for the cavity set 1 and at 2.40 GHz for the cavity set 2 and (c) the HEM12δ mode at 2.70 GHz for the cavity set 1 and at 3.07 GHz for the cavity set 2; (d)-(e) Electric and magnetic field distributions in x-y plane in the cavity for cavity eigenmodes TE111 and TM011, respectively.
the analysis of field distributions in the resonator at the peak frequencies, which are shown in Figures 2(b)-(c), it was found that the first resonance corresponds to the TE01δ mode, while the second one to the HEM12δ. For the third and the fourth observed resonances, respectively, it was detected that they could not be related to a resonance in the DR; instead, they were found to coincide with the cavity eigenmodes at the frequencies 3.29 GHz for TE111 mode and 3.82 GHz for TM011 mode, respectively (see Figures 2(d) and (e)). The TE01δ, which is employed in the SPDR technique, is observed in two DRs separated by hg at 2.21 GHz, however, the resonance is very weak, with S21 being at the level of –75.7 dB. The weakness of the TE01δ mode could play a misleading role so that the second much stronger HEM12δ resonance mode could be easily taken as being the first resonance in the experimental measurements. Cavity set 2 is an example of an appropriate design with the correctly chosen diameter and height. As seen in Figure 2(a), though the same resonance modes are excited in both cavity sets, the TE01δ resonance is much stronger in the cavity set 2 than in the cavity set 1.
It should be noted that the observed results are in agreement with the cavity perturbation theory [8]. According to this theory, the resonant frequency of a DR is expected to increase when the metal enclosure moves towards the DR, when the displaced magnetic energy is predominant; vice versa, it is expected to decrease when the electric energy is dominant. Therefore, in the case of a DR operating at TE01δ mode, the resonant frequency should increase as metal wall moves closer to the DRs. By comparing the curves in Figure 2(a), it is seen that a reduction in the cavity dimension results in an increase of the resonant frequencies. For the first TE01δ mode, the resonant frequency shifts from 2.21 GHz to 2.40 GHz. In addition, the resonance strength is greatly improved for the first mode TE01δ in the cavity set 2, i.e. S21 increases by about 40 dB.
The results of the performed studies assist in formulating recommendations for the designing SPDR fixtures for operation at the desired frequencies. As shown in Figure 3(a), the resonant frequency of SPDR decreases by 0.11 GHz and the S21 parameter decreases by 35 dB, when the diameter of metal cavity is increased from 4 cm to 8 cm. Figure 3(b) demonstrates that when the height of metal cavity increases from 3 cm to 7 cm, the resonant frequency decreases by 0.08 GHz, while the S21 changes only slightly, i.e. by about 3 dB. Therefore, the cavity diameter produces the dominants effect on the resonance strength of the fixture, while the cavity height only causes the frequency shift. At the same time, there is a limit to which the cavity diameter could be decreased in order to strengthen the resonance, since it was found that when the probes get too close to the DRs, they distort the DR mode so that the TE01δ resonance could not be excited.
3. SPDR Fixture Scaling for Operation at Different Frequencies
The SPDR fixture presented above as the cavity set 2 has been designed to operate at the frequency of 2.40 GHz, where the relative dielectric permittivity of the DR was 34.4. The design originally proposed in [5] was for operation at 5.60 GHz and used the DR permittivity of 28.9. To scale the SPDR fixture for operation at other frequencies important for practical applications based on the two original designs, the scale factors and fixture dimensions have been determined. Since the gap between the two DRs can be easily adjusted during the measurements, the effect of gap scaling has also been investigated. COMSOL Multiphysics simulation package [10] was used in the simulations of the re-scaled designs. Table 1 and Table 2 summarize the parameters of the SPDR fixtures that should be used for different operating frequencies with the DR having the relative permittivity of 34.4 and 28.9, respectively.
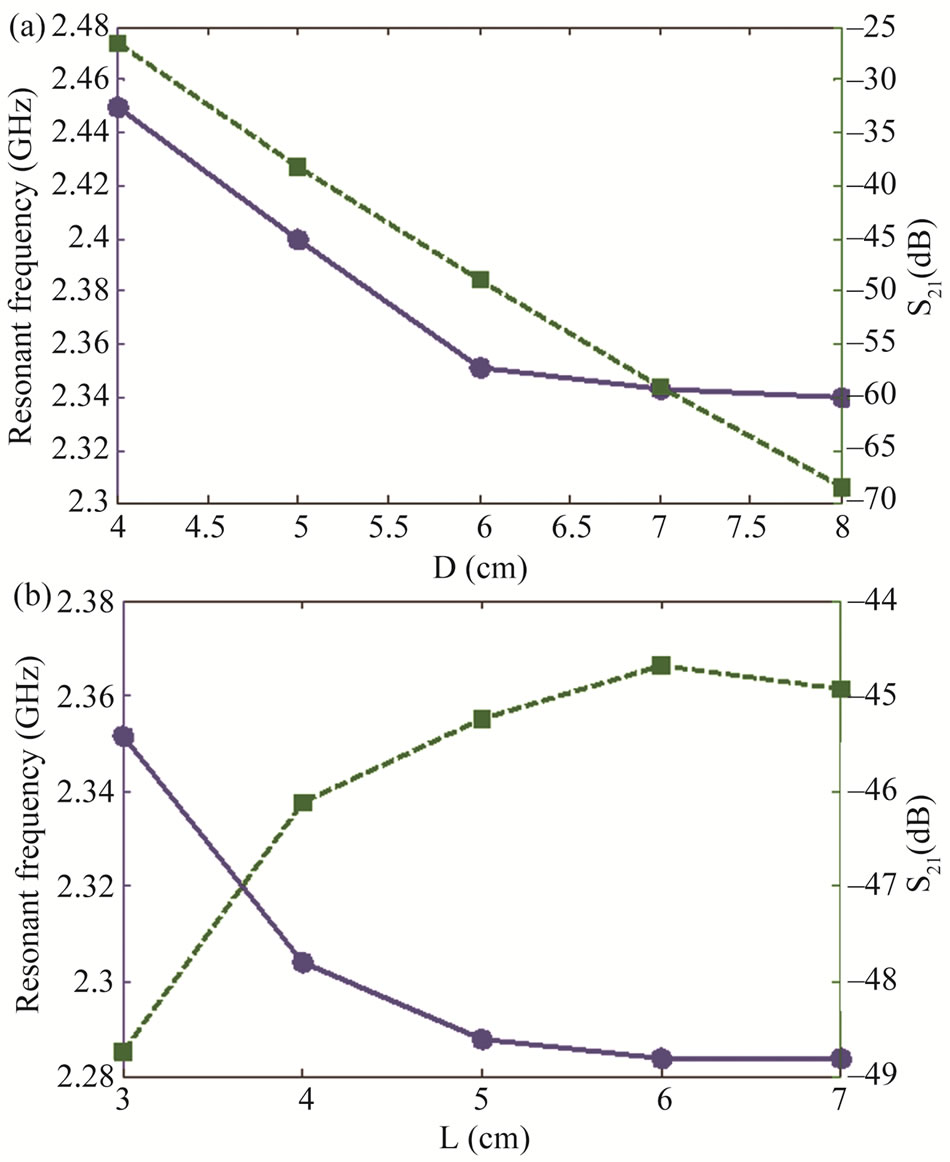
Figure 3. Dependence of the resonant frequency and S21 amplitude at the resonance on (a) the cavity diameter (the cavity height L is fixed at 3 cm) and (b) the cavity height (the cavity diameter is fixed at 6 cm).
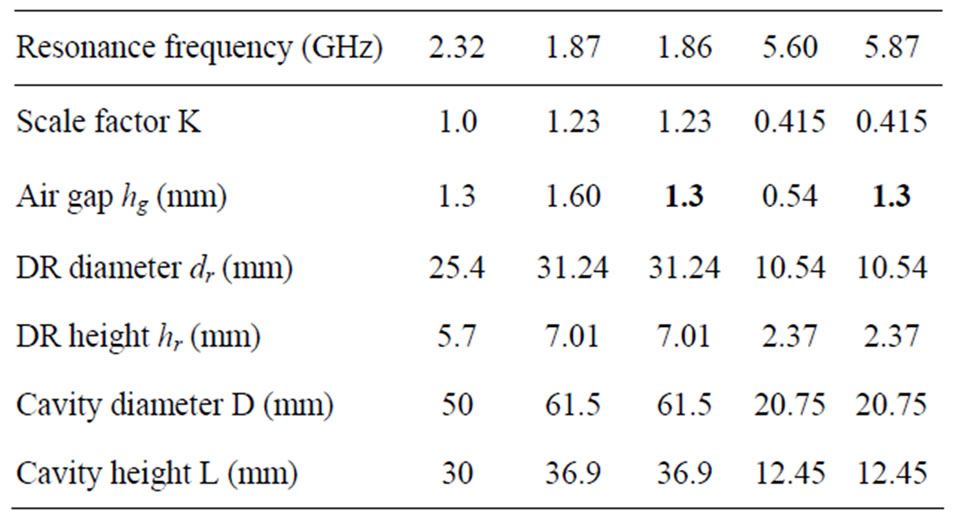
Table 1. SPDR fixture parameters for TE01δ resonance for different frequencies (εd = 34.4).

Table 2. SPDR fixture parameters for TE01δ resonance for different frequencies (εd = 28.9).
As seen from the tables, the scale factor for the resonance frequency of the TE01δ mode should be directly applied to scale the cavity size. From the comparison of two designs with the same scale factor, however, having the gap distance hg either scaled or not scaled (grey cells in the table), it could be noted that a smaller gap decreases the resonance frequency; while a bigger gap leads to a higher resonance frequency so that this frequency change could be as big as 0.26 GHz. Therefore, in practice, the frequency of the fabricated SPDR could be tuned to the desired frequency by simply adjusting the gap size.
4. Conclusion
It is demonstrated through full-wave electromagnetic simulations that the size of the cavity used in the SPDR technique to shield the dielectric resonator strongly influences the resonance frequency and the strength of the desired TE01δ mode, so that the latter could be completely suppressed. Therefore, it is necessary to adjust cavity dimensions to the parameters of the dielectric resonators used in the fixture. The design parameters of SPDR fixtures providing proper operation at various frequencies important for the applications are presented. In addition, it was found that the frequency of the fixture operation can be fine tuned by adjusting the gap of the split resonator.
5. Acknowledgements
This work was supported by the National Science Foundation under Grant No. 0968850.
REFERENCES
- J. Baker-Jarvis, R. G. Geyer, J. H.Grosvenor, M. D. Janezic, C. A. Jones, B. Riddle, C. M. Weil and J. Krupka, “Dielectric Characterization of Low-loss Materials a Comparison of Techniques,” IEEE Transactions on Dielectrics and Electrical Insulation, Vol. 5, No. 4, 1998, pp. 571-577. doi:10.1109/94.708274
- J. Sheen, “Study of Microwave Dielectric Properties Measurements by Various Resonance Techniques,” Measurement, Vol. 37, No. 2, 2005, pp. 123-130. doi:10.1016/j.measurement.2004.11.006
- J. Sheen, “Comparisons of Microwave Dielectric Property Measurements by Transmission/Reflection Techniques and Resonance Techniques,” Measurement Science and Technology, Vol. 20, No. 4, 2009, Article ID: 042001. doi:10.1088/0957-0233/20/4/042001
- J. Krupka, A. P. Gregory, O. C. Rochard, R. N. Clarke, B. Riddle and J. Baker-Jarvis, “Uncertainty of Complex Permittivity Measurements by Split-post Dielectric Resonator Technique,” Journal of the European Ceramic Society, Vol. 21, No. 15, 2001, pp. 2673-2676. doi:10.1016/S0955-2219(01)00343-0
- J. Krupka, R. G. Geyer, J. Baker-Jarvis and J. Ceremuga, “Measurements of the Complex Permittivity of Microwave Circuit Board Substrates Using Split Dielectric Resonator and Resonant Cavity Techniques,” 7th International Conference on Dielectric Materials, Measurements and Applications, Bath, 23-26 September 1996, pp. 21-24. doi:10.1049/cp:19960982
- B. W. Hakki and P. D. Coleman, “A Dielectric Resonator Method of Measuring Inductive Capacities in the Millimeter Range,” IEEE Transactions on Microwave Theory Technique, Vol. 8, No. 4, 1960, pp. 402-410. doi:10.1109/TMTT.1960.1124749
- Y. Kobayashi and M. Katoh, “Microwave Measurement of Dielectric Properties of Low-loss Materials by the Dielectric Rod Resonator Method,” IEEE Transactions on Microwave Theory Technique, Vol. 33, No. 7, 1985, pp. 586-592. doi:10.1109/TMTT.1985.1133033
- D. C. Dube, R. Zurmuhlen, A. Bell, N. Setter and W. Wersing, “Dielectric Measurements on High Q Ceramics in the Microwave Region,” Journal of the American Ceramic Society, Vol. 80, No. 5, 1997, pp.1095-1100. doi:10.1111/j.1151-2916.1997.tb02951.x
- D. Kajfez and P. Guillion, “Dielectric Resonators,” Artech House, Norwood, 1986, pp. 327-376.
- http://www.comsol.com/products/multiphysics/