Journal of Electromagnetic Analysis and Applications
Vol. 2 No. 4 (2010) , Article ID: 1676 , 8 pages DOI:10.4236/jemaa.2010.24030
Utilization of Energy Capacitor Systems in Power Distribution Networks with Renewable Energy Sources
![]()
Computer Science and Electrical Engineering Department, Kumamoto University, Kumamoto, Japan.
Email: Yaser_qudaih@yahoo.com
Received December18th, 2009; revised February 11th, 2010; accepted February15th, 2010.
Keywords: Energy capacitor system, Load following operation, Multi agents, Distributed Generation
ABSTRACT
The impact of power fluctuation caused by renewable sources is highly negative. This article discusses the idea of an energy capacitor system (ECS) which regulates the power balance in a distribution system based on Multi-Agent System (MAS). Energy Capacitor system as a storage device plays the main role to control the system’s power quality by absorbing the fluctuations. Load Following Operation (LFO) process and coordination control scheme between the ECS and diesel generator have been introduced. Results show the efficient utilization of the ECS based on a special index defined in this paper to evaluate the power fluctuations in the distribution system. The results also show the useful implementation of the control scheme by revealing the capability of keeping the ECS stored energy in the specified range.
1. Introduction
Utilization of Distributed Generation to power distribution system has been rabidly increased. Such a technology has been presented strongly in the top of many researches in the field of power system [1,2]. However, deregulation of electrical utilities, environmental concerns and globalization could be the main reasons behind such phenomena. Using small and clean distributed power sources, such as photovoltaic, wind energy, fuel cells and energy capacitor devices, became a vital need to withstand the burdens of technological race. Providing an integrated performance and flexibility of the power system, is an urgent need to be implemented especially in the presence of uncontrollable and environmentally dependant power sources.
Previous studies explained the situation when dealing with distribution systems in the presence of distributed generation [3-5]. Optimum sizing and placement is one of the most important aspect regarding to dispersed sources [3]. Acharia et al. discussed analytically the allocation of distributed generation in primary distribution network [4], others achieved to find the optimal allocation for reliability, losses, and voltage improvement [5], and others discussed about the distributed generation contribution to primary frequency control [6]. It is however, the impact of distributed generation makes the system very sensitive to perturbations.
In this paper, the ECS as a new technology of energy saving is proposed to be utilized in power distribution system. Thus, many other applications of the capacitors and ultra capacitors have been reviewed in order to make the study more comprehensive. Okamura [7] introduced the ECS in a basic study; however, overall characteristics have been discussed. It has been noticed that ECS applications are rapidly increased such as [8-11].
In this work, the control scheme based on the coordination between the ECS and the DG, as controllable devices, has been proposed together with multi-agents and computer network utilization which is widely used application. The influence of the computer network failure has been checked and treated in proper way. PI and PID controllers have been used to solve the problem of ECS size limitation and to complete the coordination process. A long process of parameters and gains tuning has been hold based on trial and error methodology. Yet, further studies in the control strategies are ongoing, such as [12], where intelligent controllers, namely fuzzy logic switching have been utilized.
Medium tension Power distribution system as a very important and sensitive part of the total power system, which links the transmission and consumers, also supplies many industries and other vital parts and utilities, has been discussed. Table 1 shows the 30-bus 12.66 kV power distribution system data [13]. Unlike many other cases such as in [14-15], the study in this work and the related simulations have discussed more details of the distributed generation effect via using dynamic models of the DG and the WTG.
2. Model Description
Figure 1 shows the Single line diagram of the target system also the main diagram of the Matlab/Simulink representation. In the single line diagram, dotted lines are representing tie lines. However, the simulation has been made with all tie lines open to represent the base case according to [12].
The dispersed sources added to the system are DG, WTG and PV including the ECS as a storage device, such a model can be considered as a flexible tool to implement several applications to the distribution system such as reconfiguration [16] and distributed generation allocation [17]. The mathematical expressions of using the components in the distribution system are expressed by the concept of connecting any device to the distribution network. In our case the three phase voltage from the distribution system is used as an input and the output will be the current injected to the system. That can be explained as follow:

where, V = [va, vb, vc]T and I = [ia, ib, ic]T;
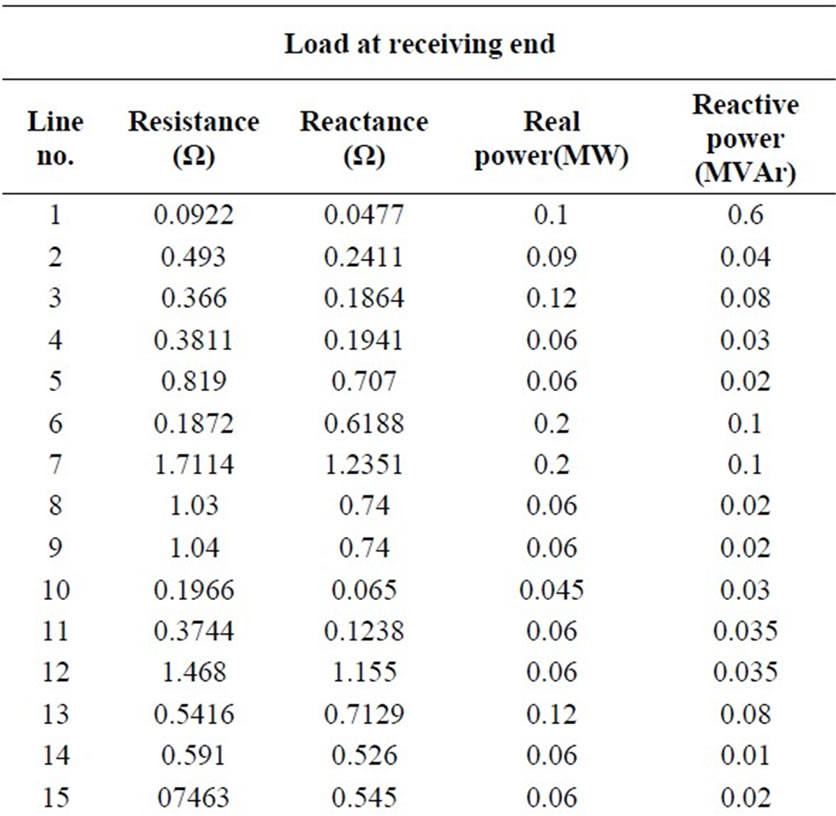
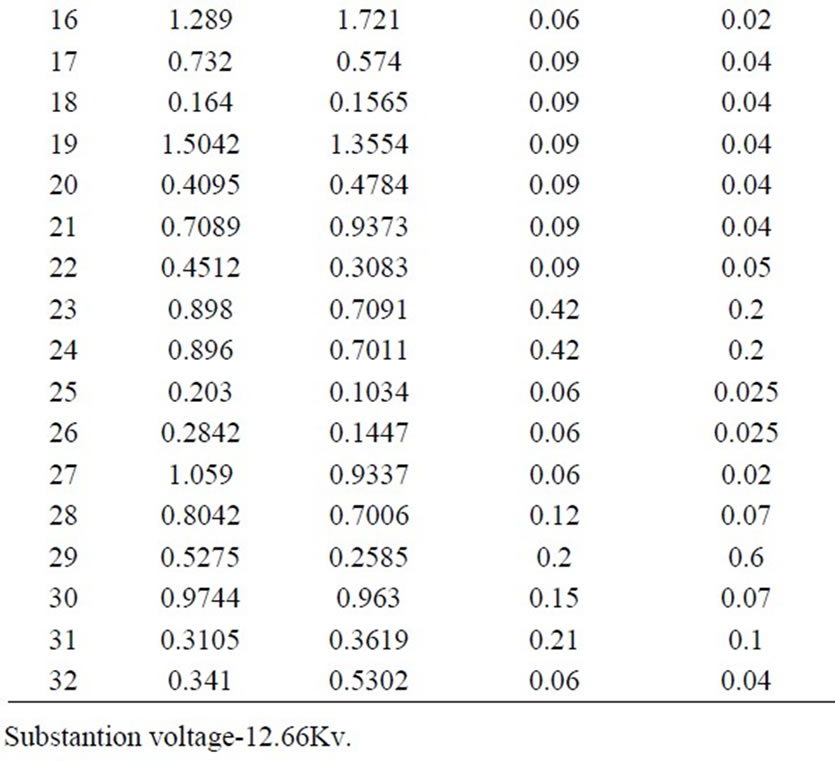
Table 1. The 33-bus distribution system data
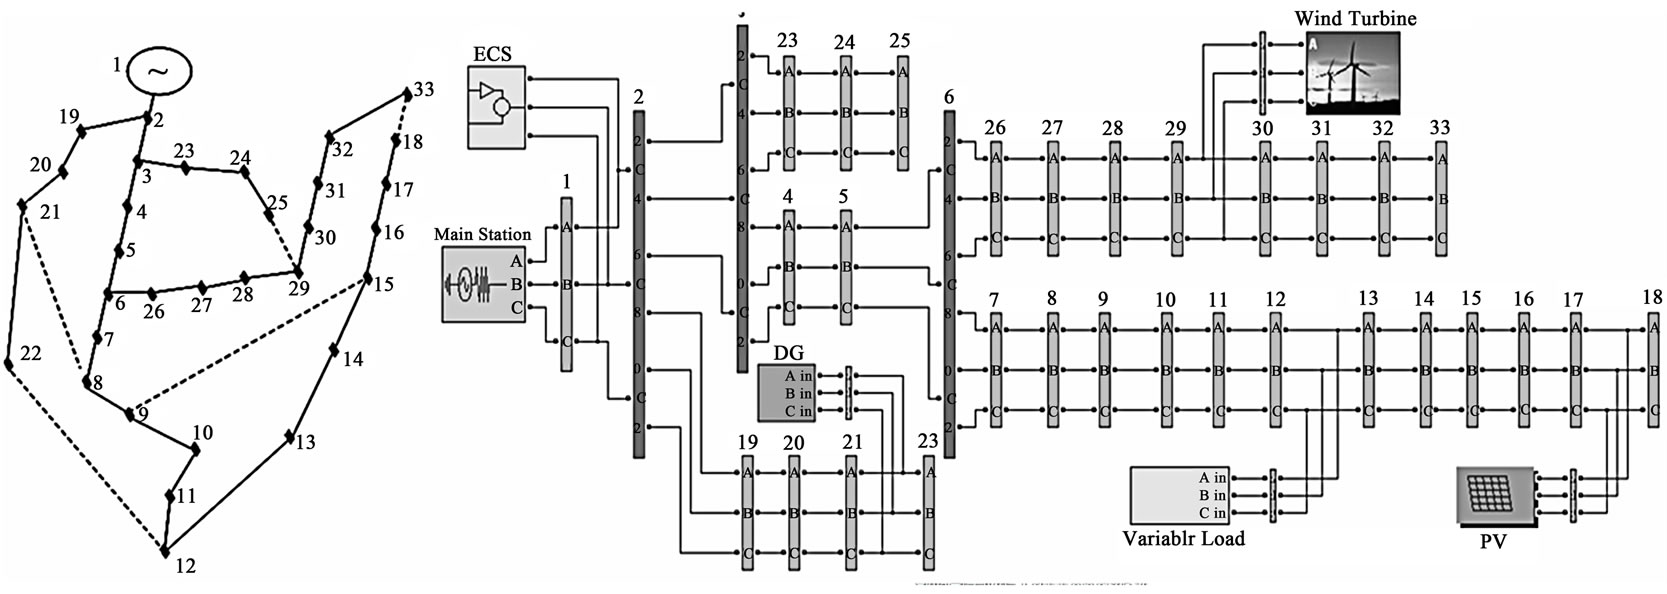
Figure 1. Single line diagram and Matlab/Simulink model representation of the distribution system
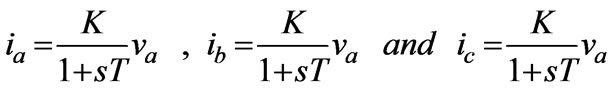
In case of PV the factor K is always +ve (K > 0).
In case of variable Load, factor K is always -ve (K < 0).
In case of ECS, the factor K can be controlled to determine the charging/discharging operation of the ECS as If K > 0 represents Discharging operation and if K < 0 represents Charging operation.
The elements of the model are further explained as follow:
2.1 DG Model
Synchronous machine per-unit standard (pu), 5000 kW maximum rated power, 60 Hz and 12.66 kV dynamical model has been used. The configuration of the mathematical expression used to model the synchronous generator is shown in Figure 2.
Where Pto is the mechanical input to the generator, Pe is the electrical output of the generator, δ is the phase difference angle, H is the inertia constant and D is the damping coefficient. The Matlab/Simulink block diagram of the synchronous generator together with the governing system is shown in Figure 3. Where Pm is the Mechanical power at the machine's shaft and Vf is the field voltage.
2.2. WTG model
In the literature, several studies have been reported regarding wind turbines and wind power driven generators [18]. The model proposed in this paper is a squirrel cage induction generator based of the wind speed versus wind turbine output power characteristics. The power extracted from wind is given by the following Equation
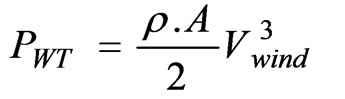 (1)
(1)
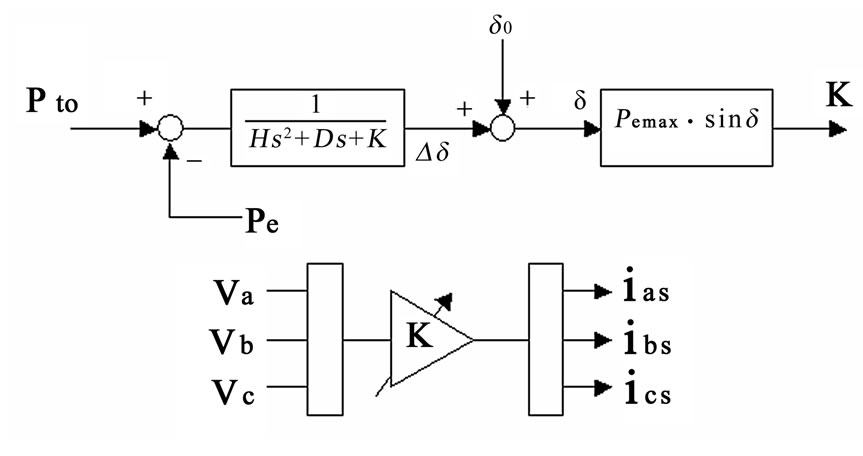
Figure 2. Mathematical model of the synchronous generator
where; ρ : Air density, kg /m3 A: Turbine swept area, m2 and Vwind : Wind speed, m/s.
Mathematical relation for mechanical power extraction form the WTG can be expressed as follows [19,20].
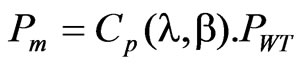 (2)
(2)
where; λ : Tip speed ratio, β : Blade pitch angle, Degree. Cp(λ,β): Performance coefficient of the turbine.
The coefficient of performance is not constant, but varies with tip speed ratio; l. A generic equation is used to model Cp as shown in the following equation:
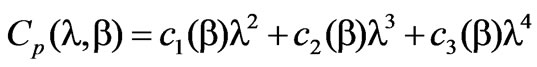 (3)
(3)
This equation, based on the wind turbine characteristics and the coefficients c1, c2 and c3 are determined according to Simulink model of the wind turbine which has been modified as phasor type induction generator. The tip speed ratio can be obtained from the following equation:
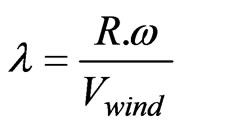 (4)
(4)
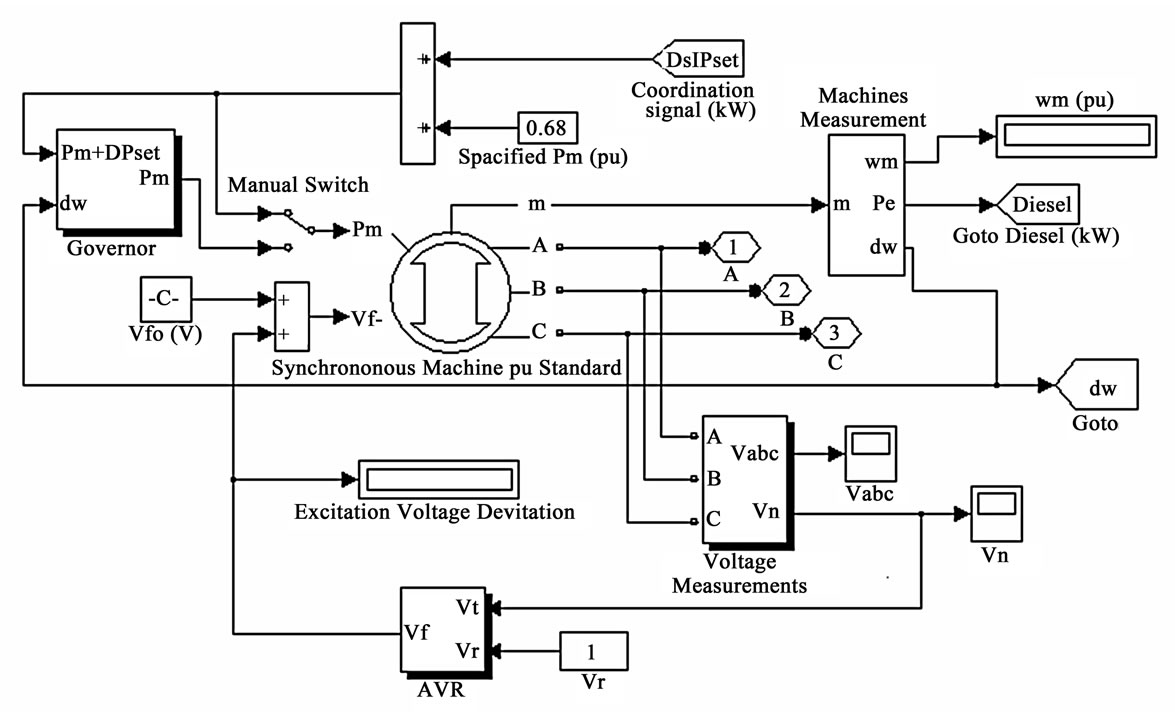
Figure 3. Matlab block diagram of the DG connections
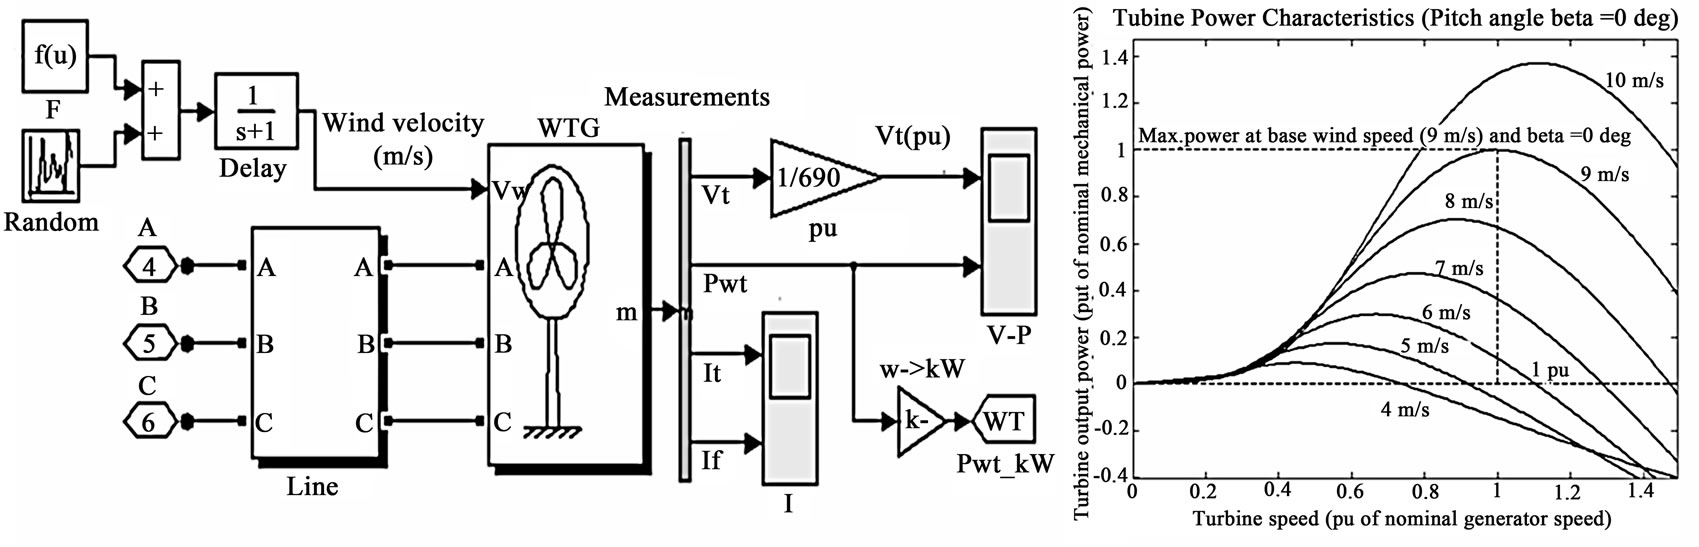
Figure 4. Matlab/Simulink representation of connecting the wind turbine model (to the left) and power characteristics of the WTG (to the right)
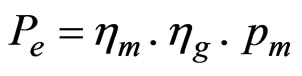
where, R is radius of the wind turbine and ω is the wind turbine rotation speed. The electrical power generated by the WTG was defined as follows
 (5)
(5)
where; hm: Mechanical efficiency. hg: Generator efficiency.
For this paper, three phase instantaneous dynamical model has been constructed. Figure 4 illustrates the Simulink block diagram of connecting the wind turbine to the system. It also shows the power characteristics of the wind turbine generator. The power characteristics diagram indicates that the model is an induction fixed speed wind generator based on Equations (1) to (5).
2.3 PV System Model
To represent the fluctuations caused by PV technology and according to the way the network has been constructed, a simplified mathematical model based on transfer function has been used, also for the sake of simplicity, the PV model has been made considering the AC side of the PV model. Meanwhile, random variations to model the insolation have been considered with suitable gains and time delay, using Matlab/Simulink. Three phase voltages taken from the line data transferred to the three phase currents injected to the network. Then the power is calculated by multiplying voltage and current as shown in Figure 5.

Figure 5. Mathmatical expression of PV model
2.4 ECS Model
Energy Capacitor System (ECS) consists of capacitors and power electronics. It is used as an energy storage system. The capacitor part of the ECS is a group of electric double layer capacitors of increased energy density. The AC side of the three-phase instantaneous model is considered in this paper. Similar model of the PV system has been considered with controlled factor K. Charging and discharging operation of the ECS is utilized for LFO control. Figure 6 shows the charging and discharging operation concept with the limitations of having fully charged or fully discharged conditions. Keeping thecharging/discharging operation in the specified range vitally depends on the DG support and using the suitable controllers. The charging and discharging level of the ECS was specified from 0.5 kWh to 2.5 kWh in this work.
2.5 Variable Load Model
Although the fluctuations in power caused by the PV system and by the WTG are enough to cause the perturbations required to check the ECS efficiency, a variable load has been considered to make the system more realistic. The same model explained earlier in Section 2 has been used as simplified model of current injection with negative factor K. Ramp changes in the load have been considered during the simulation as shown in Figure 7. However, random, periodical and step changes in the variable load have been also checked giving the same result but, ramp changes in the variable load could be more realistic according to the time scale used in this paper. Also, ramp changes in the load are more severe to check the efficiency of the saving device (ECS) and the success of the control scheme in coordinating between the diesel Generator and the ECS.
3. Working Criteria
As the system is connected to infinite bus and because of the renewable energy sources that scattered around, the big concern is about keeping the power delivered from
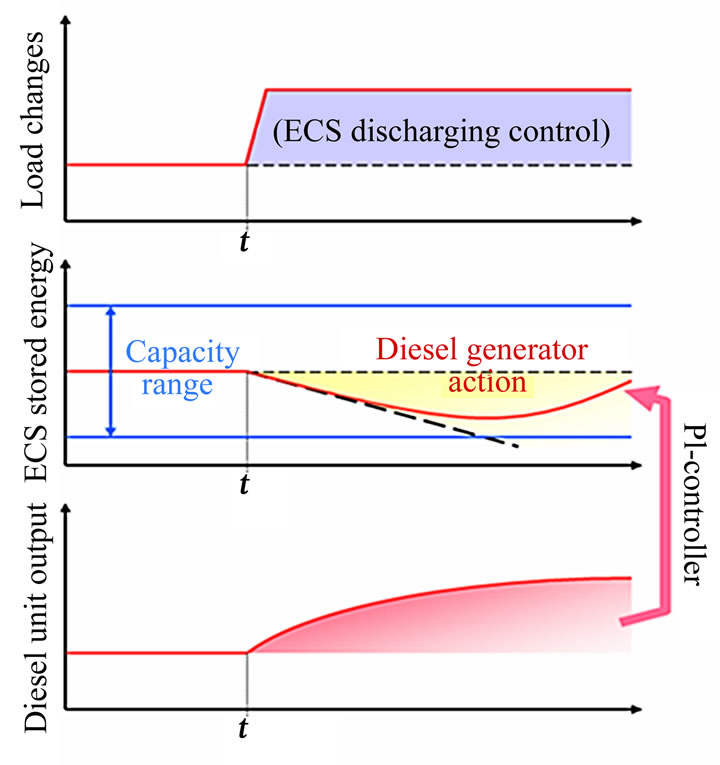
Figure 6. ECS charging/discharging operation concept
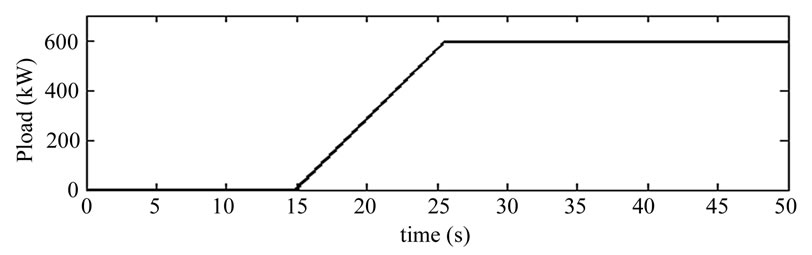
Figure 7. Ramp variable load
the upper system as much as regulated as possible. It should be regulated, to satisfy the consumer’s demand of good quality of power and to overcome the consequences of power fluctuations. Thus LFO is considered as follow:
3.1 Load Following Operation
With utilizing ECS, multi-agents based LFO of two levels, global and local, are performed to keep the real power supplied from the upper system regulated. The multi-agents system is a computer network consists of several personal computers called agents, are responsible about sending and receiving data among each others to perform the control strategy and provide the coordination scheme between elements of the system, namely the ECS and the DG. Those agents are divided into three parts:
• Monitoring agent has the mission of measuring the data required from one part of the system and supply it through the computer network to the supervisor agent.
• Supervisor agent plays the mission of coordination among the controllable devices in the system, it is obviously provided with the suitable algorithm and control strategy in order to send the required data to the control agent.
• Control agent has the mission of applying the control signal via sending it to the desired equipment which is the DG in this case. DG will act according to the control value to support the ECS which is small in size but fast in charging and discharging.
Figure 8 shows the utilization of multi-agents and computer network, where the data files X and Y prepared at the monitoring agent which is PC1. Hard drives F and G of PC2 and PC3 receive data from PC1 respectively (PC2 is the supervisor agent and PC3 is the control agent). After that, PC2 inputs the data X received from PC1 and prepare the data file Z to be sent to PC3. PC3 reads the data file Z and prepare the control action.
A small scale computer network (LAN) has been constructed at the laboratory to evaluate MAS utilization. In addition, analogue simulations have been performed with real time simulator which is available at Kyushu Power Company-Japan.
Analogue to digital convertor A/D and digital to analogue converter D/A including Digital signal processing board DSP are used to perform the multi-agent based control action. Figure 9 shows a part of the analogue simulation process.
3.2 Global Control
Global control or upper level control is performed when
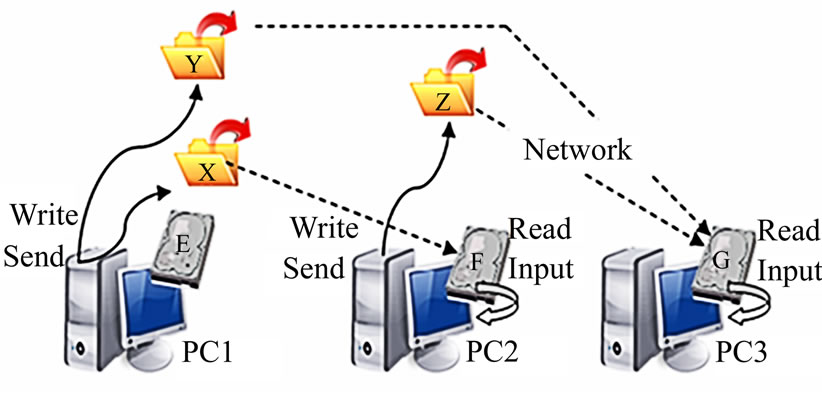
Figure 8. Multi-agents and computer network utilization

Figure 9. Analogue simulator interfacing process
computer network is available and able to communicate between the ECS and the DG whom are controllable devices. These two devices can be efficiently coordinate to overcome the fluctuations in power caused by the WTG and the PV system. In case of the global control the DG receives the required signal from the ECS through the agents to absorb the fluctuations. The ECS itself has unique characteristics and can compensate any lack in power or absorb any higher generation, through the fast charging and discharging operation. However, the limited size of the ECS causes a constraint which be avoided by getting the support of the DG. As the ECS and the DG are not at the same location, MAS has been utilized.
3.3 Local Control
This case happens when the computer network fails down due to any reason, in other words, the DG and the ECS system are not coordinated during this period of time. The performance of the energy capacitor system is clearly degraded and the DG cannot perform the LFO itself. Another technique has been used in this situation by modifying the target power to a certain accepted value to improve the performance of the ECS. The local information in the location of the ECS has been implemented. That is called the lower or local control.
4. Results and Discussion
Based on trial and error methodology, the parameters of the PI controllers have been tuned until the optimum values obtained. Table 2 exposes the tuned parameters according different strategies.
Figures 10-12 illustrate the results according to those strategies. In a comparison between the three graphs, from Figure 10 the ECS is not in service and no control action is performed which results in a very fluctuated and distorted power delivery from the upper system. Next graph, Figure 11 illustrates the global control condition where both the DG and the ECS are coordinated with each others, which results in a high level of regulated real power. The last graph Figure 12 shows the local control where the DG is not supporting the ECS due to computer network failure. The power from the upper system has been modified in this case to maintain the saved energy of the ECS in the required specified level. Comparing the
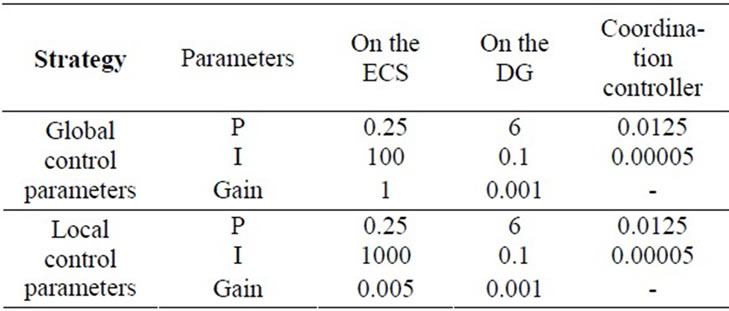
Table 2. Controller tuned parameters for LFO
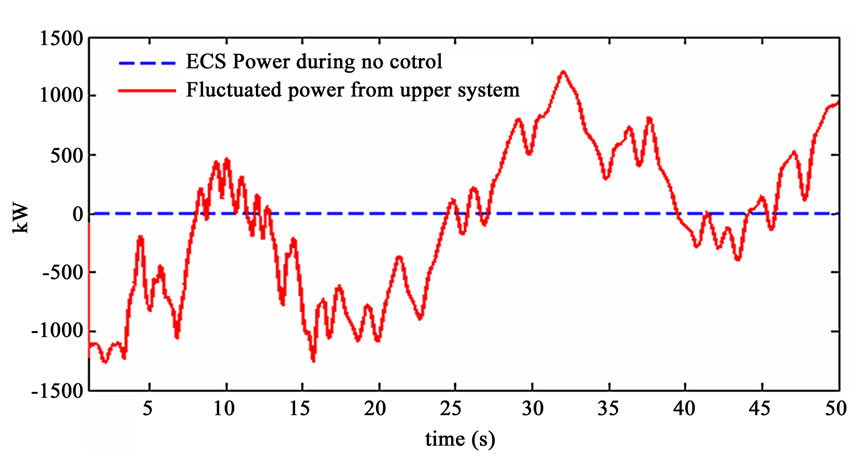
Figure 10. Real power from the ECS and from the system without control
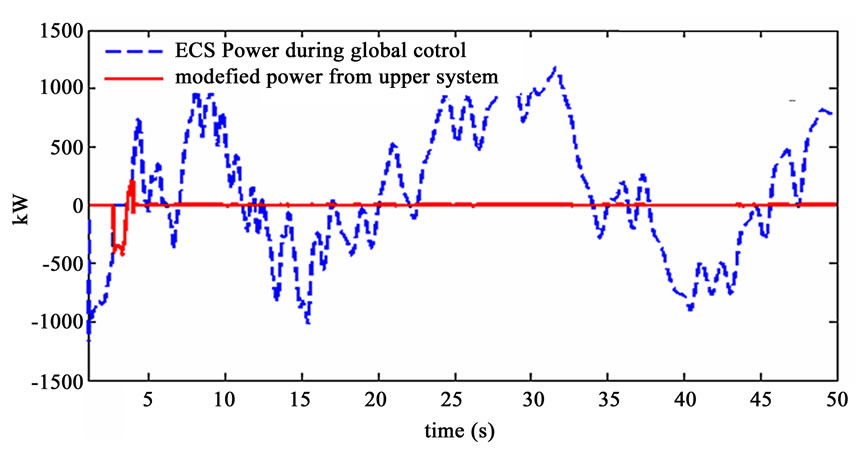
Figure 11. Real power from the ECS and from the system in global control

Figure 12. Real power from the ECS and from the system in local control
Figures 10 and 11, we can understand the efficiency of the ECS. Meanwhile, comparing the Figures 11 and 12, we can understand the efficiency of the Multi-agent control scheme.
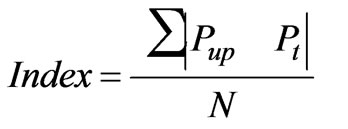
The evaluation index is expressed in Equation (6) where the averaged power is calculated to investigate the power deviation from the upper system of the described distribution network and to evaluate the LFO scheme for every strategy [21].
 (6)
(6)
where Pup is the power from the upper system, Pt the target power, and N is the number of entered data. The obtained indices according to the different control strategy are shown in Table 3 (The smaller the index, the better the result).
The coordination scheme between the DG and the ECS results in a proper operation of the ECS, in other words to keep the stored Energy of the ECS in a certain desired level, the support from the DG is required. Simulation results shown in Figure 13 show that the trajectory of the DG output is opposite to the ECS stored energy trajectory. The verification of this result is simply done by checking the index of the upper system power. If the saving energy of the ECS is over or under the desired limit, the index will be very high and the ECS will stop working. As shown in Figure 12, in the period from 3 to 4.2 seconds the ECS stopped because of the over saturation in the saved energy due to size limitation of the ECS. By using the suitable controller and suitable coordination scheme, this phenomenon has been eliminated and contentious control action can be achieved.
The coordination scheme between the DG and the

Table 3. LFO indices for different control strategy
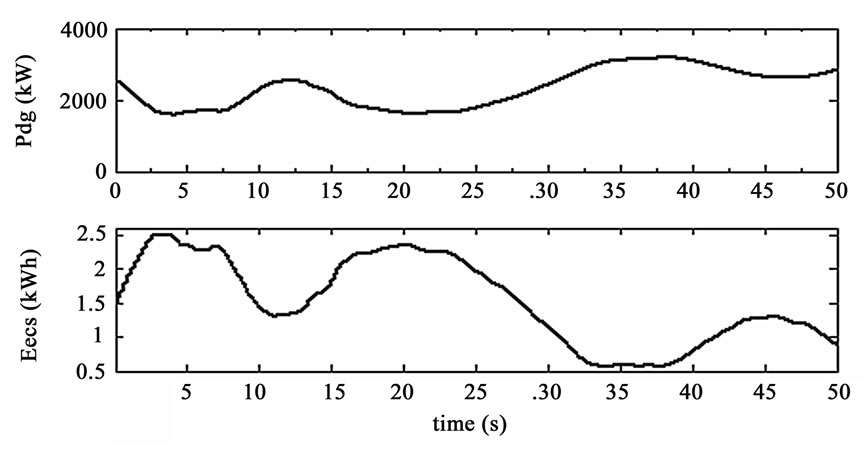
Figure 13. Coordination scheme illustrations
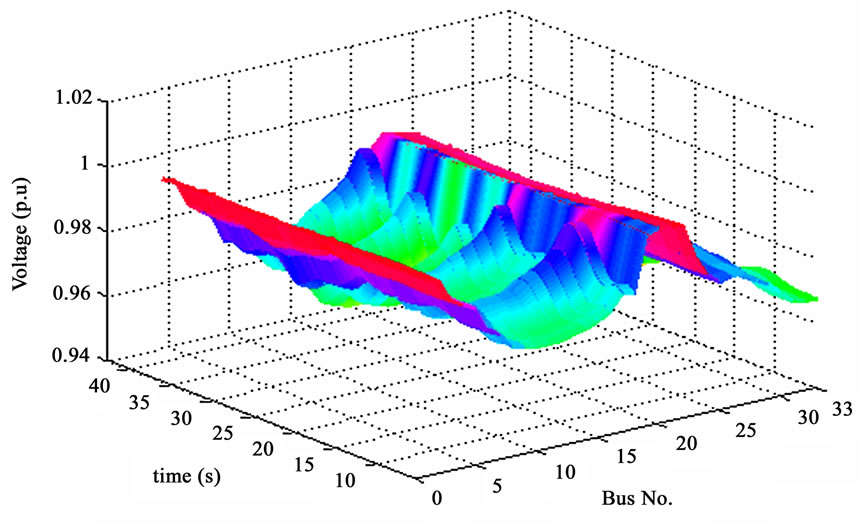
Figure 14. Voltage profile at every node of the system
ECS results in a proper operation of the ECS, in other words to keep the stored Energy of the ECS in a certain desired level, the support from the DG is required. Simulation results shown in Figure 13 show that the trajectory of the DG output is opposite to the ECS stored energy trajectory. The verification of this result is simply done by checking the index of the upper system power. If the saving energy of the ECS is over or under the desired limit, the index will be very high and the ECS will stop working. As shown in Figure 12, in the period from 3 to 4.2 seconds the ECS stopped because of the over saturation in the saved energy due to size limitation of the ECS. By using the suitable controller and suitable coordination scheme, this phenomenon has been eliminated and contentious control action can be achieved.
5. Conclusions
Two main objectives have been achieved from this article. The first one is to show the efficient utilization of the ECS as a new technology in power distribution system. The second one is to show the efficiency of the control scheme and the utilization of MAS. The ECS can absorb all the fluctuations in real power caused by renewable energy sources with size limitations. DG cannot absorb such fluctuations due to technical limitations. The scheme in this article provides coordination between the two devices. Results show an efficient usage of the scheme, an efficient utilization of MAS and applicable implementation of ECS. All of all, with the ECS and the suitable control scheme the consequences of fluctuated power are highly avoided.
REFERENCES
- G. Pepermans, J. Driesen, D. Haeseldonckx, R. Belmans and W. Dhaeseleer, “Distributed Generation: Definition, Benefits and Issues,” Energy Policy, Vol. 33, No. 6, 2005, pp. 787-798.
- W. El-Khattam and M. M. A. Salama, “Distributed Generation Technologies, Definitions and Benefits,” Electric Power System Research, Vol. 71, No. 2, 2004, pp. 119- 128.
- R. K. Singh and S. K. Goswami, “Optimum Siting and Sizing of Distributed Generations in Radial and Networked Systems,” Electric Power Components and Systems, Vol. 37, No. 2, 2009, pp. 127-145.
- N. Acharia, P. Mahat and N. Mithulananthan, “An Analytical Approach for DG Allocation in Primary Distribution Network,” Electrical Power and Energy Systems, Vol. 28, No. 6, 2006, pp. 669-678.
- C. L. T. Borges and D. M. Falcao, “Optimal Distributed Generation Allocation for Reliability, Losses, and Voltage Improvement,” Electrical Power and Energy Systems, Vol. 28, No. 6, 2006, pp. 413-420.
- J. Morren, S. W. H. De Haan and J. A. Ferreira, “Contribution of DG Units to Primary Frequency Control,” European Transaction on Electrical Power, Vol. 16, No. 5, 2006, pp. 507-521.
- M. Okamura, “A Basic Study on Power Storage Capacitor System,” IEEJ Transactions on Power and Energy, in Japanese, Vol. 115, 1995, pp. 504-510.
- C. Abbey and G. Joos, “Super Capacitor Energy Storage for Wind Energy Applications,” IEEE Transactions on Industry Applications, Vol. 43, No. 3, 2007, pp.769-776.
- S. M. Muyeen, S. Shishido, A. Mohd Hasan, R. Takahashi, T. Murata and J. Tamura, “Application of Energy Capacitor System to Wind Power Generation,” Wind energy, Vol. 11, No. 4, 2007, pp. 335-350.
- T. Kinjo, T. Senjyu, K. Uezato and H. Fujita., “Output Leveling of Wind Power Generation System by EDLC Energy Storage System,” Electrical Engineering in Japan, Vol. 154, No. 4, 2006, pp. 34-41.
- K. Shinohara, K. Yamamoto, K. Iimori, Y. Yanagita and Y. Gosho, “Performance and Maximum Load Capacity of Uninterruptible Power System Using Double-Layer Capacitor,” Electrical Engineering in Japan, Vol. 1541, No. 3, 2005, pp.73-81.
- T. Hiyama, K. Tomsovic, E. Anami, S. Yamashiro, M. Yamagishi and M. Shimizu, “Experimental Studies on Fuzzy Logic Stabilization Control for Energy Capacitor System,” Proceedings of IEEE ISAP Conference, Budapest, 2001.
- E. Baran Mesut and F. W. Felix, “Network Reconfiguration in Distribution System for Loss Reduction and Load Balancing,” IEEE Transactions on Power Delivery, Vol. 4, No. 2, 1989, pp. 1401-1407.
- C. Joon-Ho and K. Jae-Chul, “Network Reconfiguration at the Power Distribution System with Dispersed Generation for Loss Reduction,” Power Engineering Society Winter Meeting, Vol. 4, 2000, pp. 2363-2367.
- M. Juan Andrés and G. Antonio José, “A New Heuristic Approach for Distribution Systems Loss Reduction,” Electric Power Systems Research, Vol. 78, No. 11, 2008, pp. 1953-1958.
- H. M. Khodr, J. Martínez-Crespo, Z. A. Vale and C. Ramos, “Optimal Methodology for Distribution Systems Reconfiguration Based on OPF and Solved by Decomposition Technique,” European Transactions on Electrical Power, Research Article, 22 January 2009.
- M. F. AlHajri and M. E. El-Hawary, “Improving the Voltage Profiles of Distribution Networks Using Multiple Distribution Generation Sources,” Conference on Power Engineering, Vol. 10, No. 12, 2007, pp. 295-299.
- H. Li and Z. Chen, “Overview of Different Wind Generator Systems and Their Comparisons,” IET Renewable Power Generation, Vol. 2, No. 2, 2008, pp. 123-138.
- G. L. Johnson, “Wind Energy Systems,” Prentice-Hall, New Jersey, 1985.
- E. Muljadi, C. Wang and M. H. Nehrir, “Parallel Operation of Wind Turbine, Fuel Cell, and DG Sources,” IEEE Power Engineering Society General Meeting, Vol. 2, 2004, pp. 1927-1932.
- Y. Qudaih and T. Hiyama, “Reconfiguration of Power Distribution System Using Multi Agent and Hierarchical Based Load Following Operation with Energy Capacitor System,” Proceedings of 8th International Power Engineering Conference, Singapore, December 2007, pp. 223- 227.
NOTES
Nomenclature:
PV: Photovoltaic; DG: Diesel generator; WTG: Wind turbine generator; Va, Vb, and Vc: Nominal line voltages; Ia, Ib, and Ic: Currents injected; Pup: Power from the upper system; Pecs: Power from the ECS unit;
Eecs: ECS Stored energy; Pdg: Power from the diesel unit; Ppv: Total output from PV units; Pwt: Total output from wind turbine; DPset: Control Signal to the diesel generator; Ptarget: Upper system target power; Pref.: Monitored power from upper system.