Journal of Electromagnetic Analysis and Applications
Vol. 1 No. 4 (2009) , Article ID: 1113 , 6 pages DOI:10.4236/jemaa.2009.14032
Shunt Reactor Switching Characteristics and Maintenance Planning in 161 kV System
1Department of Electric Engineering, National Taiwan University of Science and Technology, Taiwan, China; 2High Voltage Research Lab of Taipower Research Institute, Taiwan Power Company, Taiwan, China.
Email: hchsiao@mail.ntust.edu.tw
Received June 16th, 2009; revised July 30th, 2009; accepted August 10th, 2009.
Keywords: GCB, Switching, Shunt Reactors, EMTP
ABSTRACT
The high frequency transient recovery voltage caused by usually switching operation of the circuit breakers, used on shunt reactor switching, have become a noticeable problem recently. For extension the service life time and normal operation of the circuit breakers, a well modified maintenance strategy is proposed. The field testing and experimental measurement showed the maintenance strategy proposed had been proved effectively and adopted in Taiwan Power Company.
1. Introduction
The increasing leading reactive power caused by the underground power cables, used in transmission and distribution system from 11 kV to 345 kV, have become a noticeable problem and should be solved for voltage and reactive power flow control. To compensate the leading reactive power and depress the voltage rise at the end terminal of cable, the shunt reactors are equipped in power system. But the circuit breakers used for shunt reactors switching caused the unavoidable high frequency transient recovery voltage (TRV) during switching operation. The maintenance policy should be planned based on a fixed period maintenance schedule or conditional basic maintenance schedule.
The deterioration of insulation material and wear of arcing contact are related with operation times of circuit breaker, switching current and duration of arcing time. We discuss the maintenance policy and performance evaluation by monitoring the energy I2t accumulation of the circuit breakers that are used in Taiwan Power Company.
In this paper, the Electromagnetic Transient Program (EMTP) has been employed to simulate and analyze the transient phenomenon of gas-insulated circuit breaker (GCB) during shunt reactor switching. To increase the realism, the practical Taipower Shen-Mei EHV substation is considered as the simulation system. Based on the theoretical analysis, the three-phase equivalent model is proposed for the EMTP to simulate the switching. Besides, the analysis of transient characteristics has been conducted as the basis of preventive strategy to avoid abnormal operation of GCB.
We got a lot’s of problems on gas-insulated circuit breaker for shunt reactor switching during the past few years in Taiwan power system. The frequently switching of the GCB for shunt reactors degraded gas insulation level. The melted contactors, in turn, could not clear the current prospectively. Meanwhile, the highly rise rate of transient recovery voltage of inductive current switching caused re-striking phenomenon and incomplete tripping. These two main characteristics make GCB using for shunt reactor un-expectantly damaged.
2. Load Switching Simulation Analysis
The simplified circuit model of series RLC and circuit breaker used for switching analysis can be formulated as differential Equation (1), while the waveform of transient recovery voltage, TRV, between source side and load side contactor after circuit breaker opened can be calculated by solving the Equation (1) and expressed by Equation (2).
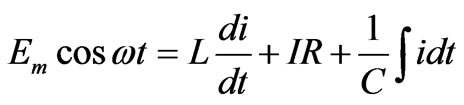 (1)
(1)
 (2)
(2)
where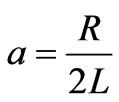 , and
, and 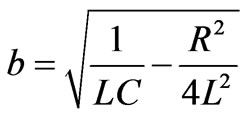
The practical inductive load switching circuit is shown as Figure 1.
The chopping over-voltage parameter, ka, is shown as Equations (3) or (4).
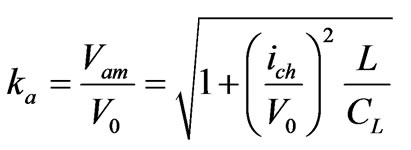 (3)
(3)
 (4)
(4)
where Q is rated capacity of reactor (VA), λ is chopping factor (AF-0.5), ω is angular velocity of system, and N is the series number of poles in a phase. The three phases shunt reactor switching circuit and the over-voltage phenomena can be shown as Figure 2 and Figure 3 respectively [1,2].
In Figure 3, the waveform includes four stages that are load side oscillation, re-ignition over-voltage oscillation, second parallel oscillation and main circuit oscillation.
The EMTP model for studying inductive current switching is shown as Figure 4. The basic rated parameters of the reactor are shown in Table 1. Let:
Lsr: Source side equivalent inductance of phase r.
Csr: Source side equivalent stray capacitance of phase r.
Lbr: Equivalent inductance between CB and reactor.
CLr: Stray capacitance of load side.
Lr : Inductance of reactor.
Rr : Intenal resistance of reactor of phase r.
Cr : Interior capacitance of reactor of phase r.
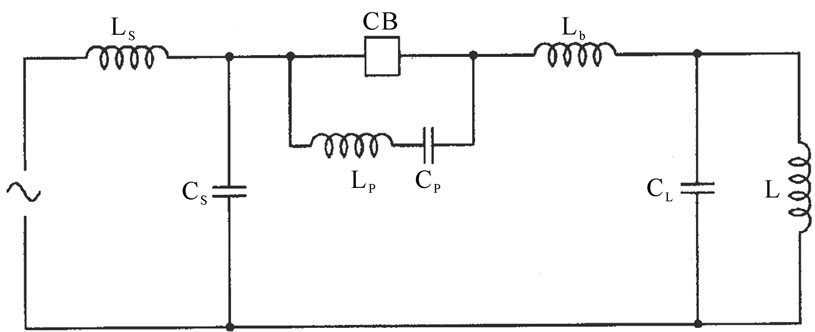
Figure 1. Inductive load switching circuit
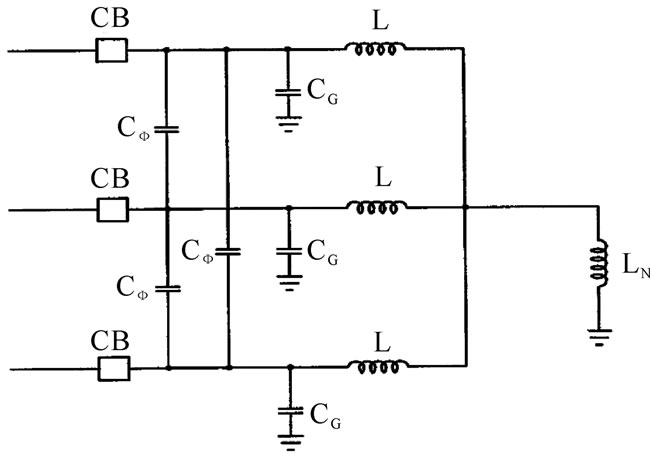
Figure 2. Three phases shunt reactor circuit
Cpr: Interior capacitance of CB of phase r.
Lpr: Interior inductance of CB of phase r.
Vsr: Source voltage of phase r The other parameters in phase r of gas-insulated circuit breaker and equivalent circuit are Lsr = 4.474 mH, Csr = 0.0028 μF, Lbr = 0.0045 mH, CLr = 0.00185 μF, Cpr = 200 pF, Lpr = 0.001 mH, Vst = 19.05 kV, respectively. Sup-
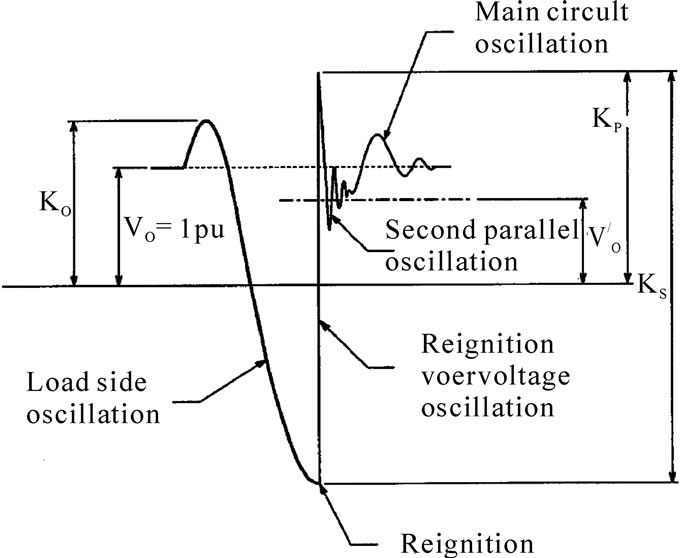
Figure 3. Over-voltage phenomena of inductive load switching
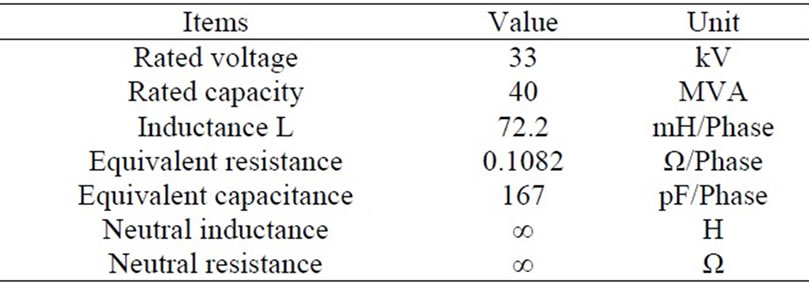
Table 1. Relative parameters of reactor bank
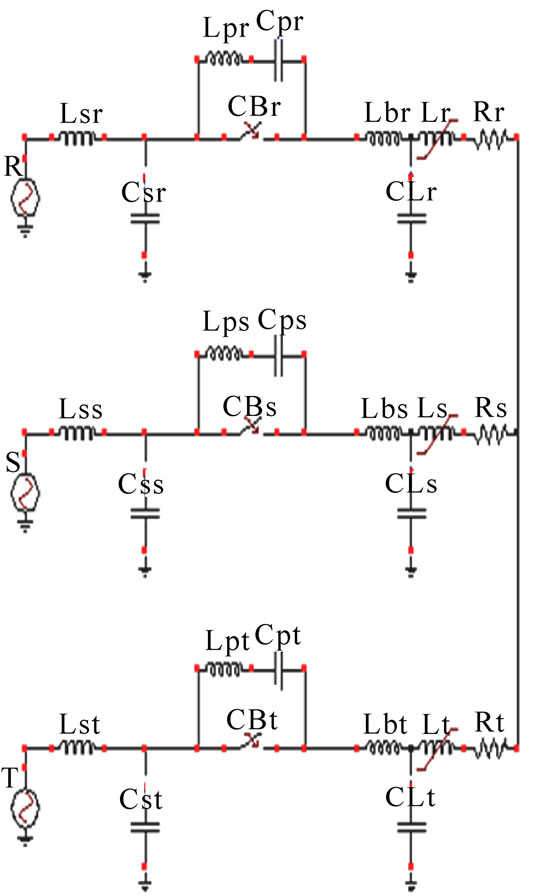
Figure 4. The equivalent circuit model for EMTP
pose the phase s and t have the same parameter as phase r and three phases circuit are balanced. The reactors are Y-connected, neutral independent. There are so many uncertain parameters on both Cassie and Mayr arc models and these parameters are difficult to estimated precisely [3,4] that the arc models were not adopted in this study. The circuit breaker model for EMTP analysis is consisted of switch CB parallel connected with Lp and Cp as shown in Figure 4. The simulation procedure of circuit breaker behavior was executed as follow: phase r is the first pole to clear; phase s and t are cleared 4 ms later after phase r. The measured waveform is shown in Figure 5. The simulated waveform of inductive load switching is shown in Figure 6 which is based on the idealized and simplified model. However the amplitude of measured waveform in Figure 5 will be lessened due to high frequency switching and mutual coupling.
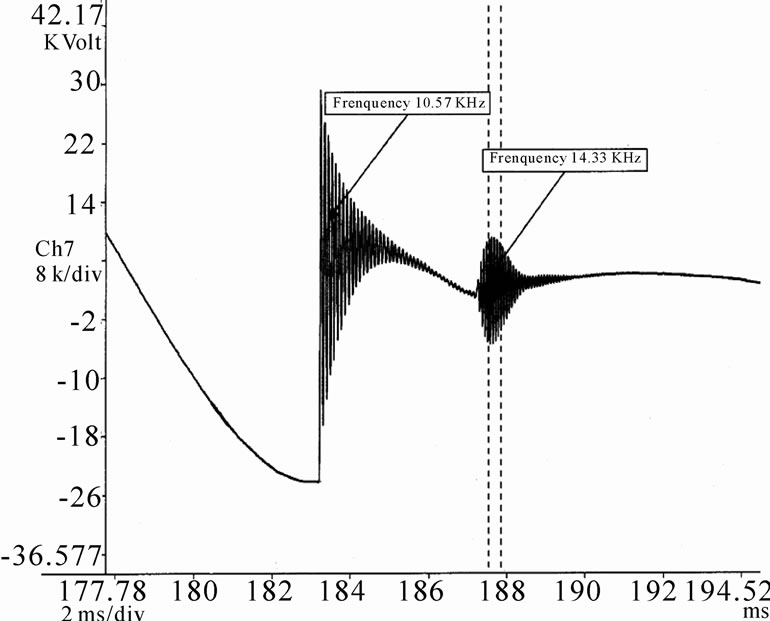
Figure 5. The measured waveform of inductive load switching
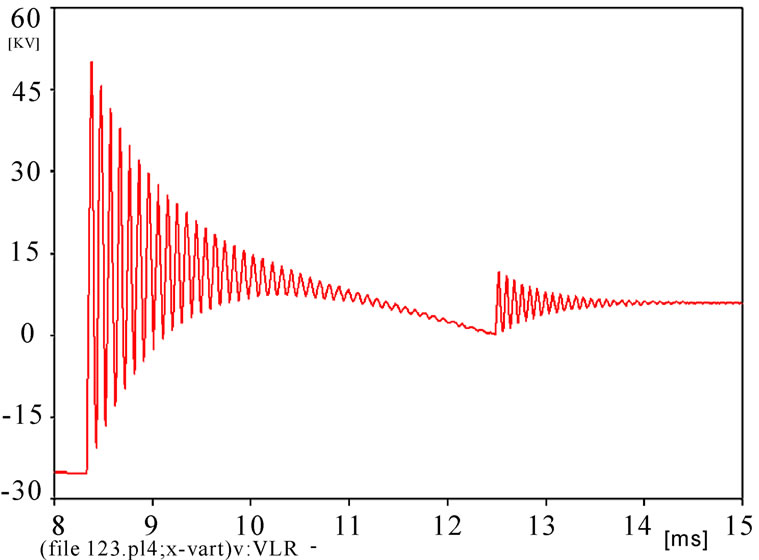
Figure 6. The simulated waveform of inductive load switching
We compared the measured result and simulated result as in Table 2. f1 and f2 represent the first and second oscillation frequency, two oscillations take 4ms apart as the interrupting time among phase r and phase s and phase t. The simulated oscillation frequency, f1, is almost the same as measuring data [5].
The waveform, simulated and measured, of source side of circuit breaker are shown in Figure 7 and Figure 8.
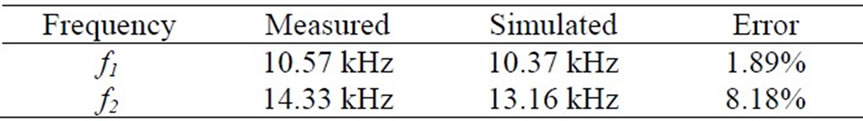
Table 2. Comparison between measured and simulated result
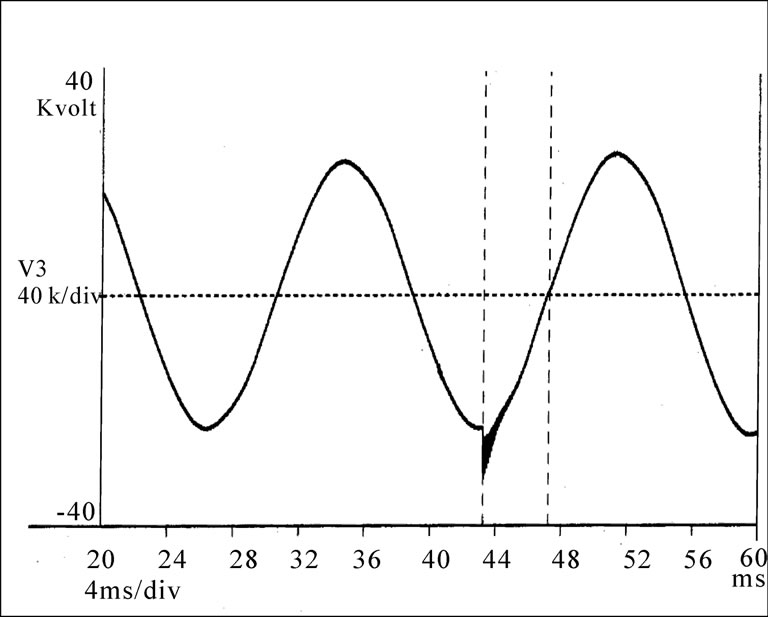
Figure 7. The measured waveform of source side of circuit breaker

Figure 8. The simulated waveform of source side of circuit breaker
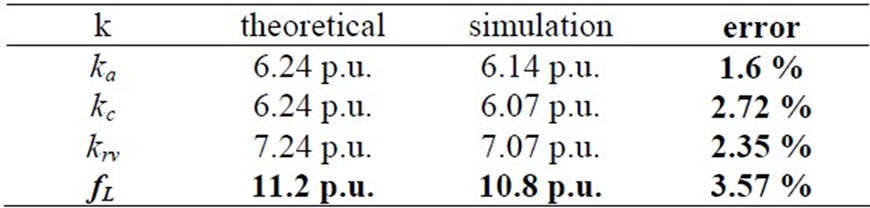
Table 3. Results of simulation of 20A chopping current compared with theoretical value
The waveforms of both simulation and measurement are very similar also. We knew the over-voltage is much influenced by chopping current of interrupting. We studied the chopping over-voltage, the simulated chopping current from 1 A, 5 A, 10 A and 20 A. The simulated result of 20 A, much more influence than others current, is as shown as Table 3 for simplicity. The theoretical values were calculated from the Equations (3) and (4).
From the Table 3, the over-voltage is very high if the circuit breaker has 20A chopping current. The oscillation frequency of load side oscillation, first parallel oscillation, second parallel oscillation and main oscillation are listed in Table 4 [6].
The above simulation was applied to over-voltage study on 161 kV shunt reactor switching phenomenon also. Normally, the shunt reactors were installed in the overhead transmission system to compensate the line capacitive reactive power, especially when much more 161 kV and 345 kV overhead cables were equipped in power system. However, over voltages produced from flashovers, found at spacers of GIS which is used for switching reactors, and sparks found between support structures and cable termination, may degrade the insulation performance due to frequently switching. For surveying the amplitude and frequency of TRV, different current chopping over-voltage and re-ignition overvoltage were used during simulations after the simulating circuit model was approved. The circuit model realized is shown in Figure 9, and the relative specifications of shunt reactor are listed in Table 5.
The capacitance of shunt reactor and bushing offered by manufacturer are 10,000 pF and 800 pF respectively. The source impedance parameters are given by power system planning division of Power Company. The simulated chopping currents are 20A, 10A and 5A and 1.7A. The simulated over voltage waveforms are shown in Figure 10, Figure 11 and Figure.12. The parameters, ka, kr, krv and fr, were calculated according to formulas proposed in IEEE C37.015 [4] and listed in Table 6.
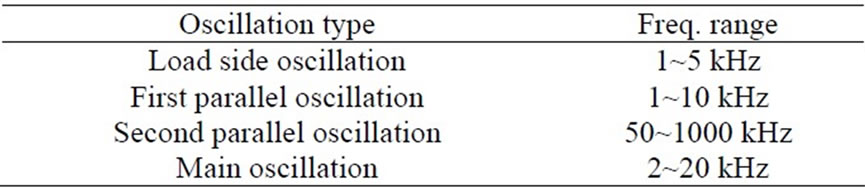
Table 4. Oscillation frequency range of TRV

Table 5. Parameters of shunt reactors
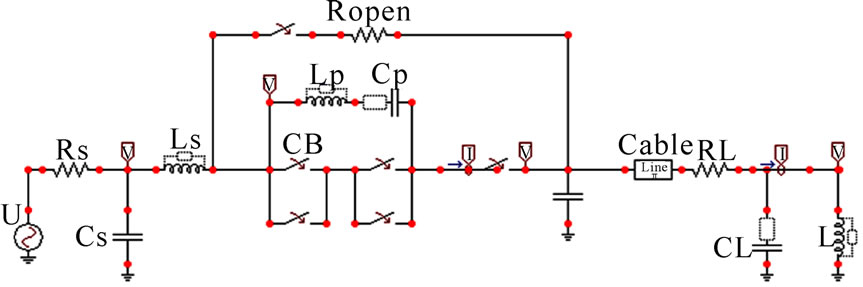
Figure 9. Over-voltage simulation model
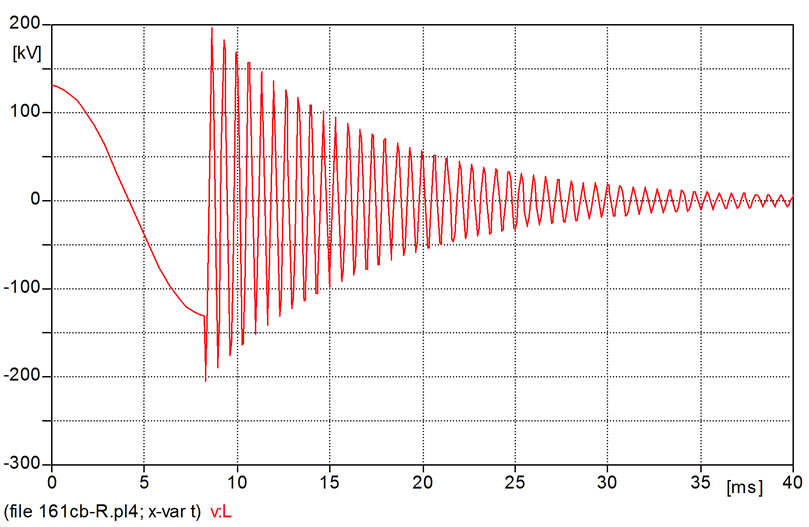
Figure 10. The over voltage waveform caused by 20A chopping current
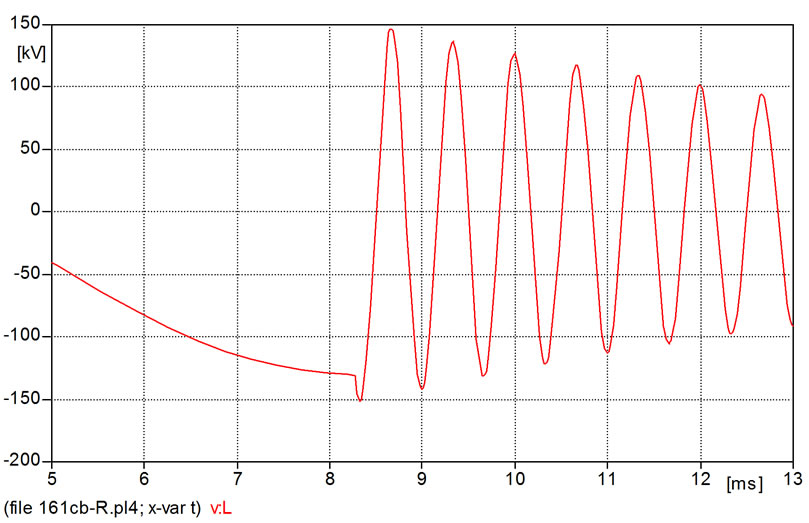
Figure 11. The over voltage waveform caused by 10A chopping current
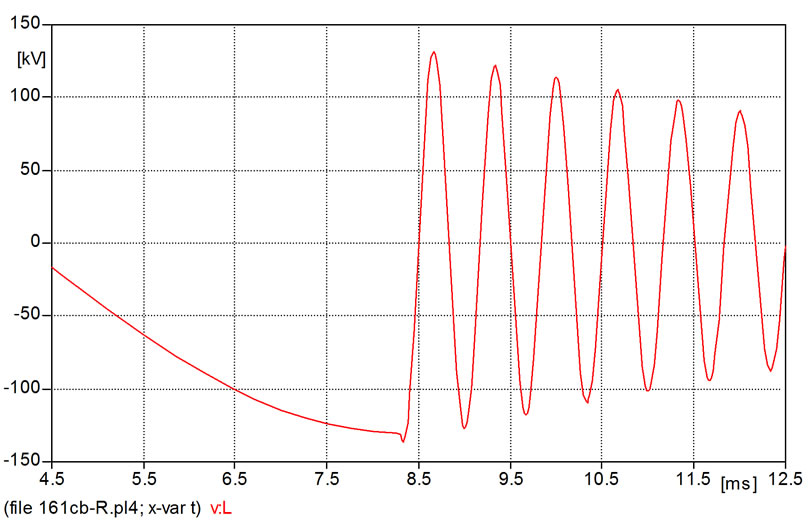
Figure 12. The over voltage waveform caused by 5A chopping current
We have compared the simulation chopping over voltage parameters, which defined in Figure 3 shown, with theoretical calculated parameters from the Equations (3) and (4). The results are shown in Table 6. The errors for 20 A chopping current among the parameters are about 1 %.
We use the model to simulate re-ignition over voltage also. The waveform of reignition over voltage is as Figure 13 shown.
The over voltage waveform measured at site is as Figure 14 shown.
After we found the switching characteristics of the inductive load of circuit breaker, the main purposes of this research will be discussed here also.

Table 6. Simulated chopping over voltage parameters
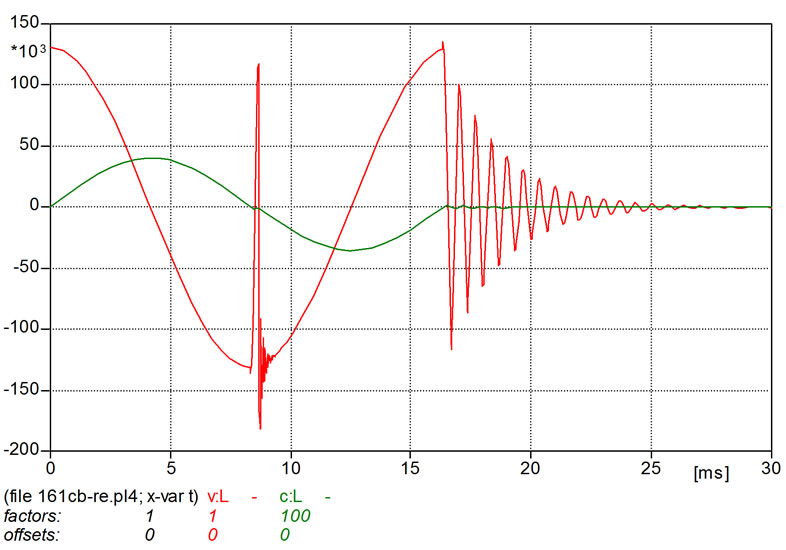
Figure 13. The re-ignition over voltage waveform
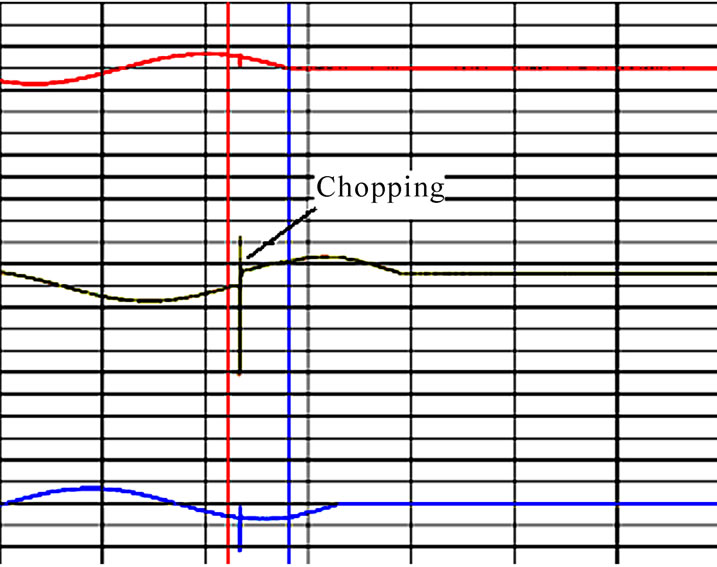
Figure 14. Field measured chopping over voltage
3. Maintenance Strategy
The life time of inductive load switching circuit breaker are mainly influenced by making angle of circuit breaker, arcing energy during contact opening, re-ignition and over-voltage of the circuit breaker. To increase the stability of power system operation, the following method was proposed.
A 144-kV metal oxide arrester was used for overvoltage protection between shunt reactor and GIS. Adjusting the system parameters may change the frequency and peak value of the over-voltage.
After series calculating statistically the arcing time and arcing energy of inductive load switching, field testing records excused in Taiwan, we proposed a maintenance strategy that the circuit breaker must be re-flashed after every 500 switching operations. Normally, the circuit breaker should be re-flashed after every 2,000 switching operations recommended by manufacturers. But the inductive switching for shunt reactors produces high frequency and harmful high re-ignition current. The destructive high current and energy I2t in turn destroyed contactors of the breaker. In field testing, the destructive damages can be observed after 700 switching operations approximately.
Meanwhile a performance evaluation for the circuit breakers should be executed according to the maintenance schedule after a re-ignition phenomenon has been found during monitoring the switching behaviors of the breakers daily.
The maintenance prediction of the circuit breaker can then be executed by monitoring the arc energy I2t by digital protection relay, such as GE SR-760, after the setting parameters had been achieved [7].
4. Conclusions
The unavoidable high frequency transient recovery voltage (TRV) existed in circuit breakers due to inductive switching can be depressed to reasonable and safely level by equipping suitable arrestor proposed in this paper. The maintenance policy for the breakers should be planned based on a fixed period maintenance schedule or conditional basic maintenance schedule. Finally, the circuit breaker should be re-flashed after every 500 switching operations to maintain the power system normally.
REFERENCES
- A. M. Cassie, “A new theory of rupture and circuit severity,” CIGRE Report, Vol. 102, 1939.
- O. Mayr, “Beitrage zur Theorie des statischen und des dynamischen lichtbogens Elektrotechn,” Vol. 37, pp. 589– 608, 1943.
- D. F.Peelo and E. M. Ruoss, “IEEE application guide for shunt reactor switching,” IEEE Transaction on Power Delivery, Vol. 11, No. 2, April 1996.
- “IEEE application guide for shunt reactor switching,” IEEE Std C37.015–1993, Page(s): I, 25 July 1994.
- Z.Ma, C. A. Bliss, A. R. Penfold, A. F. W. Harris, and S. B. Tennakoon, “An investigation of transient over voltage generation when switching high voltage shunt reactors by
 circuit breaker,” IEEE Transactions on Power Delivery, Vol. 13, No. 2, pp. 472–479, April 1998.
 - P. H. Schavemaker and L. Van der Sluis, “The influence of the topology of test circuits on the interrupting performance of circuit breakers,” IEEE Transactions on Power Delivery, Vol. 10, No. 4, pp. 1822–1828, 1995.
- C.-L. Fan, “The study on transient recovery voltage adjustment for high power test laboratory,” M.S. Thesis, National Taiwan Institute of Technology, Taiwan, 1986.