Wireless Sensor Network
Vol. 4 No. 5 (2012) , Article ID: 18958 , 9 pages DOI:10.4236/wsn.2012.45020
An Eco-Hydrology Wireless Sensor Demonstration Network in High-Altitude and Alpine Environment in the Heihe River Basin of China
1Cold and Arid Regions Environmental and Engineering Research Institute, Chinese Academy of Sciences, Lanzhou, China
2Gansu High-Performance Grid Computing Center, Lanzhou, China
Email: yaonan@lzb.ac.cn
Received February 9, 2012; revised March 14, 2012; accepted April 8, 2012
Keywords: Wireless Sensor Network; Eco-Hydrology; Intensive Observation; Wireless Transmission; Environmental Monitoring
ABSTRACT
The emerging of Wireless Sensor Network (WSN) technology has brought new opportunities for data intensive observation in eco-hydrological research and environment monitoring. To make up for the insufficiencies of space observation data for models in eco-hydrology processes research of inland river basin which constrain the construction of accurate modeling and simulation, a sub-basin of the Heihe River Basin named Hulugou has been selected to perform the deployment and research for wireless sensor network from the perspective of eco-hydrology. In this paper, we discussed the system framework, the demonstration research area, the deployment of sensor nodes and the network topology of wireless sensor network. Finally, the study has summarized existing problems and experiences of wireless sensor network in these eco-hydrological applications and the available researches in hard environment. In the future, we will deploy a large number of sensor nodes in the long-term fine-grained eco-hydrological elements observing environment to form lots of homogeneous or heterogeneous wireless sensor networks.
1. Introduction
At present, there are many problems existing in eco-hydrology processes researches of river basin which constrain the construction of accurate modeling and simulation [1]. One of the key problems is the data needed for modeling, especially the space observation data is insufficient. Thus, preparing continuous, systematic, reliable, and intensive data for model construction and simulation is important for river basin ecology-hydrology research. The lack of data on the true variability of the meteorological data in space and time hinders the model’s ability to accurately represent short term or localized responses in river flow.
Current observation methods in field environment, such as the traditional fixed-point observation stations are difficult for large-scale deployment. High cost, high risk, intensive labor works and other problems for highdensity deployment in river basin. Therefore, a new method for observation is needed to realize intensive data observation to make up for the sparse distribution of the traditional fixed-point observation stations and to meet the requirements of eco-hydrological model building and simulation.
With the rapid development and increasingly mature of Micro Electro Mechanical systems (MEMS) technology, computer technology, wireless communication and sensor technology, the emerging of Wireless Sensor Network (WSN) technology has brought new opportunities for data intensive observation of eco-hydrological research [2]. From the 21st century, WSN technology has attracted great concern in industrial, military and academic fields and expended application prospects and potential application values in the ecological environment research. WSN integrates environment awareness, data processing, wireless communication and energy supply into a sensor node, which forms the wireless sensor network with self-organizing approach to realize realtime sensing, monitoring, collecting and processing information of various monitoring objects. It comes into being an intensive observation technique of low-cost and large area deployment. In February 2003, the “Technology Review” magazine of U.S. elected the top ten emerging technologies which have imposed profound impact on human life and WSN is listed as one of them. WSN was taken for as one of the four pillar industries in 21st century high-tech field in technical comments of the U.S. “Business Weekly” magazine in August 2003. Similar to the satellite remote sensing technology produced in the 20th century, wireless sensor network will bring out revolutionary change in all aspects of the earth system and environmental science [3].
Environmental monitoring has become an important application field of WSN and has undertaken a number of typical applications at present. Environmental sensor networks (ESNs) provide new opportunities for improving our understanding of the environment. W.R. Philip, et al. integrated complex sensors, such as networked digital cameras and microphones into sensor networks for hierarchical methods of sensing that promise a further understanding of our ecological systems by revealing previously unobservable phenomena [4]. S.S.O. Burgess, et al. described the current state of wireless environmental monitoring from an end-user point of view and report their initial attempts to adapt the cutting-edge technology to the realm of forest research [5]. A novel environmental monitoring system with a focus on overall system architecture for seamless integration of wired and wireless sensors for long-term, remote, and near-realtime monitoring was presented in [6]. J.V. Borre, et al. has tried to integrate remote sensing technology in their habitat monitoring project—Natura 2000 [7]. To obtain water and salinity mass balances for a 60,000 ha tract of seasonally managed wetlands in the San Joaquin River Basin of California, N.W.T. Quinn, et al. described the use of a number of state-of-the-art sensor technologies [8]. And X. Zhu describes an online water quality monitoring system for intensive fish culture in China, which combined web-server-embedded technology with mobile telecommunication technology [9]. The GENESIS project provides an efficient Web-based software solution that can be used by all kind of actors involved in environment management and health services in Europe [10]. C. Youn, et al. presents the TEAM data management, access, and analysis system that provides end-to-end solutions for sensor-based data and field observations [11]. In [12], a Wireless Sensor Network for Seismic-Observation-Environment Surveillance has been designed and described. need to create these components, incorporating the applicable criteria that follow.
2. Research Area and Research Objects
2.1. Research Area
Heihe River originates on the northern Gansu side of the Qilian Shan mountains, then flows through Hexi Corridor of Gansu Province, ends in Juyanhai and the West Juyanhai of Ejinaqi in the territory of Inner Mongolia Autonomous Region. Its total length is 821 km. Heihe River Basin covering an area of approximately 142,900 Km2 (96˚42'E - 102˚04'E, 39˚45'N - 42˚40'N) is the second largest inland river basin of Northwest China. According to altitude and natural geographical characteristics, it can be divided into three types of landscapes including upstream Qilian Mountains, midstream corridor plain and downstream Alxa Plateau. The upper stream altitude ranging between 2500 to 5000 m is the Qilian Mountains located in the northern margin of QinghaiTibet Plateau and Climatic characterized by more precipitation, less evaporation, low temperature, cold and wet, and the Tuanjie Peak with about 5826 m high is the birthplace and source region of Heihe river. Zhengyi gorge is the boundary between the midstream and downstream.
As shown in Figure 1, the Hulugou sub-basin (99˚50'E - 99˚54'E, 38˚12'N - 38˚17'N) is a tributary of the Heihe River Basin which located in Qilian county of Qinghai province. The drainage area is about 23.1 km2 with the elevation ranging from 2960 m and 4820 m, a typical continental alpine mountain climate which has an annual total precipitation between 400 mm to 600 mm and temperature ranges from –30˚C to 30˚C. The climate is variable and changeable from day to day. Weather is generally cold and windy with frequent cloud and rain. Only five months throughout the year is snow-free. Due to extremely adverse weather conditions, it have created a local fragile ecology, sparse vegetation, and mostly cold, drought tolerance and short-lived alpine plant [13]. However, the alpine cold desert zone plays a water tower role in hydrological cycle as one of the birthplaces of main rivers in cold regions, which is sensitive to climate warming. Environmental parameter monitoring in alpine cold desert zone can provide data support for feedback land surface branch of high-precision multi-scale atmospheric circulation patterns, and runoff out of the mountains and water balance prediction under the condition of climate change.
2.2. Research Quadrat
To study the interactions between atmosphere and surface of Hulugou steppe meadow in the upper streams of Heihe River Basin, a 400 × 400 m2 prairie meadow at the entrance of a small valley was selected as a demonstration research area of wireless sensor network. The area was divided into 100 × 100 m2 grid, the appropriate sensor probes of air temperature, air humidity, solar radiation, soil temperature and soil humidity were deployed in the corresponding grid nodes, and those nodes formed a wireless sensor network to realize the long-term and unmanned observation of the environmental factors.
Given the cost of the current deployment of sensor networks is not low and the related theory and technologies

Figure 1. The location of Mafengou sub-basin in Heihe river basin.
are still in the research stage. Therefore, as shown in Figure 2, we first carried out the deployment of wireless sensor network on one grid node to analyze network performance in extreme and extraordinary conditions, explore availability of WSN demonstration for environmental monitoring and further feasibility of large-scale nodes deployment.
3. System Framework of Ecology-Hydrology Wireless Sensor Network
In this paper, the system framework of Ecology-hydrology Wireless Sensor Network is divided into four layers that are Sensor Network Layer, Server Layer, Application layer and User Interface Layer.
Sensor Network Layer: Observing data packets collected by sensor nodes will be sent through the self-organizing multi-hop wireless network to distant Base Station and Gateway. The data packages could be automatically forwarded through the best path which was chose based on hop counts, node energy, RSSI, and other factors.
Server Layer: the data will be uploaded to the remote database server via transmission network such as satellite, GSM/CDMA/GPRS, and be analyzed, computed and visualized.

Figure 2. Deployment of the eco-hydrological wireless sensor network.
Application Layer: a large number of continuous, intensive observational data can be collected by the deployment of Ecology-hydrology Wireless Sensor Network. Based on specific application scenarios, researchers could build a number of WSN applications.
User Interface Layer: users can easily access and download data through a browser. Administrators could accomplish the tasks such as node status monitoring, data collection and data visualization.
4. Wireless Sensor Network
As shown in Figure 3, according to the system framework of Ecology-hydrology Wireless Sensor Network, WSN is mainly constituted by nodes, base stations, transmission networks, gateways, servers and other components.
4.1. Nodes
We adopted a set of eKo nodes produced by Crossbow Technology Inc. which integrates an IRIS series processor or radio board and the 2.4 GHz dipole antenna. These nodes support the radio transmission of 2.4 GHz ISM band and could be serially connected up to 4 sensors. Its power is supplied by solar panels and three rechargeable Ni-MH batteries which could last three to four months uninterruptible power supply without sunshine. Data sampling frequency is set by the program into 15 minutes per time. As this data sampling frequency and without connecting sensor nodes, the average operating current is 0.4 mA. The sensor nodes and memory card in them will ensure proper operation at environmental conditions of –40˚C to +60˚C temperature and 0 RHI to +70 RHI humidity. It could work properly at temperature between –40˚C and +70˚C. Whenever reset the sensor nodes, they are required to be scanned and automatic identified. Taking into account the scenarios of site deployment, the node can transmit about 500 to 1000 meters of viewing distance by radio wave. In addition, the node also provides IP66-rated waterproof packaging to prevent dust and water droplets.
As shown in Figure 4, the nodes in the current field deployment serially connected soil temperature and humidity sensors of Watermark Company, environmental temperature and humidity sensors of Sensirion Company, and solar radiation sensors of Davis Company to monitor and collect information of relevant environmental factors.
In wireless sensor networks, nodes are generally far away from base stations, thus sensor’s data which collected by the nodes could not be directly transferred to the base station and data forwarding was often relied on the relays. The hardware structure of relay was exactly the same as normal nodes but no sensors. In Hulugou sub-basin, the distance between the most remote node and the base station is 1.92 km in design. We adopted a self-developed routing protocol in this paper, and the transmission distance is about 700 m to 1000 m. In addition, considering equipment redundancy, we chose three relays which use a 7 dBi omni-directional antenna, transmitting in the 2.4 GHz ISM band, and adopt a joint supply of solar panels and Ni-MH battery.

Figure 3. Wireless sensor network include sensor nodes, base stations, transmission networks, gateways, servers and other components.
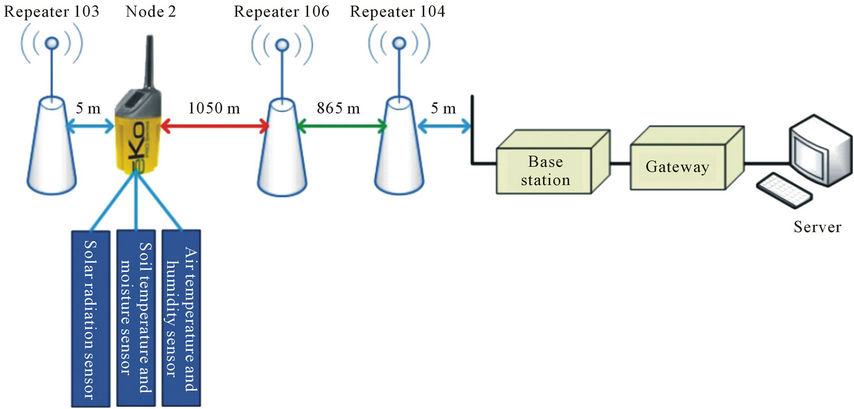
Figure 4. The network topography of watershed Eco-hydrological Wireless Sensor Network.
4.2. Base Station
The base station has a function of aggregating data collected by nodes and transmitting them to gateway node and the external network. It integrates a Crossbow IRIS series processor and a 2.4 GHz frequency radio band Omni-directional antenna. It also provides a USB access. The base station connects gateway equipment by an RJ45 cable for power. The average operating current of base station is about 30 mA and it could work in condition of 6˚C to 40˚C temperature and 10% to 80% humidity.
4.3. Transmission Network
After local computing and pre-processing of nodes, data packets collected by sensors were aggregated to the base station in the form of self-organizing multi-hop wireless network, then uploaded to the gateway by wired Ethernet, GPRS, GSM, Internet and so on. Through data analysis, data conversion, data processing, packet checksum calculation and information extraction, data in the gateway was saved to an SQLITE embedded database, then transferred to data center through the Internet at last.
4.4. Gateway
In this paper, the gateway acts as a small server. It has a built-in 266 MHz Intel IXP420 XScale processor, 8 MB program FLASH, 32 MB RAM and 2 GB flash disk. It could work properly at condition of 5 Voltage and 4 Watt power, 6˚C to 40˚C ambient temperatures and 10% to 80% humidity.
Built-in visualization Web application package in gateway could realize the remote data access and data management. Users can view real-time data, historical data and network-related configuration information through a Web browser at anytime and anywhere.
4.5. Servers
We set two tier servers for field observation station to save data from Sensor Network: One server locates in the field station that for saving data, pre-processing data and then submit the data to server deployed in data center. First server acts mainly as storage of data to extend the base capacity. The other server locates in the data center acts for further dealing with data, data analysis, data visualization, and sharing data through Web service.
4.6. Data Center and Communication Network
Our supercomputing environment adopts the high-performance parallel computer systems of Dawn 5000. It comprises four fat nodes and 64 blade servers which connected with InfiniBand high-speed network card and add up to 1152 cores AMD CPU, floating-point processing power is up to 10 trillion times a second. PC users could connect supercomputer environment and remote control the wireless sensor network of Eco-hydrology experiment field of Heihe river basin.
5. Data Analysis Methods and Performance Analysis of Sensor Nodes
5.1. Data Problems and Data Quality Control Methods
5.1.1. Data Problems
If the data sensing components of a Wireless Sensor Network system, sensors, do not have a better accuracy, it will result in less accuracy data or error data. Data processing unit of sensor has a limited storage space and will affect the system transitional surge in the exchange of data processing capabilities to result in loss of metadata information. Lack of enough sensor nodes or the sensor nodes could not adequate cover the research area will lead to incomplete collection of sensor information. Excessive number of sensor systems will result in intensive competition between nodes and busy the data transmit channel between nodes and base station, leading to severe network congestion, noisy data and inaccuracy data. In addition, unsuitable data link layer protocols and data routing protocols of sensor network will bring loss and delay of a large number of sensor information packets. For the low temperature, low energy and other environmental factors, sensor network nodes deployed in harsh environments will make abnormal values in sensor data. These above problems in wireless sensor networks will reduce the quality of observing data.
5.1.2. Data Quality Control Methods
Data quality control process could take the following steps:
1) Find the problem data. Firstly check logs of data acquisition and sensor network, then look through trends and constraints in environmental factors and check whether the data was within normal range of variation. Finally, drawing maps and comparing the relationship between the observed data from traditional integrated environmental observing system of Hulugou sub-basin and from wireless sensor networks to find observation which does not meet the basic principles.
Secondly, review the trends of data. Temperature and humidity of soil, temperature and humidity of environment, solar radiation intensity in this paper are all the meteorological factors which change periodically, and error analysis using conventional methods could not identify the individual error data. For example, values of some elements may have steep changes in a short time, but its value is still between the maximum and minimum of the same day or month, thus it will result to difficult judging based on the error. Curve prediction model can be used to carry out anomaly trend of data.
Thirdly, review the constraints. Collecting these observed elements have their own constraints, such as maximum constraint, minimum constraint and so on. The data of observation elements over times should be greater than the minimum constraint and smaller than the maximum constraint.
2) Identify and classify causes of data problems. One type of problems is logic errors of node's collection program and unsuitable design of data link layer protocols, network routing protocols and other communication protocol stacks. Another type is hardware problems of sensor network caused by an uncorrectable error, and this type of problems could be reduced by replacement of equipment. The other one is the problems resulted by human factors, environmental factors and animal interference, the causes of these problems could be identified by setting up camera to monitor and analyze the regional image.
3) Correct and revise the problems. According to the above classification of problems, correct and revise the problems which could be corrected, backup and delete problems which could not be corrected.
5.2. Data Management and Sharing
A semi-structured distributed model of data management was adopted to manage data in this paper. As shown in Figure 5, the model is divided into two or more levels. The bottom layer is the sensor network which was composed by sensor nodes of limited capacity. Each node receives command from the agent layer, collects data and computes locally, and transfer data to the agent layer. The agent layer is composed of base stations and gateways. Agent layer receives data from sensor nodes, indexes the received data or receives requests from users and forwards control commands to sensor nodes to process distributed query processing and returns query results to the users.
5.3. Data Visualization Analysis
As shown in Figure 6, web services program in gateway supports visualizing display elements by pie chart, trend line and other visualization forms. Real-time network topology, map window, servers’ information, nodes’ information, and routing information visualization are provide in this web service, and the sensor node list shows all the sensor nodes to be managed in current local area network. The data obtained through the WSN are transmitted to the research station by immediate and automatic means, and then transported to the super computing system at our institute through optical fiber channel, and finally displayed as 2D, 3D images on the Web page after processing.
6. Conclusion and Discussion
6.1. Conclusion
The deployment and research of wireless sensor network in Hulugou sub-basin completed the following works: Establishing a set of wireless sensor network which composed by sensors, nodes, base stations, relays, network management system, servers for observing hydrological and ecological elements. Obtaining data related to soil moisture, soil temperature, air temperature radiation data of twelve months about Hulugou, and forming a technical system to get a longtime intensive observation data of eco-hydrological elements. To providing validation of new observation methods of sensor network of eco-hydrological process studies and environmental monitoring in extreme cold and high altitude environments to form a
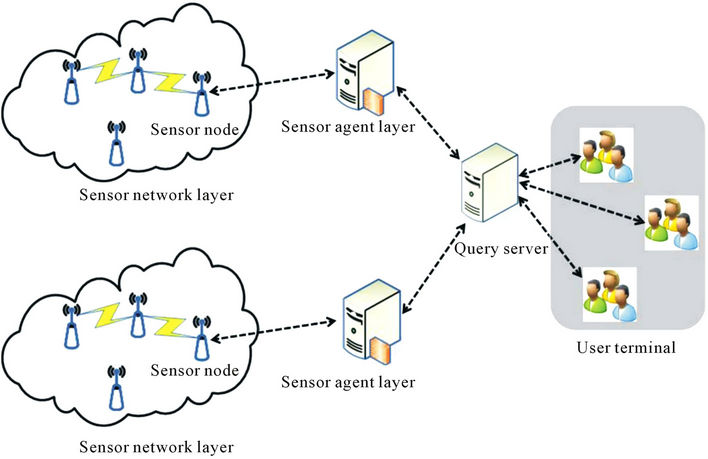
Figure 5. Semi-distributed data management model.
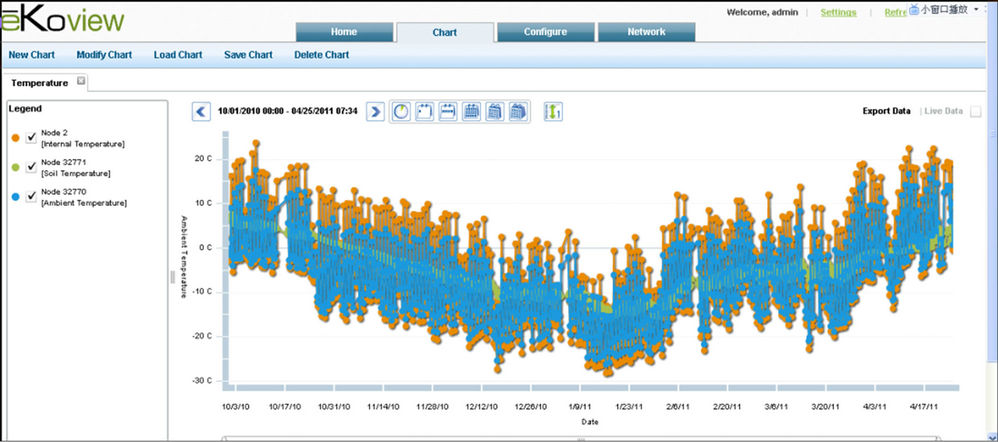
Figure 6. Trends of nodes internal temperature, environmental temperature and soil temperature overtime.
demonstration role. These application and research promotes eco-hydrological observations of Heihe River Basin extending from point observation to intensive observation extension and provides high-precision spatial data for constructing eco-hydrological model and preparing driving data for model simulation.
6.2. Discussion
Wireless Sensor Networks should be taken as an additional intensive data source of traditional fixed-point observation station to validate the data. High spatial and temporal resolution data of wireless sensor network could provide high-precision surface data for modeling remote sensing retrieval model and validation of retrieval data. In future work, the low-power node and sensor technology should be further consider and cooperate closely with experts in specific areas to enhance a comprehensive understanding of research objects and network deployment, and to design and deploy more suitable wireless sensor network for researches and methods for data collecting, analysis and presentation.
6.2.1. Problems
Although we made detailed designs and careful concerns to the problems of wireless sensor network deployment, but many challenges are still exist. Marcus Chang also summarized some lessons of monitoring in a high-Arctic environment [14]. We have gathered a lot of valuable experiences and lessons in addressing these challenges.
Long rainy weather will lead to less charge of a sensor node, and problem of packets loss will be more severe as energy depleting. The temperatures of Hulugou Subbasin are often below zero, it results in air of solar cells box condensing to water and shorting circuit of solar panels to bring a long-term packet loss. For the temperature impact, the clock of sensor nodes and relays will shift and will result in time synchronization inconsistencies for data transmission in a sensor network, the phenomenon of delays and packet loss will occur. In the development process of sensor network equipment and software, the principles of as simple as possible should be stressed, and code and algorithms must be able to match the specific application to avoid interaction between software, to reduce energy consumption a certain extent, and to reduce low storage capacity constraints of sensor nodes.
6.2.2. Experiences
Taking a serious investigation of environmental conditions of the monitored field before deployment, such as topography, climate conditions, the network signal coverage and so on, to study how environmental conditions affects the entire sensor network system. But we could not build a suitable model to fully express how environmental conditions affect the hardware and the entire system. Note that devices related the wireless sensor network should be labeled to inform the people our ongoing experiments.
Sensors of soil temperature and humidity should be saturated for all one night before deployment. If not, sensors buried in soil will lead to unstable and ineffective value for several days. The values would be normal until the probe of sensors were full saturated and mixed together with the surrounding soil.
For the lax of relay solar box packages, condensation water leaded to bring into the short circuit phenomenon. In addition, the light of relays and sensor nodes should not lit always, because the light could be a source of relatively large energy-consuming. Thus they should be shut off to save energy after the sensor finishing the role as a debugging tool. Many problems were encountered in carrying out observations in Wireless Sensor Network, and the experiences of addressing them will provide some reference for future work.
6.2.3. Main Concerns
As the features of limited energy, limited storage capacity and limited computing power of nodes in Wireless Sensor Network, low-power operating system and routing protocols should need to be developed. Routing protocols should be designed for some specific applications of sensor network, and there is no universal routing protocols suitable for any application. In addition, power supply for gateway should be fully protected to avoid data loss. Animals will also bring a bad effect to sensor network deployment, thus nodes bracket and cable should be reinforced.
6.2.4. Future Work
In the future, we will deploy a large number of sensor nodes in the long-term fine-grained Eco-hydrological elements observing environment to form lots of homogeneous or heterogeneous Wireless Sensor Networks. Large amounts of data produced by these networks will result in study need for a distributed sensor data access, integration, intensive calculations, and integration with the fixed-point observation data, simplify the operation of wireless sensor networks, visualize and effectively display the observed data through Web.
7. Acknowledgements
This research was supported by the Special Project of Information of the Chinese Academy of Sciences, “EScience environment of Ecology-Hydrological model integrated research in the Heihe river basin (INFO-115- D01)”, and the Incubation Foundation for Special Disciplines of the National Science Foundation of China (NSFC) (grant number: J0930003/J0109), and the “Ice, Snow and Permafrost environment Database (INFO-115- C01-SDB2-03).
REFERENCES
- L. H. Wang, et al., “Advance in Basin Eco-Hydrological Process Modeling,” Advances in Earth Science, Vol. 24, No. 8, 2009, pp. 891-898.
- P. Gong, “Progress in Recent Environmental Application of Wireless Sensor Network,” Journal of Remote Sensing, Vol. 14, No. 2, 2010, pp. 387-395.
- A. Zerger, R. A. Viscarra Rossel, D. L. Swain, T. Wark, R. N. Handcock, V. A. J. Doerr, G. J. Bishop-Hurley, E. D. Doerr, P. G. Gibbons and C. Lobsey. “Environmental Sensor Networks for Vegetation, Animal and Soil Sciences,” International Journal of Applied Earth Observation and Geoinformation, Vol. 2, No. 5, 2010, pp. 303- 316.
- W. R. Philip, A. G. Eric, F. A. Michael, C. F. Jason and C. H. Thomas, “Environmental Sensor Networks in Ecological Research,” New Phytologist, Vol. 182, No. 3, 2009, pp. 589-607. doi:10.1111/j.1469-8137.2009.02811.x
- S. S. O. Burgess, M. L. Kranz, N. E. Turner, R. CardellOliver and T. E. Dawson, “Harnessing Wireless Sensor Technologies to Advance Forest Ecology and Agricultural Research,” Agricultural and Forest Meteorology, Vol. 150, No. 1, 2010, pp. 30-37. doi:10.1016/j.agrformet.2009.08.002
- J. Yang, C. Zhang, X. Li, Y. Huang, S. Fu, et al., “Integration of Wireless Sensor Networks in Environmental Monitoring Cyber Infrastructure,” Wireless Networks, Vol. 16, No. 4, 2010, pp. 1091-1108. doi:10.1007/s11276-009-0190-1
- J. V Borre, D. Paelinckx, C. A. Mücher, L. Kooistra, B. Haest, G. D. Blust and A. M. Schmidt, “Integrating Remote Sensing in Natura 2000 Habitat Monitoring: Prospects on the Way Forward,” Journal for Nature Conservation, Vol. 19, No. 2, 2011, pp. 116-125. doi:10.1016/j.jnc.2010.07.003
- N. W. T. Quinn, R. Ortega, P. J. A. Rahilly and C. W. Royer, “Use of Environmental Sensors and Sensor Networks to Develop Water and Salinity Budgets for Seasonal Wetland Real-Time Water Quality Management,” Environmental Modelling & Software, Vol. 25, No. 9, 2010, pp. 1045-1058. doi:10.1016/j.envsoft.2009.10.011
- X. Zhu, D. Li, D. He, J. Wang, D. Ma and F. Li, “A Remote Wireless System for Water Quality Online Monitoring in Intensive Fish Culture,” Computers and Electronics in Agriculture, Vol. 71, No. 1, 2010, pp. 3-9. doi:10.1016/j.compag.2009.10.004
- S. Bonnot, S. Gianfranceschi, S. Smolders, M. Gilles, T. Holzer-Popp and M. Erlich, “GENESIS, a Flexible Solution for Building Networks of Collaborative Environmental Services,” IFIP Advances in Information and Communication Technology, Vol. 359, 2011, pp. 195- 207.
- C. Youn, S. Chandra, E. H. Fegraus, K. Lin and C. Baru, “TEAM Network: Building Web-Based Data Access and Analysis Environments for Ecosystem Services,” Procedia Computer Science, Vol. 4, 2011, pp. 146-155. doi:10.1016/j.procs.2011.04.016
- Y. Cheng, D. Y. Eun, Z. Qin, M. Song and K. Xing, “The Design of a Wireless Sensor Network for SeismicObservation-Environment Surveillance,” Lecture Notes in Computer Science, Vol. 6843, 2011, pp. 157-167. doi:10.1007/978-3-642-23490-3
- R. Chen, et al., “Hydrology, Ecology and Climate Significance and Its Research Progress of the Alpine Cold Desert,” Advance in Earth Science, Vol. 25, No. 3, 2010, pp. 255-263.
- M. Chang and P. Bonnet, “Monitoring in a High-Arctic Environment: Some Lessons from MANA,” IEEE Pervasive Computing, Vol. 9, No. 4, 2010, pp. 1-10. doi:10.1109/MPRV.2010.53