Journal of Water Resource and Protection
Vol.09 No.06(2017), Article ID:76158,12 pages
10.4236/jwarp.2017.96038
Treatment of Bullfrog Farming Wastewater in a Constructed Wetland
Fernanda de Freitas Borges*, Lúcia Helena Sipaúba Tavares
Laboratory of Limnology and Plankton Production, São Paulo State University―UNESP, Aquaculture Center, Jaboticabal, Brazil

Copyright © 2017 by authors and Scientific Research Publishing Inc.
This work is licensed under the Creative Commons Attribution International License (CC BY 4.0).
http://creativecommons.org/licenses/by/4.0/


Received: February 17, 2017; Accepted: May 13, 2017; Published: May 16, 2017
ABSTRACT
The aim of this study was to install and assess the efficiency of a constructed wetland for wastewater treatment from bullfrog farming (Lithobates catesbeianus) at fattening growth phase. Water detention time was not controlled since wastewater input flow varied according to the biomass of animals maintained in stalls. The study was divided into two phases, with higher and lower bullfrog biomass respectively for phase I and II. A higher removal of nitrite, biochemical oxygen demand, and thermotolerant coliforms was observed at phase I whereas a higher removal of turbidity, nitrate, total phosphorus, total suspended solids, total dissolved solids, and chlorophyll a occurred at phase II. Wastewater treatments using constructed wetland systems with high organic load require a higher water detention time for a better load removal. The treatment effect was positive since this wastewater flowed directly into fishponds or streams, which might promote eutrophication. Thus, wastewater treatment is essential to minimize the impact caused by frog farming on receiving water bodies, promoting the sustainability of this activity in Brazil.
Keywords:
Biomass, Eutrophication, Lithobates catesbeianus, Nutrient Removal, Water Quality

1. Introduction
Frog meat is highly appreciated around the world due to its good taste, high protein content, and high digestibility [1] . However, your development in natural environment is being affected due to factors as intensive agriculture, deforestation, and drainage of natural wetlands, exposing them to pollutants such as fertilizers, pesticides, and veterinary products. How in several regions the consumption of the bullfrog meat is provided from the capture of the animal in the nature and these conditions reduce the number of animals in the environment, increasing the need for bullfrog farming [2] .
Brazil is the largest bullfrog producer in South America and the second largest in the world, with an average annual production of 600 tons of frog meat [3] . Bullfrog has adapted well to Brazilian climate since 1935 consolidating frog farming in Brazil, once this species has competitive advantages in relation to native frogs due to its precocity, rusticity, and prolificacy being the most suitable for breeding in captivity [4] .
Bullfrog farming requires a large amount of water to remove excreta and feed residue, in producing a wastewater with high organic load, which may be a significant pollution source in the local environment. The main characteristics of this type of wastewater are the high concentrations of dissolved nutrients, especially ammonia and phosphorus, high electrical conductivity, and low dissolved oxygen concentration when compared with wastewater from other aquaculture activities [5] .
Due to the need for wastewater treatment from aquaculture activities, the use of constructed wetlands has been increasingly studied in recent years in Brazil [6] [7] [8] [9] in order to minimize their impacts on the environment. Constructed wetlands have aquatic plants that remove nutrients from the water using them for their own growth. When compared with conventional treatments, these systems require a lower investment and operating cost [7] and higher versatility in removing nitrogen, phosphorus, biochemical oxygen demand, solids, and thermotolerant coliforms [10] . However, several abiotic factors, such as area availability, plants used, temperature, water flow, and detention time, can affect the operational efficiency of constructed wetlands [11] .
Studies on treatment of frog farming wastewater using constructed wetlands are still scarce in the literature. Therefore, the aim of this study was to install a constructed wetland to treat bullfrog farming wastewater and assess the removal efficiency of nutrients and thermotolerant coliforms. Since the use of this technique could reduce the release of nutrients and other harmful substances into water bodies, preventing their eutrophication.
2. Materialsand Methods
2.1. Study Area and Stall Management
The study was carried out at the Frog Farming Sector of the Aquaculture Center (Caunesp) located in the São Paulo State University (21˚15'S, 48˚18'W), Jaboticabal, São Paulo, Brazil. This sector is composed of two sheds constructed according to the amphifarm system with a total area of 144 m2. One of the sheds has eight stalls of 12 m2 each, totaling 96 m2, and it is used for housing animals at fattening phase; the other shed has 16 stalls of 3 m2 each, totaling 48 m2, and it is used for housing animals at post-metamorphic phase.
The fattening phase last from 90 to 120 days, depending on local temperature and animal nutrition. Stalls were composed of shelters, feeding trough, and pools arranged linearly. An uninterrupted water flow was maintained in the pools in order to carry residues and excreta out of the stall. Cleaning was carried out daily and consisted of complete emptying and washing the ponds. Water volume was approximately 350 L in the largest stall’s pond and 50 L in the smallest. The larger stalls presented a continuous water flow of 0.03 L・s−1, totaling a daily volume of approximately 2942 L when considering the pools volume.
2.2. Constructed Wetland
Caunesp system consists of six ponds for fish, shrimp, and bullfrog farming. Bullfrog wastewater flows downstream directly into one of the ponds that compose this system and subsequently into a local stream. The constructed wetland was designed in order to use the available area for installing the wastewater treatment system, which accounting for 10% of the total stall area, with dimensions of 23 m × 0.62 m (14.3 m2) and a total volume of 2.2 m3.
In addition, the wetland presented three compartments with volumes of 0.51 m3, 0.72 m3, and 0.93 m3 and interconnected by channels with surface water flow. The first compartment was used only for solid residue sedimentation; the second compartment was filled with the floating macrophytes Eichhornia crassipes; and the third compartment was planted with the emerged macrophytes Typha domingensis and Cyperusgiganteus (Figure 1).
Floating macrophytes were completely replaced monthly by new plants whereas the emerged macrophytes were completely replaced at the end of each phase (120 days). This procedure was performed to ensure the efficiency of nutrient uptake by the new plants.
2.3. Sampling
Water quality sampling was carried out in phases I and II. Phase I (PI) corresponded to the period between July and October 2012 (120 days), in which animals presented a higher biomass, with an average weight of 276 g. Phase II (PII) corresponded to the period from December 2012 to March 2013 (120 days), in which animals presented lower biomass, with an average weight of 29 g. Total biomass of animals in the stall at PI was 351 kg and at PII was 218 kg.
A lower number of animals, but with a higher body weight, was maintained in the stalls at PI. These animals were remaining from the previous reproductive cycle. On the other hand, a higher number of animals, but with a lower body weight, was used at PII. These animals were from spawning occurred between November and October and were at fattening phase until the end of March, close to the reproductive cycle.
Limnological parameters of input and output wastewater in the wetland were analyzed monthly, total eight samples for PI (4 samples) and PII (4 samples).
2.4. Hydrological Variables
Water detention time was calculated by the equation t = V/Q, where t is the water detention time (h), V is the wetland volume (m3), and Q is the flow rate (m3・h−1). The nutrient load was calculated according to the equation l = N × Q,

Figure 1. Location and layout of the constructed wetland at the Frog Farming Sector of the Aquaculture Center located in the São Paulo State University, Jaboticabal, SP, Brazil. I = input point where the bullfrog farming wastewater entered the constructed wetland; O = output point where treated wastewater exited the constructed wetland entering directly in a fishpond.
where l is the nutrient load (g・h−1), N is the nutrient concentration (g・L−1), and Q is the flow rate (m3・h−1). Nutrient removal efficiency was calculated as the equation r = [(Ni − No)/Ni] × 100, where r is the nutrient removal efficiency (%), Ni is the nutrient input concentration, and No is the nutrient output concentration. The load to biomass ratio was calculated by multiplying the nutrient load by 120 days of the experiment at each phase and then dividing by the total biomass value, with the result in grams of nutrient per kilogram of animal biomass.
2.5. Limnological Variables
Temperature (T), pH, dissolved oxygen (DO), electrical conductivity (EC), and turbidity (Turb) were measured by using a Horiba U-10 multi-parameter probe. Total phosphorus (TP), orthophosphate (PO4), nitrate (NO3), and nitrite (NO2) was quantified by aspectrophotometer according to Golterman et al. (1978) [12] , and ammonia (NH3) according to Koroleff (1976) [13] . Chlorophyll a (Chlorop) was extracted with 90% ethanol and quantified in a spectrophotometer at 663 and 750 nm [14] . Total suspended solids (TSS), total dissolved solids (TDS), and biochemical oxygen demand (BOD) were determined according to Boyd and Tucker (1992) [15] , and alkalinity (Alk) according to Mackereth et al. (1978) [16] .
For thermotolerant coliforms (TC) analysis, water samples were collected in sterile 500-mL bottles and quantified by using the multiple-tube method (MPN), as described by Greenberg et al. (1992) [17] .
2.6. Statistical Analysis
Variations between limnological data of input and output points in the wetland at each phase (PI and PII) were analyzed by the one-way ANOVA test at 0.05 significance level to determine the occurrence of significant differences between points.
In order to visualize the effect of the amount of biomass on the input wastewater quality in the wetland at both phases (PI and PII), the multivariate analysis of Principal Component Analysis (PCA) was used to reduce the dimensionality of the data in a two-dimensional graph (biplot). The software Statistica 7.0 [18] was used in all analyses.
3. Results
At PI, the limnological variables pH and DO presented the highest values (p < 0.05) in the wetland’s output point whereas Turb, NO3, NO2, TSS, BOD, and TC presented the highest values (p < 0.05) in the input point. At PII, values of the limnological variables Turb, NO3, NO2, TSS, and TC presented the highest values (p < 0.05) in the input point whereas DO and NH3 presented the highest values (p < 0.05) in the wetland’s output point. At both phases, an increase in DO can be observed in the output point in relation to the input point.
The highest values of NH3, TP, TSS, and TC were observed at PI in the wetland’s input point whereas the highest values of NO2, TDS, BOD, and Chlorop were observed at PII. The value of NO2 was approximately two times higher in the wetland’s input point at PII; NH3 and TSS also presented the highest values in the input point at PI, as is show in Table 1.
Principal component analysis applied to the data of input wastewater retained in the first two components 65.9% of the total data variability, with 42.1% in the first component and 23.8% in the second component. Components 1 and 2 separated PI from PII for input wastewater. In component 1, PI was associated with EC, Alk, PO4, TP, TSS, NH3, and TC whereas PII was associated with T, TDS, and NO3. In component 2, PI was associated with pH and DO, and PII with Turb, NO2, Chlorop, and BOD, as is show in Figure 2.
Collected wastewater corresponded to 100% of that generated in the stalls by animals at fattening growth phase, with a water detention time of 1.4 h at PI and 2.8 h at PII. Output flow rates were 1.6 and 0.8 m3・h−1 at PI and PII, respectively,

Table 1. Average, minimum, maximum, and standard deviation values of limnological parameters measured in the input and output points of the constructed wetland at phases I and II.
T: temperature; EC: electrical conductivity; Turb: turbidity; Alk: alkalinity; DO: dissolved oxygen; NO3: nitrate; NO2: nitrite; NH3: ammonia; PO4: orthophosphate; TP: total phosphorus; TSS: total suspended solids; TDS: total dissolved solids; BOD: biochemical oxygen demand; TC: thermotolerant coliforms; Chlorop: chlorophyll a; **: significant values (p < 0.05); NS: not significant values.
being related to the total biomass of animals. At PI, the total biomass of animals, nutrient loads, and the NH3 load to biomass ratio were higher when compared to PII, as is show in Table 2.
Table 2. Total biomass, individual weight, wastewater flow rate, nutrient loads, and nutrient load to biomass ratio at phases I and II.
NH3: ammonia; TP: total phosphorus.
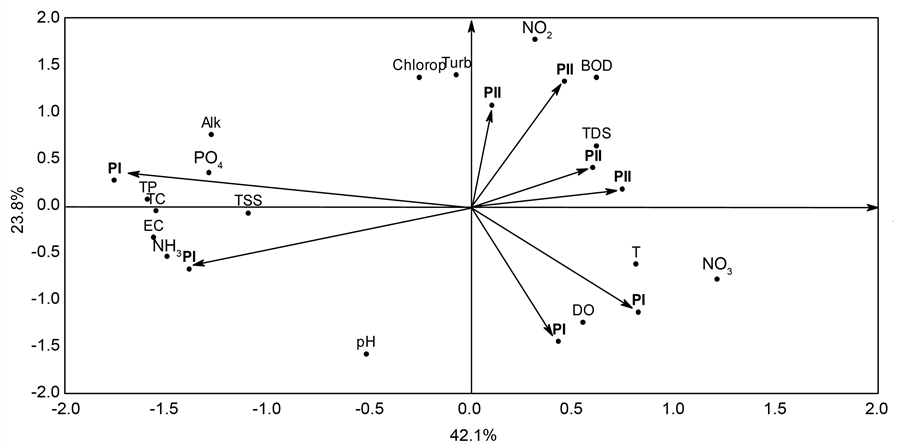
Figure 2. Biplot graph of Principal Component Analysis of the correlation matrix between concentrations of limnological variables of wastewater after treatment and studied phases (PI: phase I; PII: phase II).
Efficiency removals of more than 90% were observed for TC, 60% for TSS, 50% for Turb and NO3, 40% for NO2, 15% for TP, and 5% for BOD at PI. On the other hand, at PII, more than 85% of efficiency removal was observed for TSS and TC, 70% for Turb and NO3, 40% for NO2 and TDS, 20% for TP and Chlorop, and 5% for BOD, as is show in Figure 3.
A relationship was observed between animal biomass, ammonia load, and nutrient removal rate. The higher the biomass, the higher the ammonia load and lower the removal rate. At the phase with a higher total biomass, water detention time was lower due to the need of a higher water flow. In addition, at this phase, animal presents a higher body weight, which may worse feed conversion and, consequently, increase the waste released into the water. To produce one kilogram of bullfrog a higher amount of ammonia is accumulated into water in the fattening phase.

Figure 3. Removal efficiency (%) of limnological variables between input and output wastewater in the constructed wetland at phases I and II.
4. Discussion
Comparing with a wastewater treatment of fish farming composed of only Eichhornia crassipes [19] , the values of pH and Alk were similar and those of EC was higher in this study. Due to the excess of organic matter, which, in the decomposition process, releases carbonic gas and forms carbonate and bicarbonate, responsible for an increased alkalinity and pH stabilization, together with the release of ions to water, increasing EC values.
The average concentrations of DO were, in general, low at both phases. Lower values were found in the input point due to an intenseorganic matter decomposition process, leading to higheroxygen consumption. In contrast, this value increased to the output point due to the gas exchange between plants and the atmosphere, leading to water oxygenation. The oxygen captured by macrophytes leaves is taken from the stem to the roots to meet the respiratory demand of tissues and oxygenate the rhizosphere. Thus, the exit of oxygen from roots to the environment creates conditions for the oxidation and decomposition of organic matter [20] .
An increase in NH3 was observed at both phases from the input to the output points of the constructed wetland due to the high organic load from frog farming such as feces, urine, and remnants of skin and food, leading to a higher decomposition in relation to the removal. In addition, an increase in PO4 was observed, which is in accordance with Lin et al. (2005) [21] , who used a constructed wetland to treat wastewater from intensive shrimp farming. Furthermore, TP removal was lower than that observed by Schulz et al. (2003) [22] in a constructed wetland to treat wastewater from fish farming using emerged macrophytes and subsurface water flow. This may have occurred because fish farming wastewater presents a lower phosphorus load when compared to frog farming.
Removals of Turb and TSS presented values between 50% and 64% at PI and between 72% and 89% at PII, which is due to residue sedimentation along the wetland. In fish farming wastewater treatment, Schulz et al. (2003) [22] observed 97% of removal of particulate material by using emerged macrophytes.
Ina constructed wetland for aquaculture wastewater treatment, Sipaúba-Ta- varesand Braga (2008) [23] observed higher concentrations of chlorophyll and lower concentrations of BOD. On the contrary, lower contents of Chlorop and higher of BOD were found in this study, which may be due to the greater water flow in the stalls, hindering phytoplankton development and leading to lower chlorophyll a concentrations. BOD removal process was a result of suspended solid filtration and sedimentation and organic matter oxidation by bacteria. Thus, despite the occurrence of sedimentation, the oxidation was low, increasing the biochemical demand for oxygen.
The best removal efficiencies were found for TC, with values of 93% at PI and 87% at PII, demonstrating the importance of macrophytes in removing microorganisms and suspended material since this removal range can reach more than 80% [8] [24] . According to Diniz et al. (2005) [25] , roots are covered with an organic and mucilaginous material, allowing the formation of a periphytic community and microorganisms, which help the water purification process.
Wastewater nutrient load influences the wetland’s capacity in removing compounds, with a negative relationship between load and removal percentage [21] . This fact was observed mainly for TC since the higher the load was, the lower the removal rate. Phosphorus load is in accordance with Borges et al. (2012) [5] , who studied bullfrog at fattening phase in an amphifarm system. In contrast, the NH3 load was higher in this study, which may be associated with a higher animal biomass due to animal excretion and feeding.
A factor that may contribute to increased ammonia in the wastewater is the amount of crude protein present in the feed and the component digestibility that composed of bullfrog diet. Furthermore, the low intake of feed by the animals it causes a greater amount of nitrogen released into the water due to leaching of the feed. There is no on the market yet a specific commercial diet for bullfrog, but many studies are being made on formulations and digestibility aiming at the adequate quantity of protein and the best use of nutrients present in the diet [26] [27] [28] [29] .
The improvement in feed conversion and the management in order to reduce food waste, result in improving water quality and reducing costs, contributing to the sustainability of the activity [30] .
An important aspect for increase the nutrient removal efficiency in wetlands is the periodic removal of old macrophytes since these plants have a limited capacity to store nutrients and organic matter [6] . When support capacity is reached, leads to a low production or biomass loss and nutrients stored return to wastewater [31] .
Regarding the dimensions of a constructed wetland, it is desirable that it occupies small areas, saving space for other activities. Some studies have shown large variations between wetland size for treatment of effluent from fish and shrimp farming [32] [33] . However, other studies show that the wetland capacity in removing pollutants is related to the nutrients load of wastewater, in which the higher load the lower the nutrient removal [31] . In this sense, the constructed wetland can need a larger area, with a longer water detention time, for better nutrient removal efficiency.
The small size of the wetland and, consequently, a low water detention time and high organic load from the daily cleaning of stalls for bullfrog management in the Frog Farming Sector may be associated with the process of macrophyte saturation and sedimentation due to organic matter and nutrient accumulation. Increased ammonia was probably influenced by a reduced concentration of dissolved oxygen, which prevented nitrification and denitrification process.
The impacts of frog farming production on the environment are still little explored. Because of this, constructed wetlands play an important role in the treat- ment of frog farming wastewater, which, in addition to presenting high contents of organic matter, most of the time it is released directly into streams and rivers, causing negative impact on natural and artificial water bodies (e.g. fishponds) [34] .
5. Conclusion
It was concluded that there was significant improvement in the quality of the wastewater from the bullfrog farming. And, therefore, the treatment used was adequate, and it could be used in commercial farms, with only a few adjustments being made to improve the nutrient removal efficiency.
Acknowledgements
The authors are grateful to CAPES (Coordination for the Improvement of Higher Education Personnel) for granting the doctoral scholarship.
Cite this paper
de Freitas Borges, F. and Tavares, L.H.S. (2017) Treatment of Bullfrog Farming Wastewater in a Constructed Wetland. Journal of Water Resource and Protection, 9, 578-589. https://doi.org/10.4236/jwarp.2017.96038
References
- 1. Pires, C.V., Oliveira, M.G.D.A., Rosa, J.C. and Costa, N.M.B. (2006) Qualidade nutricional e escore químico de aminoácidos de diferentesfontesproteicas. Ciência e Tecnologia dos Alimentos, 26, 179-187.
https://doi.org/10.1590/S0101-20612006000100029 - 2. Spear, P.A., Boily, M., Giroux, I., Deblois, C., Leclair, M.H., Levasseure, M. and Leclair, R. (2009) Study Design, Water Quality, Morphometrics and Age of the Bullfrog, Rana catesbeiana, in Sub-Watersheds of the Yamaska River Drainage Basin, Québec, Canada. Aquatic Toxicology, 91, 110-117.
- 3. Cribb, A.Y., Carvalho, L.T. and Mendonça, R.C.S. (2009) O consumo de carne de rã: Caracterização, tendências e perspectivas. Documents 75, Embrapa Agroindústria de Alimentos, Rio de Janeiro.
- 4. Ferreira, C.M., Pimenta, A.G.C. and Paiva-Neto, J.S. (2001) Introdução à ranicultura. Boletim Técnico do Instituto de Pesca, 33, 2-16.
- 5. Borges, F.F., Amaral, L.A. and Stéfani, M.V. (2012) Characterization of Effluents from Bullfrog (Lithobates catesbeianus, Shaw, 1802) Grow-Out Ponds. Acta Limnologica Brasiliensia, 24, 160-166.
https://doi.org/10.1590/s2179-975x2012005000035 - 6. Henry-Silva, G.G. and Camargo, A.F.M. (2006) Efficiency of Aquatic Macrophytes to Treat Nile Tilapia Pond Effluents. Scientia Agricola, 63, 433-438.
https://doi.org/10.1590/S0103-90162006000500003 - 7. Sipaúba-Tavares, L.H and Braga, F.M.S. (2008) Constructed Wetland in Wastewater Treatment. Acta Scientiarum. Biological Sciences, 30, 261-265.
- 8. Travaini-Lima, F. and Sipaúba-Tavares, L.H. (2012) Efficiency of a Constructed Wetland for Wastewaters Treatment. Acta Limnologica Brasiliensia, 24, 255-265.
https://doi.org/10.1590/s2179-975x2012005000043 - 9. Millan, R.N., Sipaúba-Tavares, L.H. and Travaini-Lima, F. (2014) Influence of Constructed Wetland and Soil Filter Systems in the Dynamics of Phytoplankton Functional Groups of Two Subtropical Fish Farm Wastewaters. Journal of Water Resource and Protection, 6, 8-15.
https://doi.org/10.4236/jwarp.2014.61002 - 10. Maltais-Landry, G., Maranger, R., Brisson, J. and Chazarenc, F. (2009) Nitrogen Transformations and Detention in Planted and Artificially Aerated Constructed Wetlands. Water Research, 43, 535-545.
- 11. Chung, A.K.C., Wu, Y., Tam, N.F.Y. and Wong, M.H. (2008) Nitrogen and Phosphate Mass Balance in a Sub-Surface Flow Constructed Wetland for Treating Municipal Wastewater. Ecological Engineering, 32, 81-89.
- 12. Golterman, H.L., Clymo, R.S. and Ahnstad, M.A.M. (1978) Methods for Physical and Chemical Analysis of Freshwaters. 2nd Edition, Blackwell Scientific Publication, Oxford.
- 13. Koroleff, F. (1976) Determination of Nutrients. In: Grasshof, E. and Kremling, E., Eds., Methods the Seawater Analysis, Verlag Chemie Weinhein, New York.
- 14. Nusch, E.A. (1980) Comparison of Different Methods for Chlorophyll and Pheopigments Determination. Archiv für Hydrobiologie, 14, 14-36.
- 15. Boyd, C.E. and Tucker, C.S. (1992) Water Quality and Pond Soil Analysis for Aquaculture. Agricultural Experiment Station, Alabama.
- 16. Mackereth, F.J.H., Heron, J. and Talling, J.F. (1978) Water Analysis: Some Revised Methods for Limnologists. Scientific Publications Freshwater Biological Association, London.
- 17. Greenberg, A.E., Clesceri, L.S. and Eaton, A.D. (1992) Standard Methods for Examination of Water and Wastewater. American Public Health Association, Washington DC.
- 18. Statsoft Inc. (2007) Statistical Data Analysis Software System. Version 8.0. World Wide Web Electronic Publication.
http://www.statsoft.com - 19. Sipaúba-Tavares, L.H., Fávero, E.G.P. and Braga, F.M.S. (2002) Utilization of Macrophyte Biofilter in Effluent from Aquaculture: I. Floating Plant. Brazilian Journal of Biology, 62, 713-723.
https://doi.org/10.1590/S1519-69842002000400019 - 20. Brix, H. (1994) Functions of Macrophytes in Constructed Wetlands. Water Science and Technology, 29, 71-78.
- 21. Lin, Y.F., Jing, S.R., Lee, D.Y. and Wang, T.W. (2002) Nutrient Removal from Aquaculture Wastewater Using a Constructed Wetlands System. Aquaculture, 209, 169-184.
- 22. Schulz, C., Gelbrecht, J. and Rennert, B. (2003) Treatment of Rainbow Trout Farm Effluents in Constructed Wetland with Emergent Plants and Subsurface Horizontal Water Flow. Aquaculture, 217, 207-221.
- 23. Mercante, C.T.J., Vaz-dos-Santos, A.M., Moraes, M.D.A.B., Pereira, J.S. and Lombardi, J.V. (2014) Bullfrog (Lithobates catesbeianus) Farming System: Water Quality and Environmental Changes. Acta Limnologica Brasiliensia, 26, 9-17.
https://doi.org/10.1590/s2179-975x2014000100003 - 24. Pinto, F.R., Henares, M.N.P., Cruz, C. and Amaral, L.A. (2010) Remoção de Escherichia coli de efluentes de carciniculturapor macrófitas aquáticas flutuantes. ARS Veterinaria, 25, 147-150.
- 25. Diniz, C.R., Ceballos, B.S.O., Barbosa, J.E.L. and Konig, A. (2005) Uso de macrófitas aquáticas como solução ecológica para melhoria da qualidade de água. Revista Brasileira de Engenharia Agrícola e Ambiental, 9, 226-230.
- 26. Mouriño, J.L.P. and Stéfani, M.V.D. (2006) Evaluation Methods of Feces Collection for Determination of Protein Digestibility in Bullfrog (Rana catesbeiana). Ciência Rural, 36, 954-958.
- 27. Castro, J.C., Barboza, W.A., Silva, K.K.P. and Pires, S.C. (2008) Níveis de energiametabolizável para rações de rã-touro. Boletim do Instituto de Pesca, 34, 519-525.
- 28. Dias, D.D.C., De Stéfani, M.V., Ferreira, C.M., França, F.M., Ranzani-Paiva, M.J.T. and Santos, A.A. (2010) Haematologic and Immunologic Parameters of Bullfrogs, Lithobates catesbeianus, Fed Probiotics. Aquaculture Research, 41, 1064-1071.
- 29. Seixas Filho, J.T., Navarro, R.D., Silva, L.N. and Souza, L.N. (2011) Alimentação de girinos de rã-touro com diferentes níveis de proteína bruta. Ciência Animal Brasileira, 12, 250-256.
https://doi.org/10.5216/cab.v12i2.8029 - 30. Castro, C.S., Argentim, D., Novelli, P.K., Costa, J.M., Menezes, C.S.M., Neto, A.C. and Agostinho, C.A. (2014) Feed Digestibility and Productive Performance of Bullfrogs Raised in Cages and Fed in Different Periods and High Frequency. Aquaculture, 433, 1-5.
- 31. Biudes, J.F.V. and Camargo, A.F.M. (2010) Uso de macrófitas aquáticas no tratamento de efluentes de aquicultura. Boletim Ablimno, 38, 1-10.
- 32. Lin, Y.F, Jing, S.R., Lee, D.Y., Chang, Y.F, Chen, Y.M. and Shih, K.C. (2005) Performance of a Constructed Wetland Treating Intensive Shrimp Aquaculture Wastewater under High Hydraulic Loading Rate. Environmental Pollution, 134, 411-421.
- 33. Schwartz, M.E. and Boyd, C.E. (1995) Constructed Wetlands for Treatment of Channel Catfish Pond Effluents. The Progressive Fish-Culturist, 57, 255-266.
2.3.CO;2>https://doi.org/10.1577/1548-8640(1995)057<0255:CWFTOC>2.3.CO;2 - 34. Borges, F.F., Stéfani, M.V. and Amaral, L.A. (2014) Quality of the Effluents of Bullfrog Tadpole Ponds. Boletimdo Instituto de Pesca, 40, 409-417.