Journal of Water Resource and Protection
Vol.5 No.1(2013), Article ID:27070,10 pages DOI:10.4236/jwarp.2013.51003
Assessment of Water Quality of the Trans-Boundary Zarafshan River in the Territory of Uzbekistan
1Department of Applied Ecology, National University of Uzbekistan, Tashkent, Uzbekistan
2Department of Geography, Philipps-Universität Marburg, Marburg, Germany
Email: rashidkulmatov@yahoo.com
Received October 30, 2012, revised November 29, 2012; accepted December 7, 2012
Keywords: Trans-Boundary River; Zarafshan River; Water Pollution; Water Discharge; Collector-Drainage Discharge; Sewage
ABSTRACT
The Zarafshan river is a main trans-boundary river of the Aral Sea basin. As the main water resource, the Zarafshan river water is mainly used by the republics of Tajikistan and Uzbekistan. We explored the trends of space-time pollution of river water with ammonium, nitrates, phosphates, biological oxygen demand (ВОD), fluorine and some heavy metals at seven water sampling points along the Zarafshan River in Uzbekistan. The experimental data showed that the water quality of the Zarafshan river in 2002-2009 has undergone a considerable transformation, even by the length of the river. The chemical composition of the Zarafshan river water underwent changes due to the agricultural collector-drainage discharges and the sewage of the cities of Samarkand and Navoi. The water pollutants of the Zarafshan river, as a consequence of the agricultural pollution, consisted of mineralization, ammonium, nitrate, phosphate, and pesticides. Therefore, it is necessary to monitor the chemical composition of the large agricultural collector-drainage discharges into the river. The main sources of the heavy metals (primarily arsenic and zinc) in the Zarafshan river water were probably ore processing manufactures located in territory of Tajikistan.
1. Introduction
The origin of the Zarafshan river (contained within the topographical realm of the Amudarya basin) commences in Tajikistan. Also, a considerable part of this river basin is found in the Republic of Uzbekistan. The head waters of the Zarafshan river begin in Tajikistan at the Zeravshansky glacier. This glacier is located specifically in a mountain knot of Mt. Cokcy wherein there is a joint of the Turkestansky and Zeravshansky ridges. This occurs at an elevation of 2800 meters above sea level. The length of the Zarafshan river is 781 km; the drainage basin area is 143,000 km2. The average long-term water flow discharge amounts to 190 m3/sec, with the average long-term discharge of the river water being 5.103 km3 [1,2].
The Zarafshan river is a representative of the rivers having a glacier-snow feed. The increase of water discharge begins in April and increases generally each month until July, when it passes its high water (flood) period. The recession of the discharge river flow commences in August and continues until February-March, when it reaches its minimum discharge point [1,2].
The irrigated lands of the Zarfshan river basin within the Republic of Uzbekistan, which is part of the administrative division located in provinces of Samarkand and Navoi. The lower part of the Zarafshan river basin is fed by waters from the Amudarya through the Amu-Bukhara irrigation canal [2]. Published works by Kulmatov and Hoshimhodjaev [3] and Toderich [4] deal with investigations conducted concerning the qualities and quantities of the Zarafshan river water. The qualities of the river water for the short period dealt with the contents of heavy metals and others pollutants have been also investigated.
The economic situation and the prospects for the development of the economy of the Zarafshan river basin have also been analyzed [2,5]. The distributions of diseases along the Zarafshan river basin have been studied by using GIS technologies [6,7]. Olsson et al. [8] studied the long-term changes of the Zarafshan river discharge by using hydrological models. However, published works that are available have not included any studies dealing with the long-term trends of space-time distributions of some pollutants of the Zarafshan river.
Previously, we have studied the space-time changes of the general mineralization, concentrations of nitrites, phenol, mineral oil and copper at four water sampling points along the Zarafshan river [5]. In this study, we continue our investigation on the space-time of changing trends of concentrations of ammonium, nitrates, phosphates, ВОD, fluorine and some heavy metals at seven water sampling points in the Zarafshan river in 2002-2009.
2. Materials and Methods
The map of the Zarafshan river basin is shown in Figure 1. As can be seen, the upstream part of the river basin is located in the territory of Tajikistan, the middle and downstream parts of the river are in the territory of Uzbekistan. For this study, the following seven water sampling points were chosen in the territory of Uzbekistan:
P1—Ravathodja (on the Tajik-Uzbek border);
P2—The city of Samarkand, 1.5 km above of the Akdarya water division;
P3—The city of Samarkand, 0.5 km above the Siab collector;
P4—The city of Samarkand, 3.7 km below the mouth collector of Taligulyan;
P5—The settlement of Hatirchi (at the horn of the Karadarya river);
P6—The city of Navoi, 1 km above the discharges of waste water at the Navoiazot factory;
P7—The city of Navoi, 0.8 km below the discharges of waste water at the Navoiazot factory.
The selected seven water sampling sites (P1 - P7) and main collectors’ discharges in the Uzbekistan part of the Zarafshan river are presented in Figure 2.
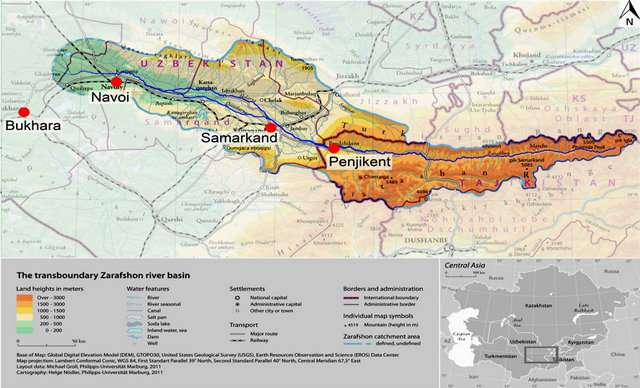
Figure 1. The map of Zarafshan river basin.
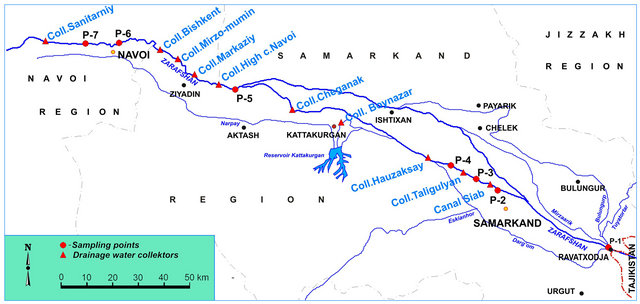
Figure 2. Water sampling sites (P1 - P7) and main collectors’ discharges into the Zarafshan river.
Water Analysis
Water samples collected were analyzed at the laboratory of the Hydrometeorological Research Institute (NIGMI) in Tashkent, Uzbekistan, by using standard analysis methods [9]. By using spectrophotometric, photometric and atom absorption methods, the concentrations of ammonium, nitrate, fluorine, zinc, arsenic, iron, and chromium were analyzed, respectively. The chloroorganic pesticides (α-ГХЦГ, µ-ГХЦГ, DDТ and its metabolites DDE and DDD) were analyzed by gas chromatography methods [9].
3. Results and Discussion
Data regarding the concentrations of the polluting substances that were analyzed at seven sampling sites of the Zarafshan river are given in Figures 3-10. In Figures 3- 10, the average annual concentrations of water pollutants are given. Note that the data for 2007 is not available here due to some technical reasons.
3.1. Ammonium
In Uzbekistan, the maximum allowable concentrations (MAC) value for ammonium is 0.39 mg/L. Space-time fluctuations of the concentration of ammonium for the investigated period were in range of 0.01 - 0.12 mg/L (Figure 3). In 2002, concentrations of ammonium at the sampling sites of Samarkand, 0.5 km below the of the discharge of waste waters (Р3), and 3.7 km below the discharge of waste waters (P4) were found to be two times higher than the average concentrations of ammonium of the river channel. In 2008 and 2009, at the sampling sites of the city of Navoi, which was 0.8 km below the discharge sites of waste waters from the Navoiazot factory, it was found to be rather high averages for concentrations of ammonium (0.1 - 0.12 mg/L). On the whole, the ammonium concentration of the Zarafshan river channel did not exceed the MAC values for surface waters.
3.2. Nitrate
In Uzbekistan, the MAC value for NO3 is 45 mg/L (N-NO3). In the river water, concentrations of nitrates gradually rise from the sampling sites Ravathodja to the sampling site of the city of Navoi, which was 0.8 km below the discharge areas of waste waters from the Navoiazot factory (P7). The high concentrations of nitrates, which amounted to 1 mg/L at the Ravathodia sampling site, were noted in 2003 and 2008 (Figure 4). Probably, these were connected with discharges of nitrates which originated in waste waters from the Tajikistan part of the river. The average high concentrations of nitrates of the river channel in 2002, 2005, and 2006 were noted in the sampling site, which was located 0.5 km below the sites near the city of Samarkand. Again, the probable sources of these are the discharges of industrial and agricultural waste waters from Samarkand and the Samarkand province. For the period of the space—time continuum, the concentration fluctuations of nitrate concentration constituted 0.52 - 3.60 mg/L, which is equal to 0.2 - 0.3 MACs.
3.3. Phosphate
At the sampling point of Ravathodja, for all the aforementioned periods, the concentrations of phosphates were insignificant; in fact, merely 0.001 - 0.005 mg/L (Figure 5). In the period of 2005-2008, rather high concentrations of phosphates at the sampling site of the city Navoi, 0.8 km below the discharges of waste waters from the Navoiazot factory (P7) were noted. High concentrations of phosphates were constantly found to be characteristic for the sampling site of Samarkand located 0.5 km above the Siab collector, which is probably related to discharges of industrial and agricultural sewages from Samarkand city and the Samarkand province.

Figure 3. Concentration of ammonium in the Zarafshan river water in 2002-2009.
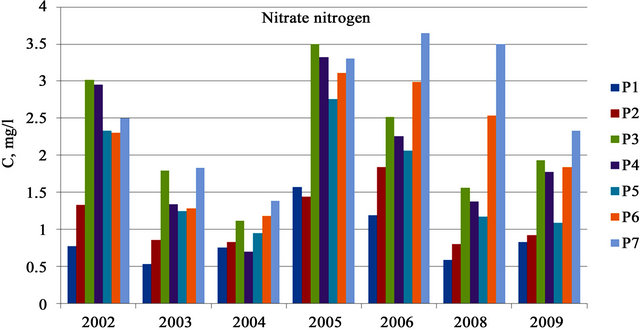
Figure 4. Concentration of nitrate in the Zarafshan river water in 2002-2009.

Figure 5. Concentration of phosphate in the Zarafshan river water in 2002-2009.
3.4. Fluorine
The MAC level of fluorine is 0.75 mg/L in Uzbekistan. In the river water at the sampling site Ravathodja, the concentration of fluorine was on average about 0.2 mg/L for the investigated period. In the Uzbek part of the river, the concentrations of fluorine gradually rose (Figure 6). It is known that the composition of phosphoric fertilizers contains fluorine as a residual element [10-12]. Consequently, fluorine has been found in the collector-drainage waters into the river water. On the whole, the concentration of fluorine still did not exceed the MAC value at the river channel.
3.5. Biological Oxygen Demand (BOD)
In Uzbekistan, the MAC value is 3.0 mg О2/L. In the Uzbek part of the river channel, there was an evidence of a gradual increase of concentrations of dissolved oxygen (Figure 7). At the Ravathodja sampling site, the concenrations of BOD were on average 0.8 - 1.9 mg/L for all of the investigated periods. The concentrations of BOD rose throughout the entire length of the river channel. Very high concentrations of BOD have been discovered in the sampling sites, P2 - P5, for the periods of 2002 and 2004. There were also some increasing concentrations of BOD at the sampling sites of Р6 and Р7 in 2005 and 2006. The oxygen concentration of the river water during the investigated period was adequate with the concentrations of the dissolved oxygen at the level of 0.6 - 2.5 mg О2/L.
3.6. Heavy Metals
In the rivers water arid zone, heavy metals are present in different forms, such as ions, simple inorganic complexes, complexes with organic microand macromolecules (e.g. humic substances), as well as in the form of the metals adsorbed on the surface of suspended matter [13]. Uzbekistan’s national water quality standard estimates of total metal concentrations and MAC values are provided for the total metal concentrations.
3.7. Iron
Unfortunately, the sensitivity of method employed in measuring of the iron in the river waters is inadequate when dealing with such minute quantities of iron wherein they are, for instance, at the level of 0.01 - 0.02 mg/L of iron (Figure 8). Concentrations of iron fluctuated from 0.01 to 0.15 mg/l, which is below that of MAC value (0.5 mg/L) for iron.

Figure 6. Concentration of fluorine in the Zarafshan river water in 2002-2009.
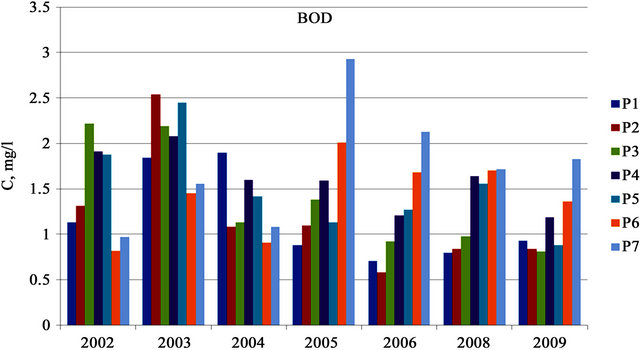
Figure 7. Concentration of BOD in the Zarafshan river water in 2002-2009.
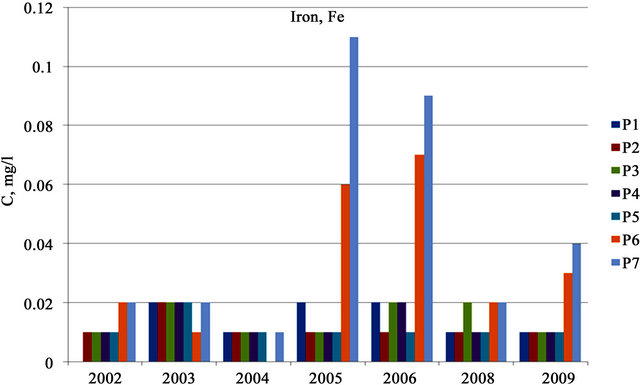
Figure 8. Concentration of iron in the Zarafshan river water in 2002-2009.
3.8. Arsenic
The MAC value for arsenic is 0.05 mg/L in Uzbekistan. Concentrations of arsenic were noted to be high in all periods for the research done on the sampling site of Ravathodja. High concentrations of arsenic in the sampling site Ravathodja were probably connected with the discharges from the ore processing enterprise located in the territory of the Republic of Tajikistan (Figure 9). There was a considerable decrease in arsenic concentrations noted for the period of 2003-2004, which was due to the reduction of ore processing. In 2005, the indiscriminate discharge of waste water from these enterprises resulted in the increased concentrations of arsenic (5.5 µg/L). In Uzbekistan, in 2002, the maximum concentration of arsenic was more than 2 µg/L and in 2005, it was 5.5 µg/L. For the period of 2003-2009, the sampling sites revealed about 0.1 µg/L of arsenic for both areas of the city of Navoi (1 km above the discharges of waste water at the Navoiazot factory) and (0.8 km below the discharges of waste water at the Navoiazot factory). The sensitivity of the method employed here was still low.
3.9. Chromium
The MAC values for Cr(VI) and Cr(III) are 0.001 mg/L and 0.5 mg/L, respectively. Concentrations of Cr(VI) in the Ravathodja sampling site were on average 0.2 - 0.5 µg/L. Rather high concentrations of Cr(VI) at the Navoi city sampling sites, 1 km above the discharges of waste water at the Navoiazot factory and 0.8 km below the discharges of waste water at the Navoiazot factory (Р6 and Р7) were noted. During the period of 2002 and 2003, concentrations of Cr(VI) in these sampling sites were two to three times higher above the MAC value (Figure 10). Since 2004, a slight decrease in the concentrations of Cr (VI) in the river water was also noted.
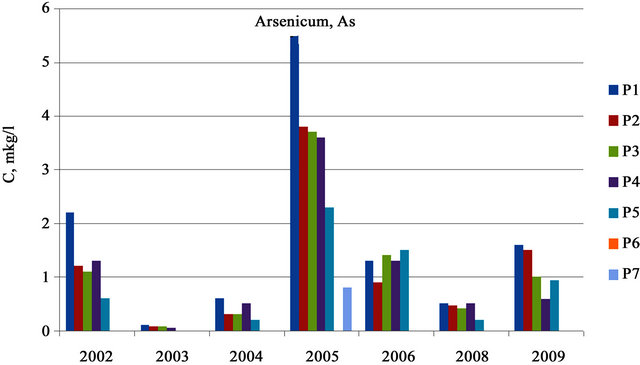
Figure 9. Concentration of arsenic in the Zarafshan river water in 2002-2009.

Figure 10. Concentration of chromium in the Zarafshan river water in 2002-2009.
3.10. Zinc
The MAC value is 0.01 mg/L in Uzbekistan. Concentrations of zinc in 2003 at the Ravathodja sampling site were somewhat higher than that of the MAC value; namely 11 µg/L (Figure 11). As previously mentioned, this was probably due to discharges from the ore processing enterprise of Tajikistan. On the whole, the concentrations of zinc were essentially stable, averaging 3 - 4 µg/L; however, this does not exceed the MAC value.
3.11. Pesticides
For alfa-hexachloran (α-HCH), the MAC value of surface waters is 0.002 mg/L, whereas the MAC value for fishery water is virtually absent; and, for µ-HCH (Lindane), the MAC value for surface water is 0.004 mg/L. Likewise, the MAC value for fishery water is absent. In Uzbekistan, the organochlorine pesticides, such as DDT and its metabolites as well as hexachloran (α-isomer of HCH) and Lindane (µ-isomer of HCH) were banned for the use in agricultural industry. However, during the Soviet Union period, these pesticides were continuously employed to obtain “cotton independence”, and this repeatedly exceeded the international standards in terms of concentrations [10- 12].
The samples of the river water were analyzed for concentrations of any residual quantities of chloroorganic pesticides, including α-HCH, µ-HCH, DDТ and its metabolites (DDE and DDD). Data showing concentrations of HCH are given in Tables 1 and 2. The investigations for the period 2002-2003 demonstrate the presence of isomers HCH, which were fixed at a level of 0.000 - 0.005 µg/L, with the MAC value being 0 - 0.5 µg/L. High concentrations of α-HCH at the level of 0.005 µg/L in 2004 and 0.004 µg/L in 2003 were noted at the sampling site of Ravathodja (Table 3). Also, high concentrations of α-HCH at the city Samarkand sites (0.5 km above the Siab collector) and (3.7 km below the mouth collector of Taligulyan) were noted. Generally, the concentrations of α-HCH were 0.001 µg/L or not able to be detected. The concentrations of µ-HCH were also negligible. In the samples of water in 2003, the concentrations of µ-HCH were 0.002 - 0.004 mg/L. For the concentrations of µ-HCH, the levels were at 0.003 µg/L for the following sampling sites: the settlement of Hatirchi (at the horn of the Karadarya river) and the city Navoi (1 km above the discharges of waste water at the Navoiazot factory). The concentrations of DDT and it metabolites (DDE and DDD) were found to be 0.000 - 0.001 µg/L, with the MAC value being 0 - 0.1 µg/L. For all of the investigated periods, the concentrations of HCH and DDT in the Zarafshan river channel were lower than their MAC values.
3.12. Сollector-Drainage Discharge into the Zarafshan River
As mentioned above, one of the basic sources of pollution of the river water is the agricultural collector-drainage water from the irrigated lands. These waters are similarly polluted throughout all of the Uzbek part of the Zarafshan river. Fiscal constraints have precluded the measurement of the quality and quantity of the collectordrainage discharges into the Zarafshan river from being carried out. The data is sketchy concerning the concentrations of chemical substances found in the large collector-drainage waters (as opposed to the smaller ones) of the Zarafshan river basin [10,11].

Figure 11. Concentration of zinc in the Zarafshan river water in 2002-2009.
Table 1. Concentration of alpha-HCH in the Zarafshan river water, mg/L.

Table 2. Concentration of gamma-HCH in the Zarafshan river water, mg/L.
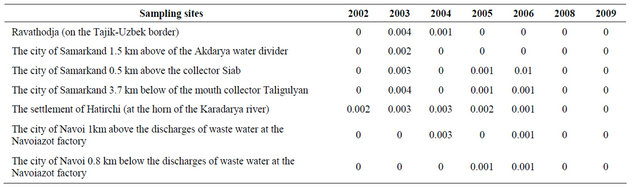
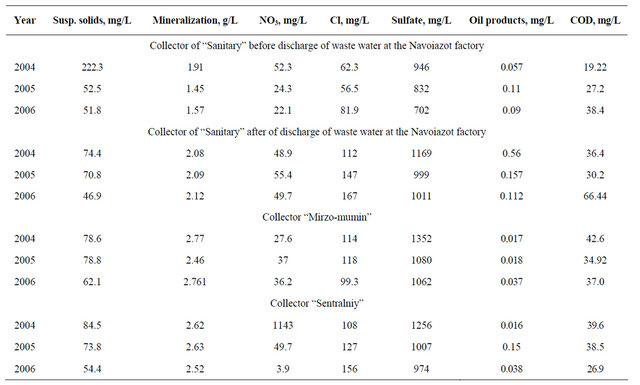
Table 3. Composition of collector drainage water in Navoi province.
3.12.1. Samarkand Province
In the Samarkand province, the utilization of river water for one year for irrigation amounts to 2.4 - 2.5 km3. According to data held by the Ministry of Water and Agriculture, the size of collector-drainage discharges in 2002 constituted 1.23 km3; in 2003 it was 1.46 km3; and, in 2004 it was 1.50 km3 [10,11]. All the large collectors’ discharges into the Zarafshan river include the channels of the Akdarya and Karadarya rivers. The amounts of discharge into the Samarkand province’s portion of the Zarafshan river from the large as well as average collectors include that from the Korasuv Birlashgan collector (81 - 94 million m3 per year); the Siyab collector (124 - 137 million m3 per year); the Korasuv collector (98 - 127 million m3 per year); the Urtacha collector (64 - 79 million m3 per year); and the Huja collector (11 - 44 million m3 year). Their average mineralization is 0.74 - 0.76 g/L. The primary chemical composition of collector waters constitutes hydrocarbonate-sulphate-magnesium-sodiumcalcium (HS-MSC) [10,11].
3.12.2. Navoi Province
The Navoi province is located in a middle part of the Zarafshan river basin. The water resources of Navoi province are the Zarafshan and Amudarya rivers as well as a man-made channel known as the Amu-Bukhara channel which diverts water from the Amudarya river to the Zarafshan rivers basin. The total water utilized for irrigation during the period of 2002-2005 changed from 1.67 to 1.88 km3, while that of the collector discharges changed from 0.75 to 0.88 km3 [10,11]. The Zarafshan river receives discharges of waters from the following collectors: the Akaltin-2, the Central, and the Narpay for a total volume of 95.4 million m3 containing a total mineralization of 1.66 - 2.93 g/L. The composition of these waters consists of chloride-sulphate-calcium-so-diumagnesium (HS-CSM). In Table 3, the data relates to the chemical composition of some collector drainage waters of Navoi province that discharge into the Zaraf-shan river. The general mineralization, concentrations of nitrates, chlorides and sulfates were found to be higher in the collector drainage water than that of the Zarafshan river.
4. Conclusions
The data analysis of the Zarafshan river water quality for the last seven years (2002-2009) has shown that the quality of the river water has undergone a considerable transformation, even by the length of the river. At the sampling site of Ravathodja, the water was comparatively less polluted than that found at the middle of the river’s course and near its terminus. The chemical composition of the Zarafshan river water underwent changes due to the agricultural collector drainage discharges and also from the sewage of the cities of Samarkand and Navoi.
There has been a decrease in concentrations of ammonium, BOD and chromium in the river water, but that was almost insignificant. At the same time, there has been somewhat of an increase of concentrations of phosphates, zinc and arsenic. The maximum concentrations of these polluting substances at the site below the city of Navoi have been noted to be composed of ammonium (about 0.12 mg/L), chromium (about 3.8 µg/L, which is approximately 3.8 times higher than that of the MAC value). The oxygen concentration in the Zarafshan river water was evaluated as adequate.
The water pollutants of the Zarafshan river, as a consequence of the agricultural pollution, consisted of mineralization, ammonium, nitrogen, phosphorus, and pesticides. In the future it will be critical to monitor the chemical composition of large agricultural collectors discharge into the river.
The sources of the heavy metals of Zarafshan, which are primarily arsenic and zinc, probably were due to the ore processing manufacturing located in Tajikistan. The aforementioned requisite monitoring is also for not only the Zarfshan river but also for the large collector drainage waters as it relates to mercury, antimony and selenium.
5. Acknowledgements
Prof. Rashid Kulmatov is grateful for the German Academic Exchange Service (DAAD), Germany, for the visiting scholarship program under which the present research was carried out.
REFERENCES
- V. L. Shul’ts, “Reki Srednei Azii, Parts 1-2,” Gidrometzdat, Leningrad, 1965.
- UNDP Report, “Technical Report on the Zarafshan River Basin,” UNDP, Tashkent, 2007.
- R. A. Kulmatov and M. Hoshimhodjaev, “Spatial Distribution and Speciation of Microelements in Water of Zarafshan River,” Water Resources, Vol. 11, 1992, pp. 103- 114. (in Russian)
- K. Toderich, “Development of New Information Tools for Determination of Water Quality in the Aral Sea Area (Zarafshan River),” Report for the Project N3173, Scientific and Technology Center of Ukraine (STCU), SamGU, Samarkand, 2004.
- R. Kulmatov, M. Groll, Ch. Opp, M. R. Rosen and D. Kulmatova, “Spatial and Temporal Changes of Transboundary Pollutants in the Zarafshan River, Uzbekistan,” Water, Air and Soil Pollution, 2012, in Press.
- D. H. Fayzieva, I. A. Usmanov and R. A. Lutfullaev, “Influence of Anthropogenic Pollution of the River Zarafshan on Intestinal Infections Morbidity of the Population,” In: C. A. Brebbia, Ed., Water Pollution VI, WIT Press, Southampton, 2001, pp. 227-235.
- D. H. Fayzieva, E. Kamilova and B. Nurtaev, “On Development of GIS-Based Drinking Water Quality Assessment Tool for the Aral Sea Area,” In: J. E. Moerlins, M. K. Khankhasayev, S. F. Leitman and E. J. Makhmudov, Eds., Transboundary Water Resources: A Foundation for Regional Stability in Central Asia, SpringerVerlag, Dordrecht, 2008, pp. 183-192. doi:10.1007/978-1-4020-6736-5_13
- O. Olsson, G. Matthias, K. Wegerich and B. Melanie, “Identification of the Effective Water Availability from Streamflows in the Zerafshan River Basin, Central Asia,” Journal of Hydrology, Vol. 390, No. 3-4, 2010, pp. 190- 197. doi:10.1016/j.jhydrol.2010.06.042
- Uzgidromet Reports, “A Year-Book of Quality of Superficial Waters in the Territory of Uzbekistan for 2002- 2010,” Uzgidromet, Tashkent, 2002-2010.
- B. B. Alihanov, “About a Condition of Environment and Use of Natural Resources in Republic of Uzbekistan (the Retrospective Analysis for 1988-2007),” National Report of the State Committee for Nature Protection of the Republic of Uzbekistan, Chinor ENK, Tashkent, 2008.
- E. I. Chembarisov and S. P. Shodiev, “Mineralization of Collector-Drainage Waters of Uzbekistan,” The Problems of Development of Deserts, Vol. 4, 2007, pp. 22-25. (in Russian)
- Food and Agriculture Organization of the United Nations (FAO) Report, “Fertilizer Use by Crop in Uzbekistan,” FAO, Rome, 2003.
- R. A. Kulmatov and M. Hojamberdiev, “Speciation Analyses of Heavy Metals in the Transboundary Rivers of Aral Sea Basin: Amudarya and Syrdarya Rivers,” Journal of Environmental Science and Engineering, Vol. 4, No. 8, 2010, pp. 36-45.