Journal of Water Resource and Protection
Vol.4 No.5(2012), Article ID:19466,13 pages DOI:10.4236/jwarp.2012.45029
By Sector Water Consumption and Related Economy Analysis Integrated Model and Its Application in Hai River Basin, China
Academy of Mathematics and Systems Science, Chinese Academy of Sciences, Beijing, China
Email: xiuli.liu@amss.ac.cn
Received February 24, 2012; revised March 16, 2012; accepted April 18, 2012
Keywords: Direct Water Consumption; Total Water Consumption; Intersectoral Water Transaction; Input-Output Analysis
ABSTRACT
This paper established a by sector water consumption and economy analysis integrated model with input-output analysis method. The model can be used to identify the relationships between economic activities and the direct water consumption, the total water consumption and the intersectoral water transaction for detailed sectors in regional economy. The method is applied to Hai River Basin in China that is characterized by water shortage. The results found that in Hai River Basin, agriculture sector is responsible for 81.2% of the direct total water consumption in the region, but industrial and service sectors account for 53.2% of the indirect total water consumption. To 24 industrial and service sectors, their ratios of indirect water consumption to total water consumption belong to [90%, 99%]. To per unit output, water consumption intensity was highest in agriculture sector 1 at 96.91 m3 per thousand Yuan, the value of 28 industrial and service sectors were smaller than 1. Products of sector 1, sector 24, sector 3, sector 12, sector 6, sector 11 and sector 10 are the main suppliers of indirect water.
1. Introduction
Water shortages have become an increasingly serious problem in China. Many observational facts and studies have shown that water resources in the Hai River Basin decreased significantly over last half of the 20th century. The reduction in extent of runoff in the basin ranked first among China’s major rivers over the past 40 years. Simultaneously, groundwater was seriously over-exploited, aquatic ecosystems were seriously overdrawn, and water security suffered severe crises.
This problem has been extensively studied from hydrological and engineering perspectives [1-8], while there has been little economic analysis of water use and management in this area [9,10]. Consequently, little is known about how to use and manage the available water resources effectively, because no commonly accepted concepts have been established to describe the socioeconomic processes that relate to water use. However, any attempt at conceptualizing sustainable development of water resources must involve a consideration of the interactions between water use and the economy [11,12].
Studies that relate the economic system to the natural system and the environment date back to the 1960s [13]. In earlier studies, a rigorous approach to these problems suggested feasible solutions that consisted of recognizing the necessity to develop a system of national accounts that provides information about the actual relationships between the economy and the environment [14]. To encourage the integration of international environmental accounts, several international organizations developed an ambitious system known as the System of Integrated Environmental and Economic Accounts (SEEA) [15]. These efforts were advanced by the National Accounting Matrix including Environmental Accounts (NAMEA), developed in the Netherlands based on the SEEA indicators [16]. However, although these accounts managed to integrate the economic and environmental relationships within the production system in macroeconomic terms, their analysis only considered direct effects, since no industrial interdependencies were considered.
A parallel methodology that analyzes economic and environmental accounts together is the extended inputoutput model. Standard input-output tables consider interindustry relationships in an economy, and thereby depict how the output of one industry is captured by another industry, where it serves as an input. Combining inputoutput analysis with environmental factor data makes it possible to quantify the environmental loads for all productive processes from raw material extraction to manufacturing and use, and then to ultimate disposal [17]. In recent decades, this methodology has been extensively used to calculate the environmental burdens caused by the normal activities of an economy [18-25].
Water consumption analysis dates from 1950s, but the first models were abandoned due to operational difficultties and the methodological problems that arose when some variables had to be introduced into an input-output model [13]. In input-output analysis, it is assumed that monetary transactions are proportional to physical transactions, whereas in the case of water transactions, this assumption is not correct because use prices vary considerably between production sectors. This difficulty was overcome in the work of [26] which, in order to evaluate the water requirements of the California economy, introduced water inputs as a production factor (measured in physical units) in a traditional input-output model. Within this framework, [27] studied the supply and demand balance for water resources in Shanxi Province of China. One year later, [28] developed a hydro economic model by incorporating the water industries into the input-output table. [29] evaluated the internal effect and the induced effect of water consumption in Spain using a Hypothetical Extraction Method based on an input-output analysis. [13] then established a number of indicators of water consumption and studied the intersectoral water relationships in the economy of Andalusia. Based on this foundation, the paper advanced the existing analytical methods by integrating the analysis of intersectoral water relations so as to trace the sources of indirect water consumption in production processes. The objectives of this paper were thus to develop a regional inputoutput model of water consumption following the approach taken by [13]; and to apply the model to Hai River Basin, an arid area of north China, to analyze the structural relationships between economic activities and their physical relationships with the region’s water resources.
2. Framework of Water Conservancy Input-Occupancy-Output (IOO) Table for River Basins
The framework of water conservancy IOO table was shown in Table 1. The main difference from usual water conservancy IOO model is that the water input is classified into ground water and surface water and more detail either of them is classified into I-III, IV, V and bad V categories according to Quality standard for surface water (GB 3838-2002) and ground water (GB/T 14848-93) that issued by PRC State Environmental Protection Administration. Usually I-III category water can be used for
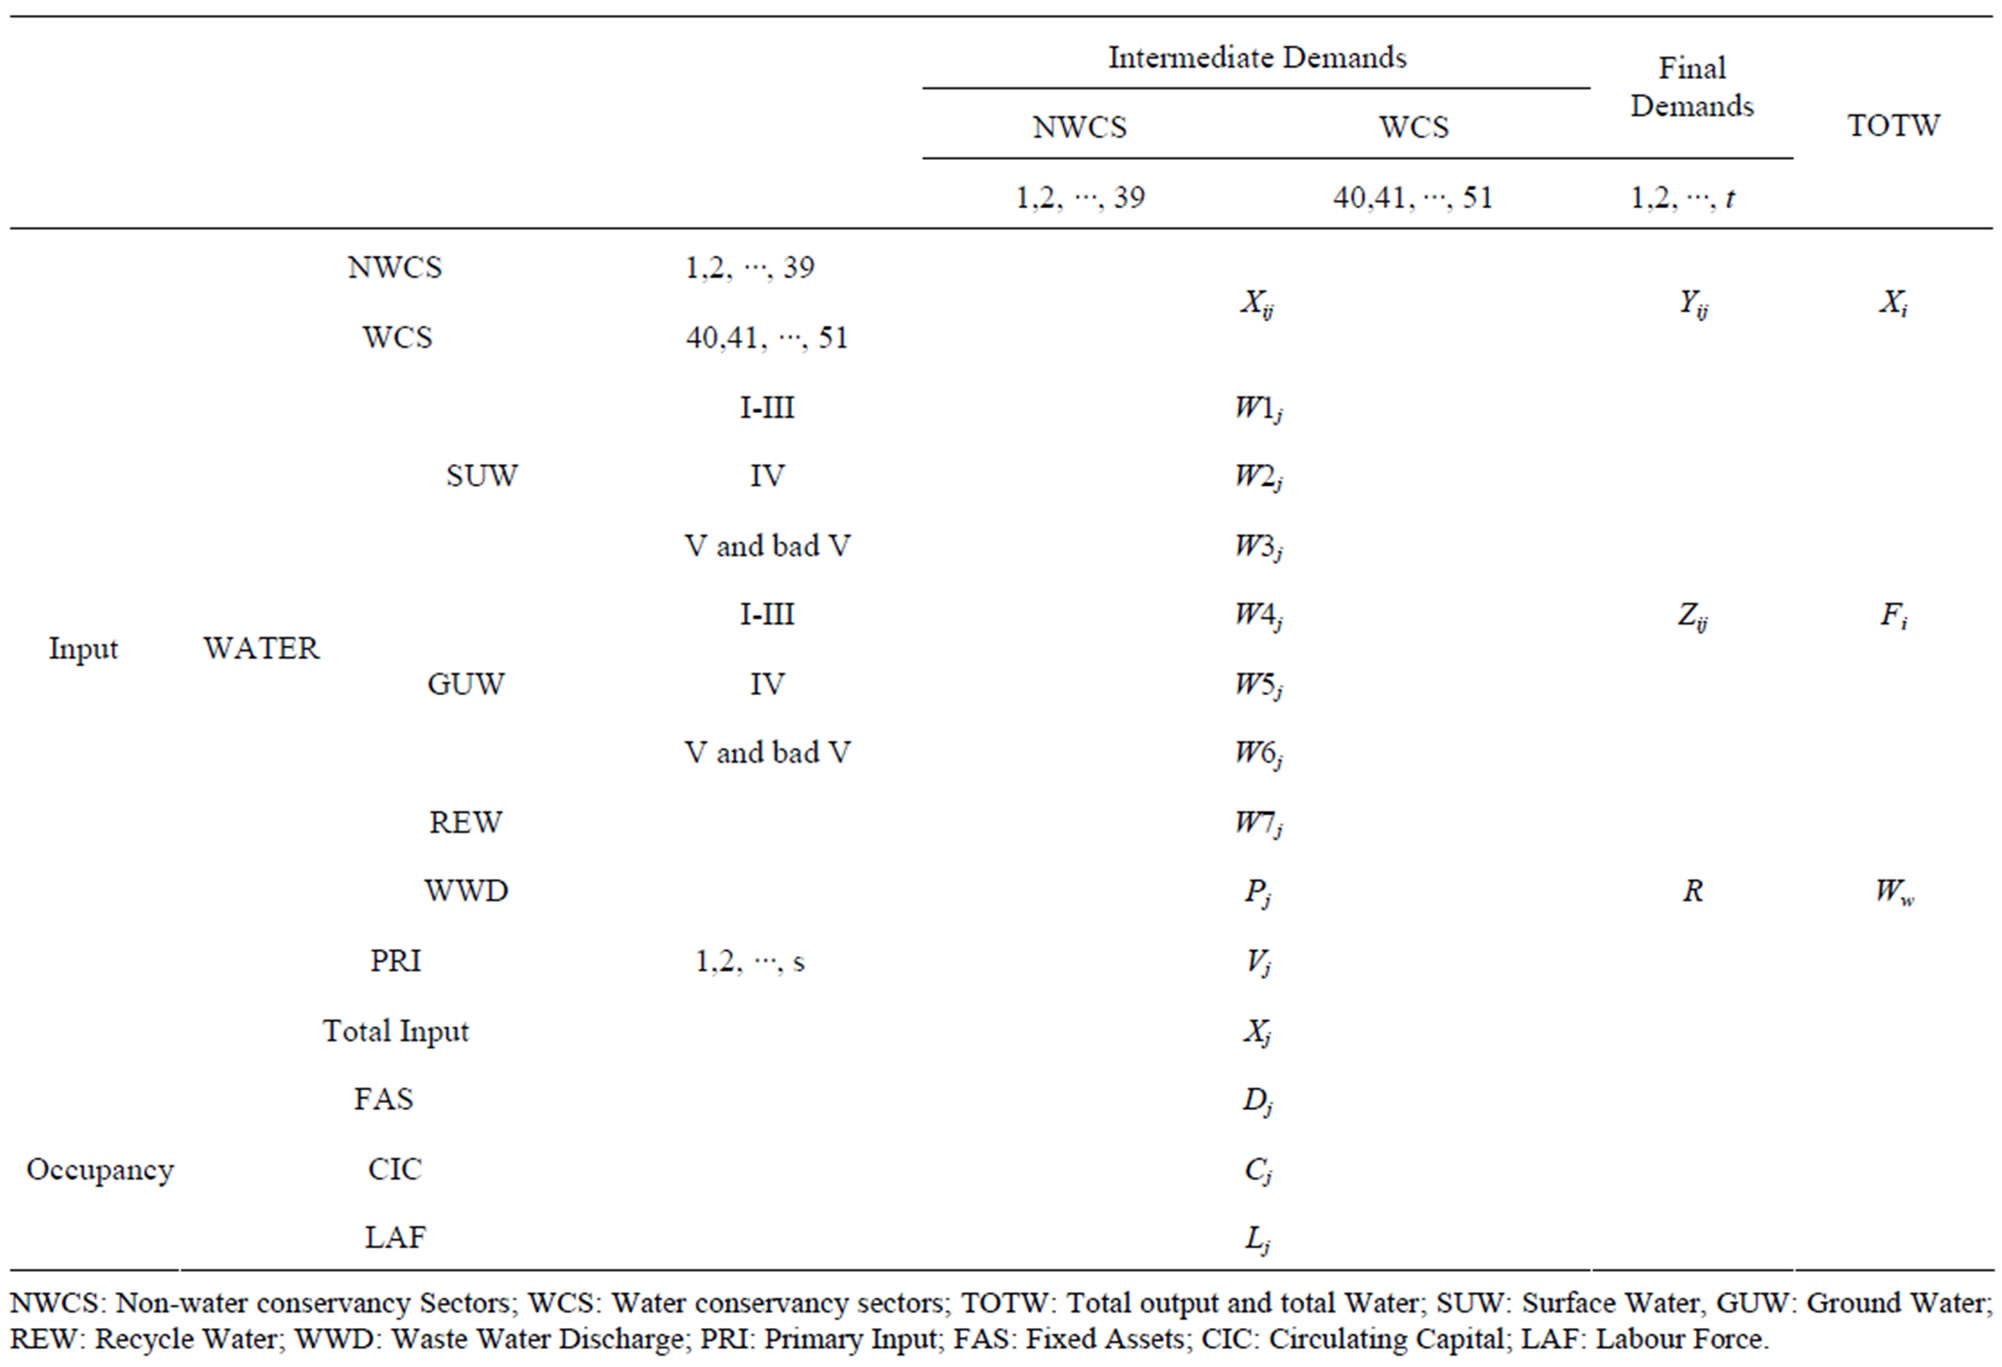
Table 1. Water Conservancy IOO table framework.
drinking after different disinfection. IV category water can be used for protected areas of general industry and recreational water that non-direct contact with the body. V category water can be used for agriculture and general landscape water need. Bad V category water almost has no use.
Regional economy is divided into 51 sectors, of which 12 sectors are water conservancy ones, 39 sectors are non-water conservancy ones (Appendix A.1). Waterintensive agricultural water use is divided into two categories: Agriculture (excluding freshwater fish farming and ecological forest), Freshwater fish farming.
3. Water Consumption and Economy Analysis Integrated Model
Based on water conservancy IOO table, water consumption and economy analysis integrated model is established, which include three parts: direct and indirect water consumption calculation model, water consumption multiplier calculation model and intersectoral water consumption calculation model.
3.1. Direct and Indirect Water Consumption Calculation Model
An indicator of direct water consumption intensity for each sector (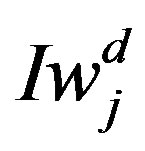 ) is defined as this:
 (1)
(1)
where is the amount of water consumed directly by sector j; and
 is the output of sector j in monetary terms.
In addition to this physical water consumption, other goods and services are required by the production processes of sector j. Consequently, in order to produce the inputs generated by other sectors, another requirement of water is also necessary. For sector j, this is the indirect water consumption. Direct consumption plus indirect consumption together amount to the total water consumption. By analogy with the input-output model, the calculation of total water consumption depends on the direct water consumption and the intersectoral dependence:
 (2)
(2)
where  and
and  are the total water consumption intensity of sector j and i, respectively, and n represents the number of sectors.
  is the technical coefficient.
On the right side of Equation (2), the first part represents the direct water consumption intensity of sector j, and the second part represents the sum of total indirect water consumption intensity of sector j. In matrix notation, Equation (2) becomes:
 (3)
(3)
where ,
, represent the coefficient vectors of the total and direct water consumption intensities, respectively; and
  is the technical coefficient matrix of production. The solution for
  is available as follows:
 (4)
(4)
where  is known as the Leontief inverse matrix, which represents the total production that every sector must generate to satisfy the final demand of the economy [30]. It is important to clarify this expression and its meaning because it can capture both the direct and indirect effects of any change in the exogenous final demand vector. [31] clearly summarize the importance of this fact: if the production vector is replaced by this expression in the input-output model, then the matrix describing only the specific direct requirements of the production sectors is replaced by the matrix
 , which expresses the total requirements of each sector in terms of both the direct and indirect inputs. By decomposing Equation (4), one can separate the direct from the indirect water consumption required to sustain production by the economy [32]:
 (5)
(5)
In Equation (5),  is the direct water consumption to produce one unit of output,
  is the water required to allow the production of
 , which means the first-round indirect water consumption. Similarly,
  is the second-round indirect water consumption,
  is the nth-round indirect water consumption. Clearly, the total indirect water consumption is the sum of all rounds of consumption.
Equation (5) considers indirect water input delivered by intermediate input only, but ignores indirect water input delivered by fixed assets. It is obvious that water is used directly and indirectly in the production process of fixed assets. For example, electricity is used to produce different kinds of fixed assets, but in the production process of electricity water is consumed. Therefore, the result obtained from Equation (5) will underestimate total water input coefficients.
[34] proposed IOO analysis by incorporating occupancy factors into classical IO table. Based on IOO techniques, the paper brings forward the formula to calculate total water input coefficients as follows:
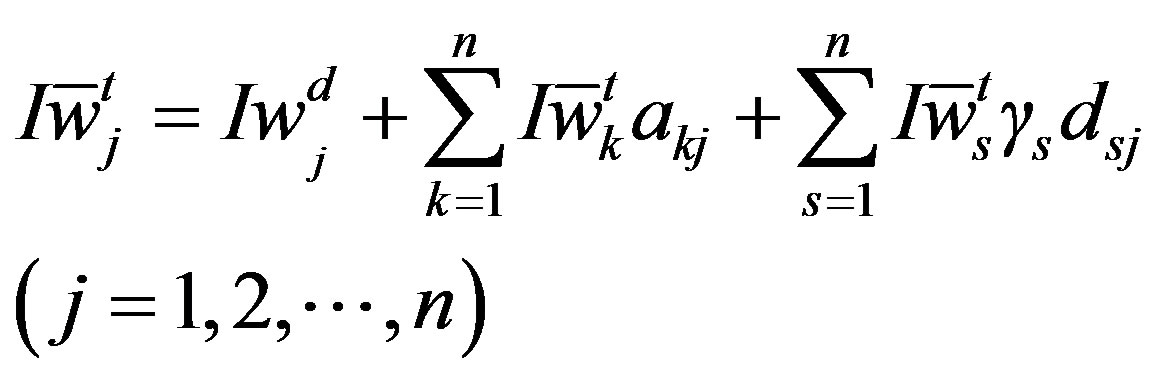 (6)
(6)
where  denotes total water input coefficient of j-th sector considering occupancy.
  is the depreciation rate of s-th fixed asset.
  represents direct occupancy coefficient of s-th fixed asset by j-th production sector:
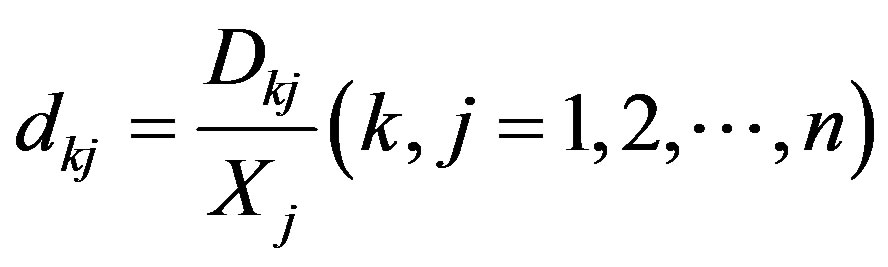 (7)
(7)
According to Equation (6), the total water input coefficient is equal to the sum of the following three items: the direct water input coefficient, all indirect water input delivered by intermediate input, and the last one, indirect water input delivered by fixed assets.
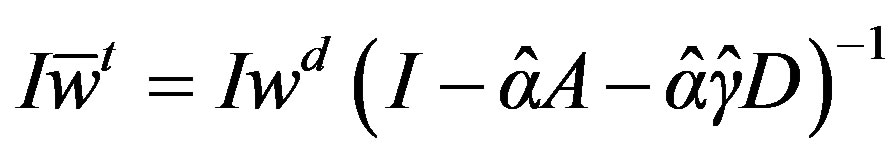
Equation (6) can be rewritten in matrix form:
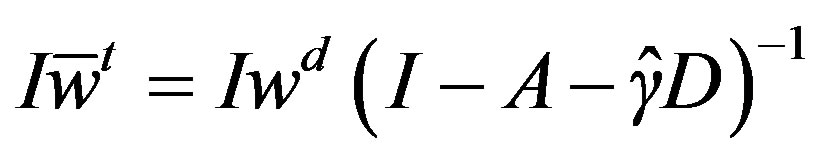 (8)
(8)
 denotes total water input coefficients considering occupancy. D represents direct occupancy coefficients matrix of fixed assets.
  is a diagonal matrix of fixed assets depreciation rate.
Another important issue on the calculation of total water input coefficients is how to deal with transferred products (imports). Transferred (Import) products are not produced inside the region, so the water consumption during their production process should be excluded from total water input.
If C type IO table is available, the following formula can be used to calculate domestic total water input coefficient:
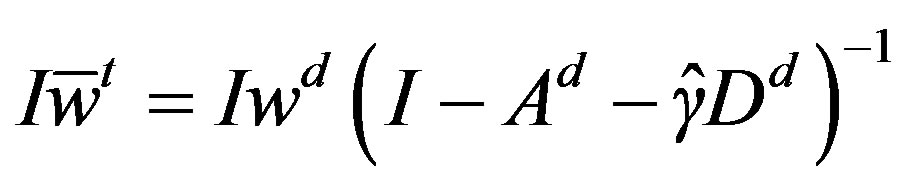 (9)
(9)
 denotes domestic total water input coefficients considering occupancy.
  and
and  represents the matrix of direct input coefficients of domestic products and direct occupancy coefficients of domestic fixed assets, respectively.
If only common A type IO table is available, which is more general, we need to use the following equation instead of Equation (9):
 (10)
(10)
 is a diagonal matrix of inside region production rate, with
  as its diagonal element.
  is equal to the proportion of inside region part of i-th product to the sum of transferred in and total output of i-th product.
3.2. Water Consumption Multiplier Calculation Model
The input-output analysis also accounts for the “drag” effect, which has this name because it indicates how the evolution of a given sector can exert a drag upon the total economic production. Following [13], this drag effect can be measured by dividing the total water consumption per unit output by the direct water consumption per unit output:
 (11)
(11)
where  is the water consumption multiplier that expresses the total quantity of water consumed by the whole economy per unit of water used directly to satisfy the demand of sector j.
After the multiplier  has been defined, it is easy to obtain a multiplier of indirect water consumption (
 ), simply by subtracting one from the
 .
.
 (12)
(12)
In this way, the indicator yields an estimation of the quantity of water used indirectly by sector j for each unit of water that is consumed directly.
3.3. Intersectoral Water Consumption Calculation Model
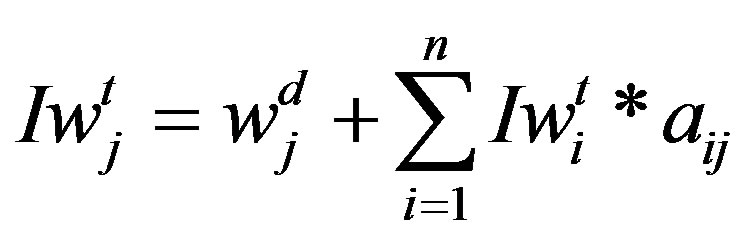
Equations (9) and (10) provide a row vector in which each element determines the total water consumption if the output of any given sector changes by one unit. Based on this equation, a matrix for intersectoral water relationships (SW) by changing the form of Iwd and subtracting the direct water consumption from the total water consumption is formulated:
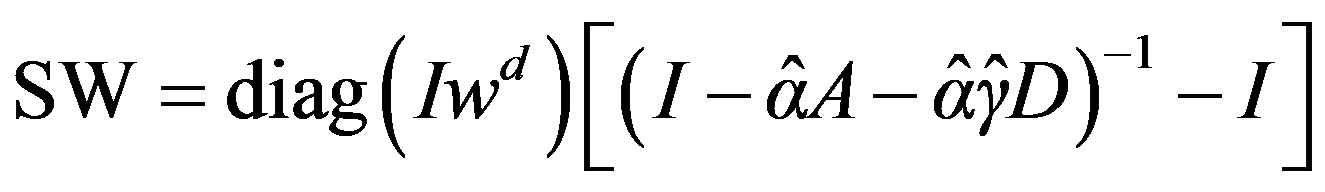 (13)
(13)
where diag (Iwd) indicates that the vector elements of Iwd should be placed along the diagonal of the matrix. The elements SWij of SW indicate the additional quantity of water consumed by the whole economy for each unit of additional output in sector j. Thus, the sum of all the elements of column j expresses the indirect water requirements per unit output of sector j. This matrix can be converted into a matrix of water transaction coefficients whose elements are defined as:
 (14)
(14)
where TWij indicates the additional quantity of water that sector i will consume if the demand for water by sector j increases by one unit. Therefore, this new matrix reflects the dependence established between one sector and other sectors concerning water resources.
4. Description of the Hai River Basin, China
The Hai River Basinis (See Figures 1 and 2) located in the northern part of the People’s Republic of China (35˚N to 41˚N, and 112˚E to 120˚E), faces Bohai on the east, Yellow River on the south, Yunzhong and Taiyue Mountain on the west and Mongolian Plain on the north. The total area of the basin is 320,000 km2, accounting for 3.3% of national land. The basin consists of 189,000 km2 mountains and plateaus in the northern and western parts, and 131,000 km2 Plain in the eastern and southern parts.
The Hai River Basin is composed of two large river systems: the Hai River system and the Luan River system. The Hai River system includes the Hai River and several

Figure 1. People’s Republic of China including the Hai River Basin (Cite from: [33]).
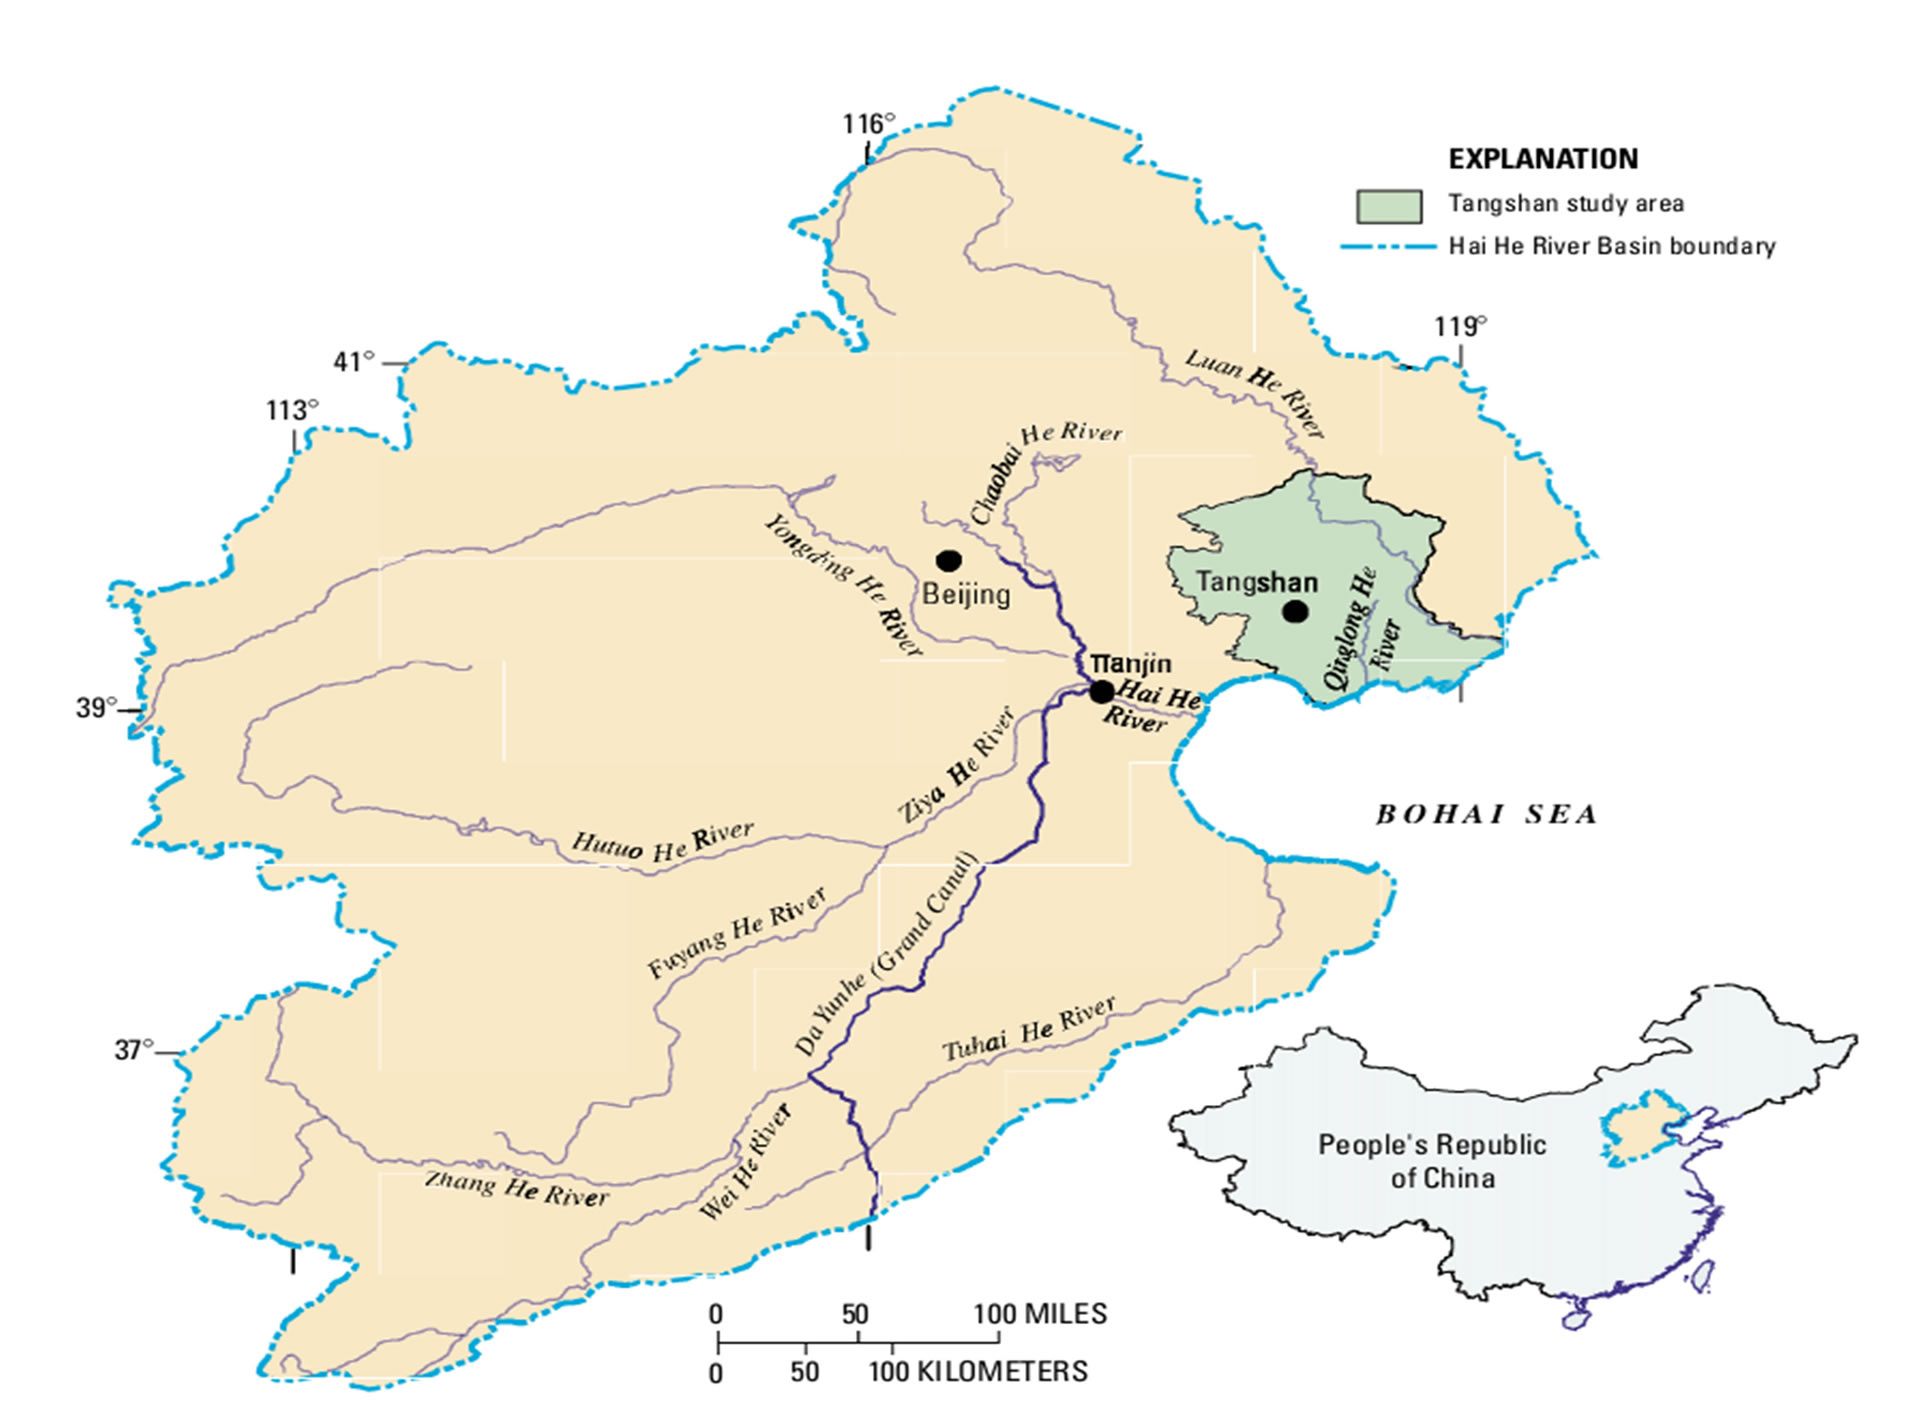
Figure 2. Hai River Basin study area in the People’s Republic of China (Cite from: [33]).
major tributaries, and part of the South Grand Canal, a major canal. The Luan River system includes the Luan River and several tributaries.
The Hai River Basin belongs to the semi humid climate in the monsoon region of the East Asia warm Temperate Zone. The winters are dry and cold, with low rainfall in the spring and heavy rainfall in the summer. The average annual precipitation is 548 mm, about 80 percent of which falls during June to September. It has minimum precipitation in eastern costal China with great fluctuation of average annual precipitation. Annual evaporation capacity in Hai River basin and intermountain basin usually is 1000 - 1300 mm while 850 - 1000 mm in hilly region.
The Hai River Basin is the political and cultural center of China, inside which the cities of Beijing and Tianjin are located. It includes 8 provinces and municipalities. With only 1.3% of the total water resources of China, the Hai River Basin sustains 10% of the country’s population, and 13% of the country’s GDP. It is a very important region for industrial and agricultural production. The cropping patterns are diverse, and the major crops are wheat, corn, sorghum, cotton, and peanuts.
Water resources, which are deficient in the basin, average 40.4 billion (40.4 × 10⁹) cubic meters per year. Surface runoff is 26.4 billion cubic meters. The average surface water per capita use is 251 m3/yr [35]. This can be compared to a per capita usage in the United States (based on data collected in 1990) of 9913 m3/yr (Population Action International, 2000).
As a result of climatic and environmental conditions modified, the large amount of land in agriculture, the large population and local human activities of high intensity, serious water contamination problems become much worse in the basin. The annual amount of wastewater is about 4.71 billion megagrams, about 4 billion megagrams of which is discharged into rivers [35]. Therefore, it is very important and urgent for the Hai River Basin to improve water resources and water environment management including enhancement of water resource demand management, improve water quality, promotion of water resource utilization efficiency.
5. Data Collection
The water consumption and water quality data are obtained from the River Basin Water Resources Bulletin 2007 published by The Ministry of Water Resources of the People’s Republic of China. The waste water discharge data is from China Annual Statistics Book 2008. The 2007 input-output tables of 30 provinces were compiled by China Statistics Bureau. Fixed assets, circulating capital and labor force data are from Provincials Annual Statistics Book 2008.
6. Results and Discussion
Applied the water consumption and economy analysis integrated model to Hai River Basin, and get these results: direct and total water consumption per unit of output by 51 sectors (Table 2); the ratios of the direct and indirect water consumption to the total water consumption and the water consumption multipliers by 51 sectors (Table 3); The water transaction coefficient for main sectors (Appendix A.2).
6.1. Characteristics of Water Consumption by 51 Sectors
The calculation results of direct water consumption (Table 2) reveal that the amount of water consumed directly by the agricultural sectors is much greater than that consumed by the industrial and service sectors, with agricultural consumption exceeding 26,325 million m3, and the latter only consuming a small fraction of this amount (about 6095 million m3). This finding confirms the wellknown fact that agriculture is the main consumer of water resources in Hai River Basin, and is responsible for 81.2% of the total water consumption in the region. In comparison, the volume of water consumed directly by the industrial and service sectors is nearly negligible. However, when indirect water is considered, it becomes obvious that water consumption by the industrial and service sectors increased greatly, account for 53.2% of the total water indirect consumption. This is often unnoticed in analyses that focus exclusively on the lower values for direct water consumption by these sectors, as shown in Table 2. This means that although these sectors use only a small amount of water directly in production, in order to produce the inputs (generated by other sectors) that they incorporate into their production processes, a high consumption of water is necessary. Thus, it appears that the industrial and service sectors also consume large amounts of water indirectly, as the detailed analysis later in this section will show. In this sense, indirect consumption seems to make up a significant part of the water consumption in the study area.
As water consumption is related to the quantity of goods produced by any of these sectors, one can note that the water consumption intensity of the agricultural sectors is considerably greater than that of the other sectors because of the greater water consumption in these sectors. Per unit output, water consumption was highest in the agriculture (excluding freshwater fish farming and ecological forest) (sector 1) at 96.91 m3 per thousand yuan (Table 2). Water use was more efficient for economic sectors that produced higher-value products. This is true, for example, of the agriculture sector 1. Even though this sector consumed 1.2% of the physical water resources, its direct water consumption per unit output was 20.37 m3 per
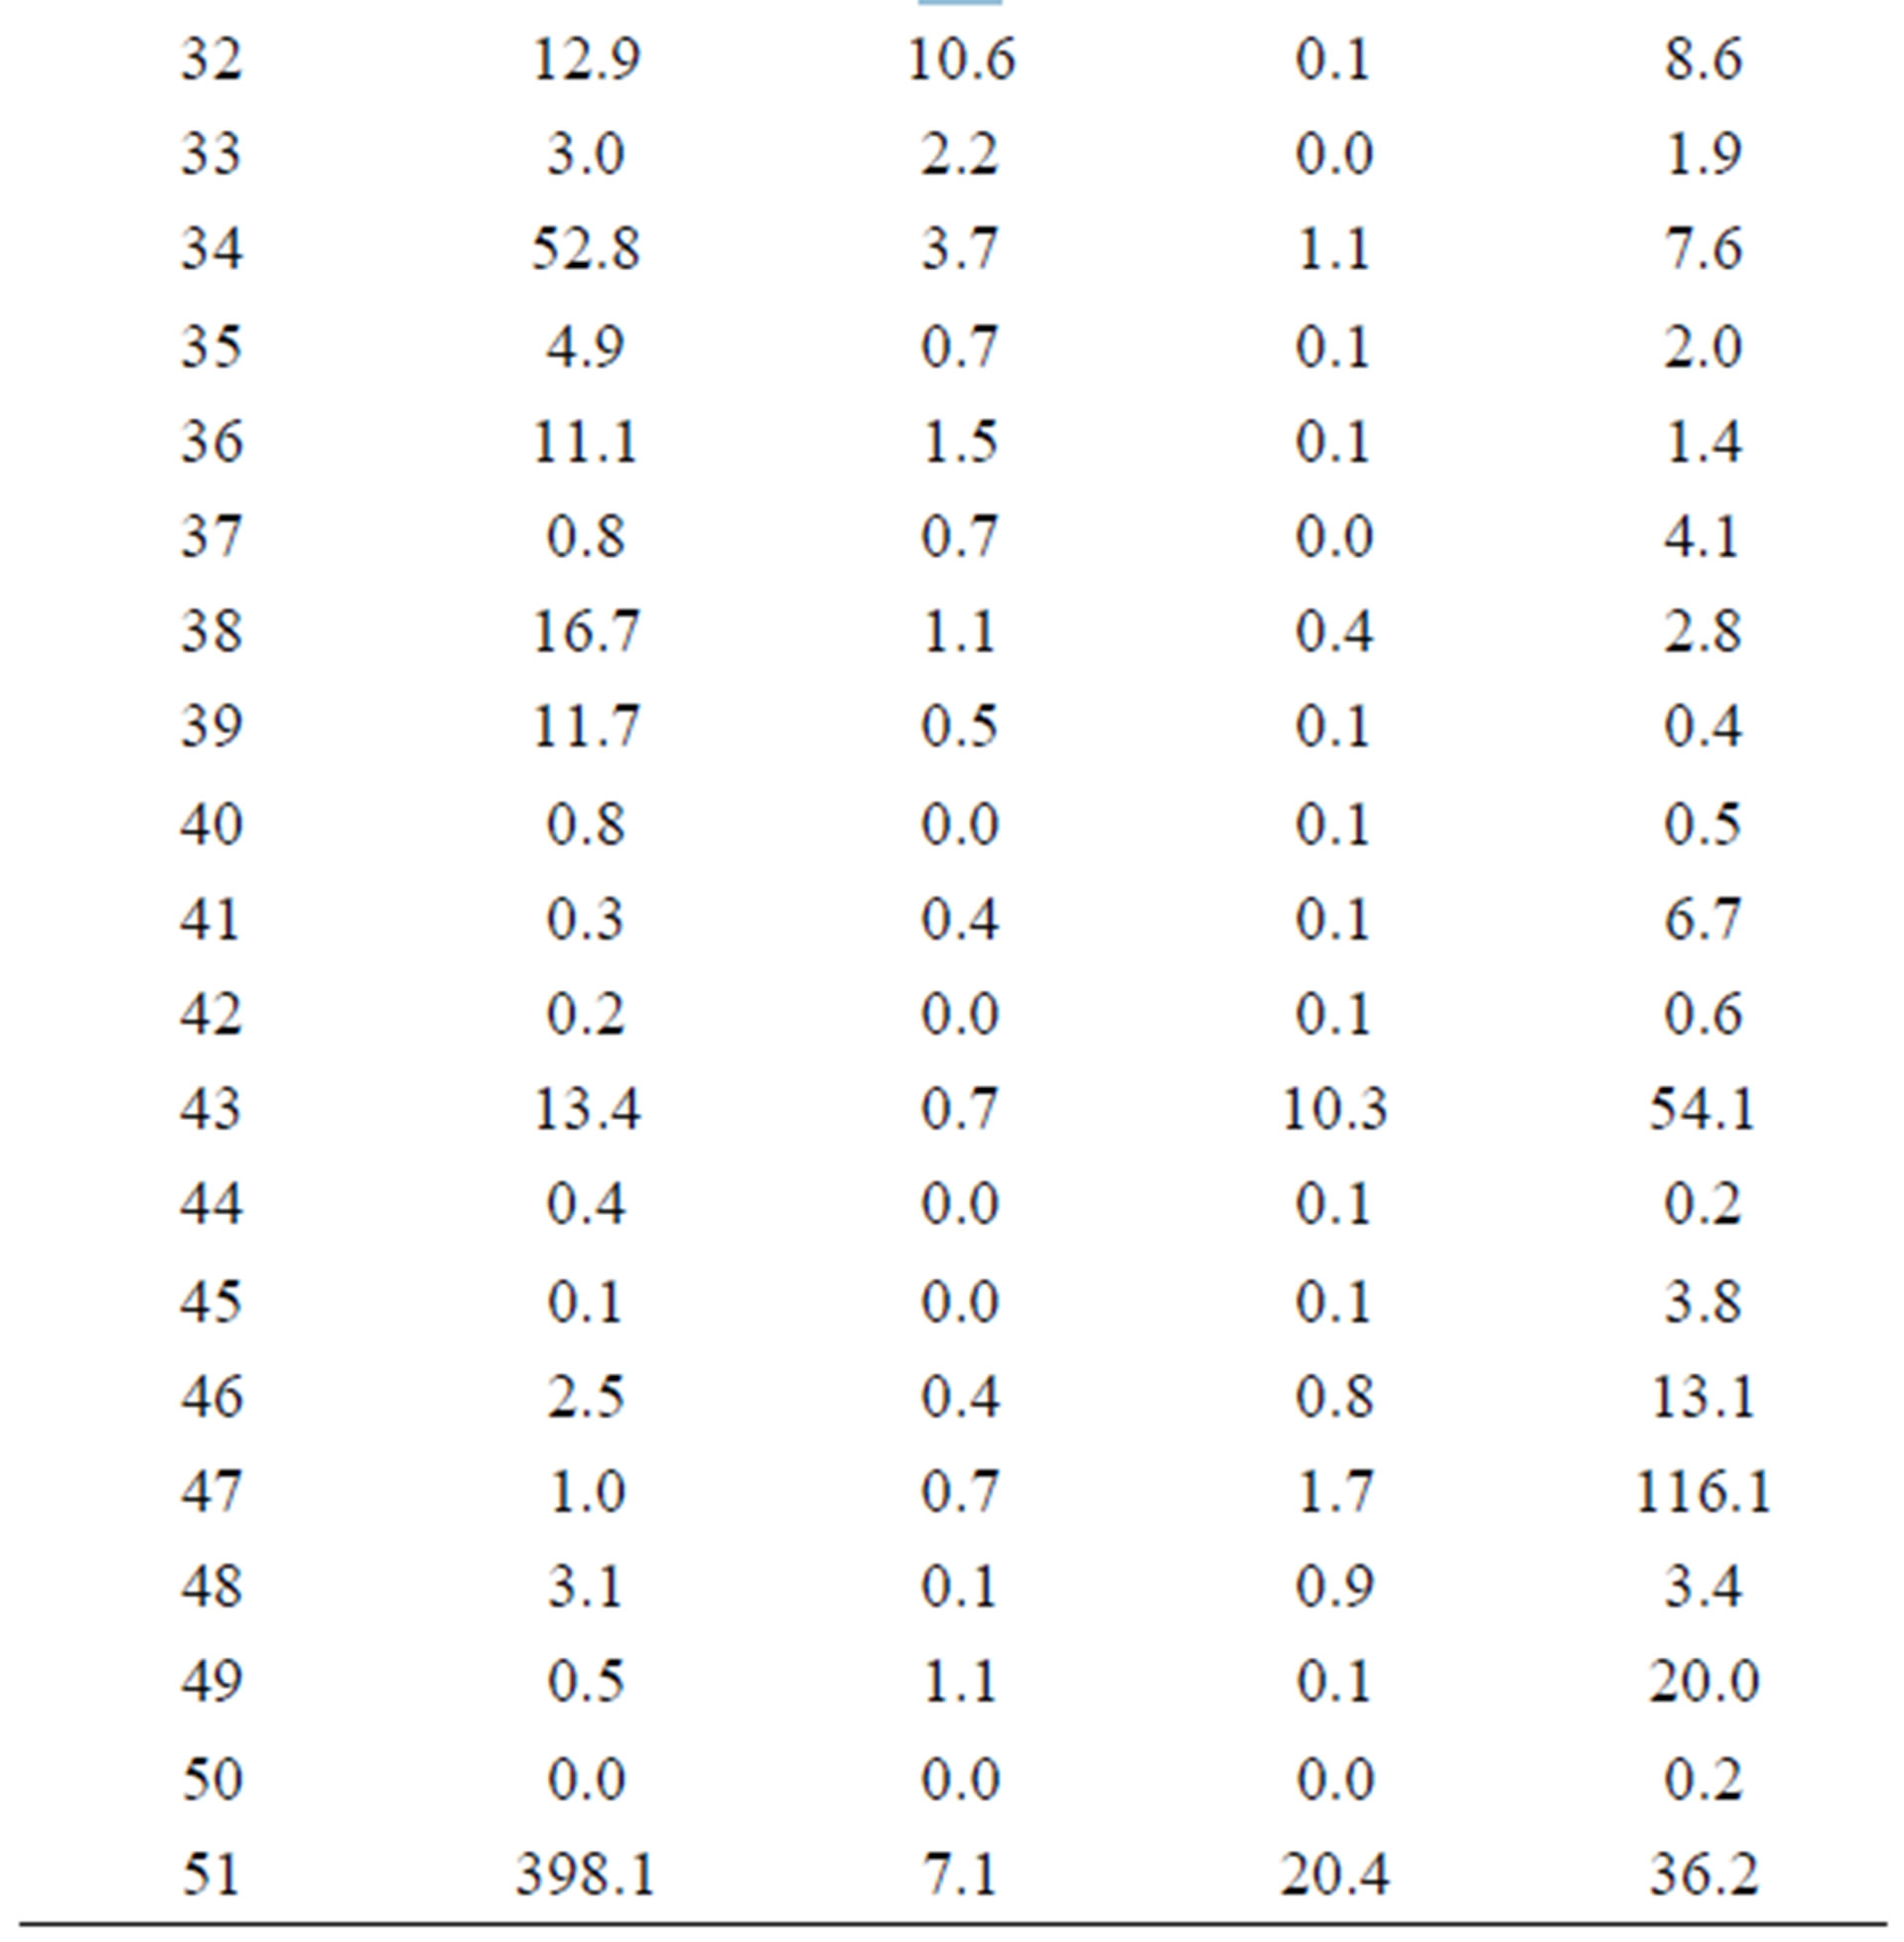
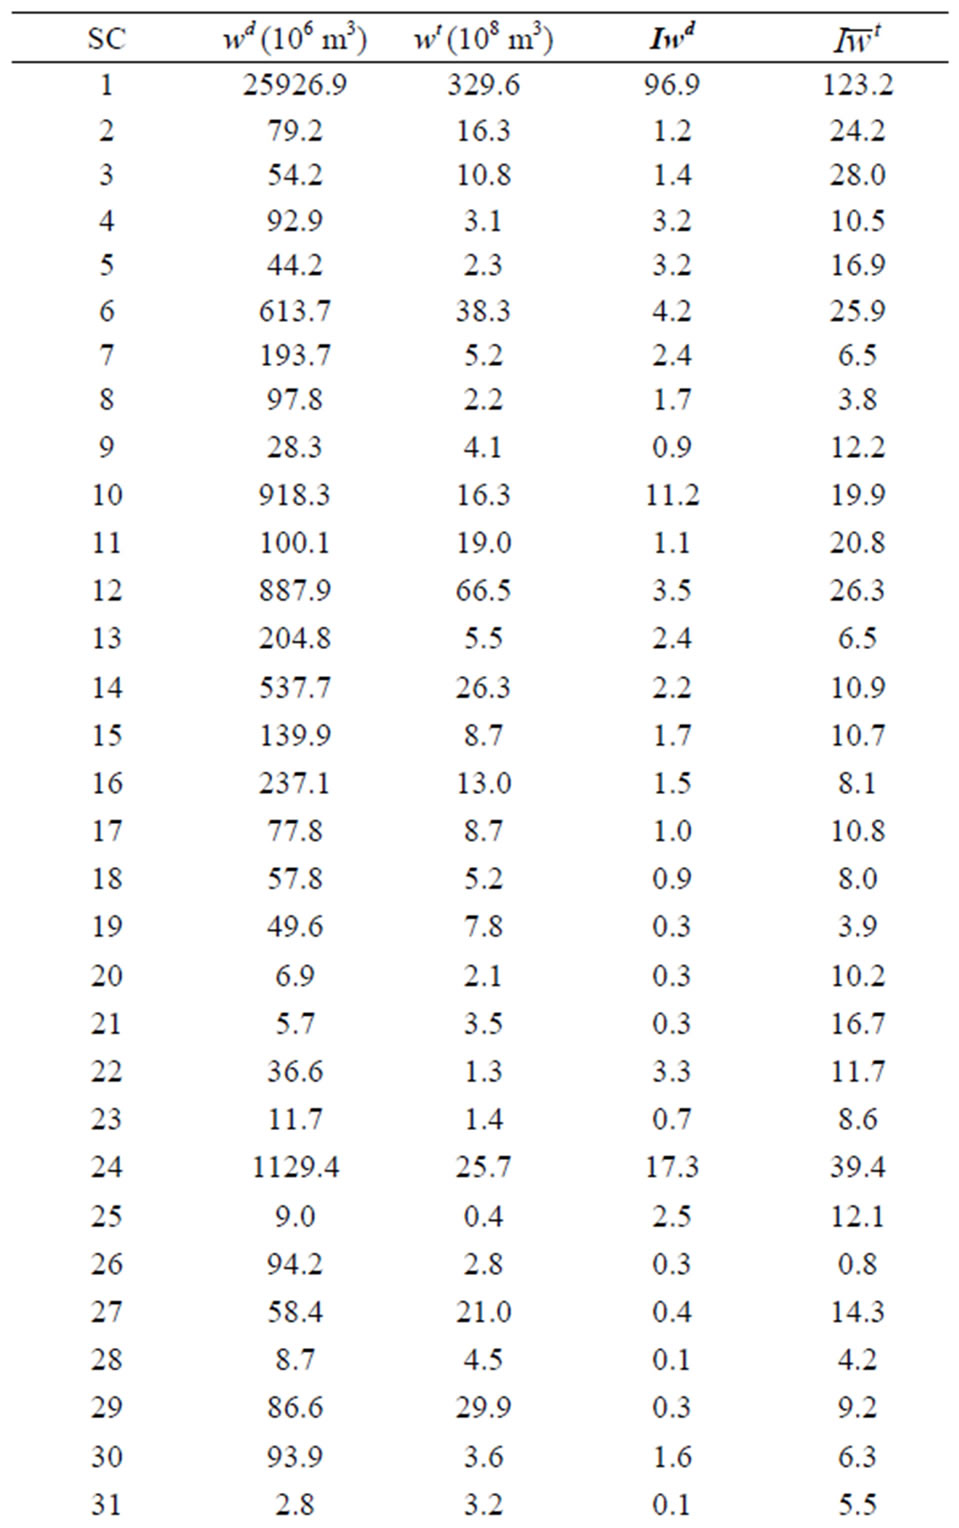
Table 2. Indicators of direct (wd) and total (wt) water consumption, direct (Iwd) and ( ) total water consumption per unit of output in Hai River Basin in 2002.
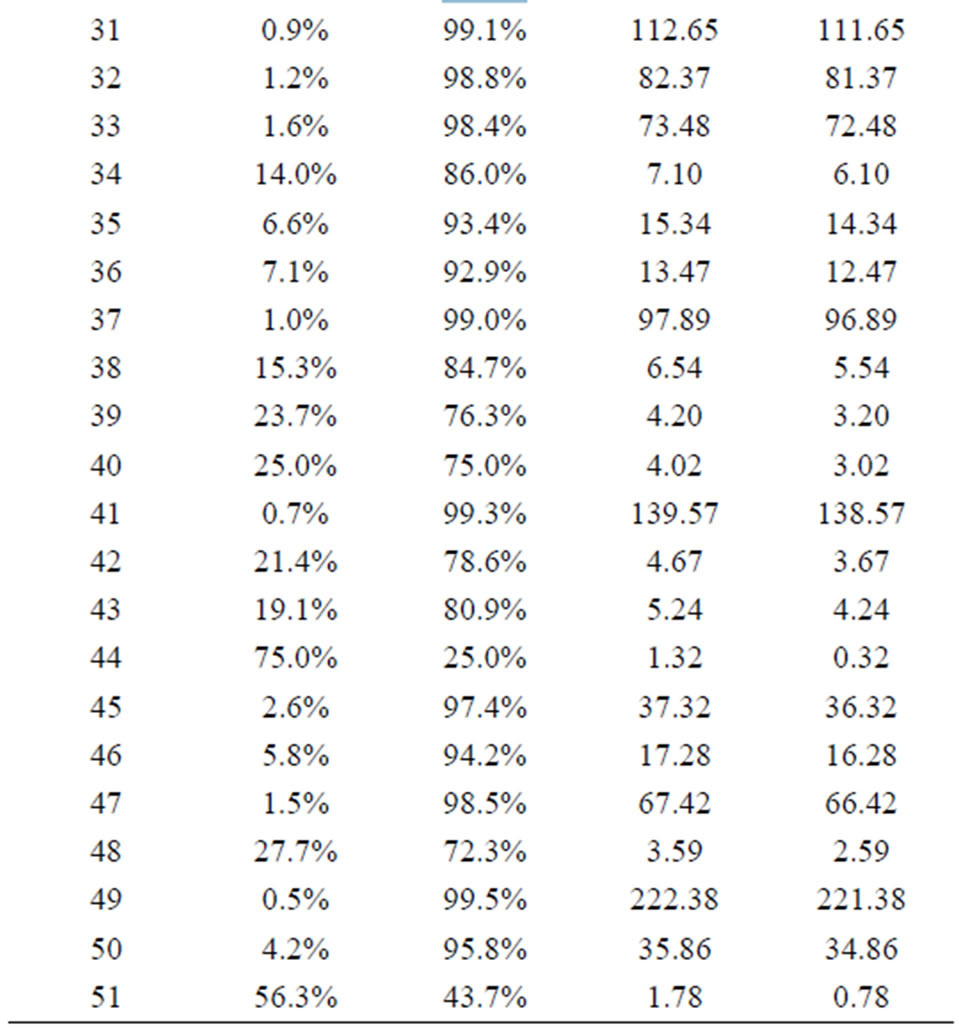
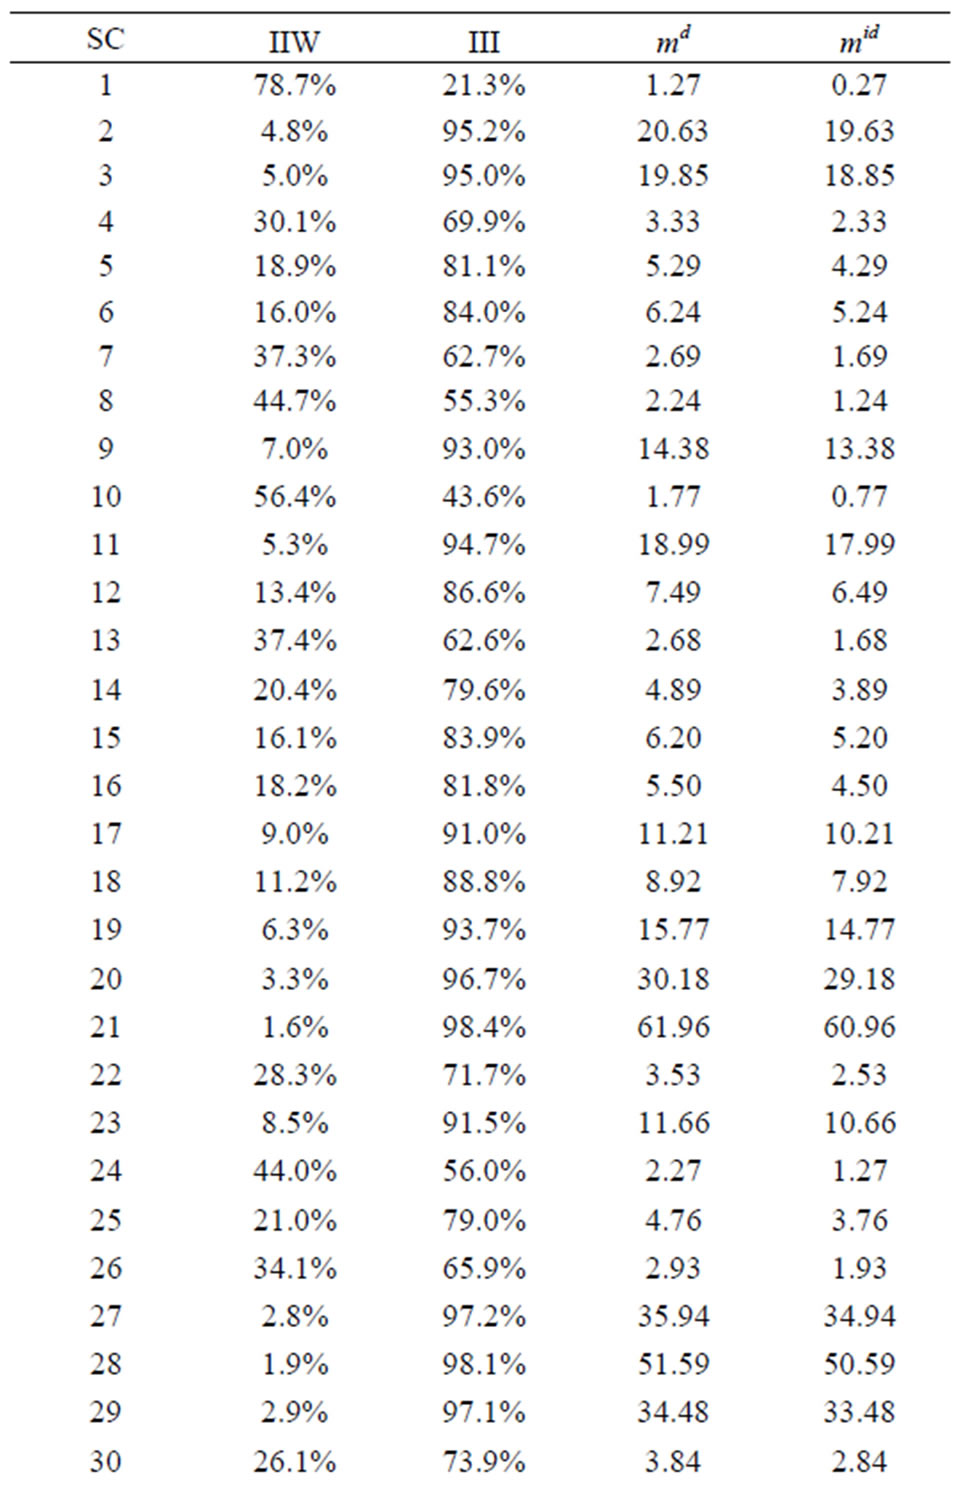
Table 3. The ratios of the direct and indirect water consumption to the total water consumption and the water consumption multipliers for Hai River Basin in 2002.
thousand Yuan. Therefore, these agricultural sectors play a decisive influence on use of the region’s limited water resources. Although indirect water use by the industrial and service sectors revealed that their total water use was higher than that has been traditionally assumed, their water consumption intensities remained lower than those of the agricultural sectors. Electricity, steam, and hotwater production and supply (excluding hydroelectric power), Paper and products, printing and recording medium production, Management of flood and drought control were three industrial sectors have their  value (17.34, 11.22, 10.33) following those of agriculture sectors.
  value of 18 industrial and service sectors were between [1, 4.2],
  values of 28 sectors were smaller than 1.
Some interesting observations can be made by examining the composition of total water consumption (i.e., by comparing direct versus indirect consumption). In agriculture (excluding freshwater fish farming and ecological forest) water use categories, water consumption was primarily direct. As shown in Table 3, direct consumption accounted for 78.7% of the total consumption.
Contrary to the situation in the agricultural sectors, most industrial and service sectors are characterized by relatively high ratios of indirect water consumption to total water consumption. With the exception of sector 44 (24.1%), sector 10 (43.6%), the ratio of indirect water consumption to total water consumption below 50%. To other 47 sectors, the ratio of 24 sectors belong to [90%, 99%], the ratio of 9 sectors belong to [80%, 90%], the ratio of 8 sectors belong to [70%, 80%], the ratio of 4 sectors belong to [60%, 70%], the ratio of 2 sectors belong to [60%, 70%] (See Figure 3 and Table 3). Thus, these sectors appear to have a large drag effect on the water consumption of the whole economy. This can be confirmed by examining the values of the indirect water consumption multiplier (md in Table 3).
Table 3 shows that for each cubic meter of water consumed directly in sector 49, satisfying an increase of production requires the consumption of an additional 222.38 m3 of water by other production sectors. Similarly, in sector 41, each cubic meter of water consumed directly requires the indirect consumption of an additional 139.57 m3 of water by the other sectors. The levels of indirect water consumption were also high for sector 31, sector 37, sector 32, and sector 33. These results show that the sectors with the highest indirect consumption of water are those that are normally considered to be the driving forces behind Hai River Basin economy due to the strong influence that demand for their respective products exerts on the production of the remaining sectors. In other words, increases in the production of these leading sectors require additional inputs from other sectors, locally or nationally.
6.2. Intersectoral Water Transaction
Appendix A.2 shows the intersectoral water transaction coefficients. This new matrix shows that most water transaction coefficients are relatively low; indicating that most water transactions between sectors can be disregarded, since only a few sectors dominate these transactions. As shown in Table 3, sector 40, sector 44, and sector 41 are the sectors characterized by relatively high ratios of indirect water consumption to total water consumption, and the matrix of intersectoral water transaction coefficients (Appendix A.2) show that their indirect water consumption is mainly derived from the agriculture sector. Appendix A.2 thus reveals that for each cubic meter of water consumed directly by sector 40, sector 44, and sector 41 satisfying this water demand requires an
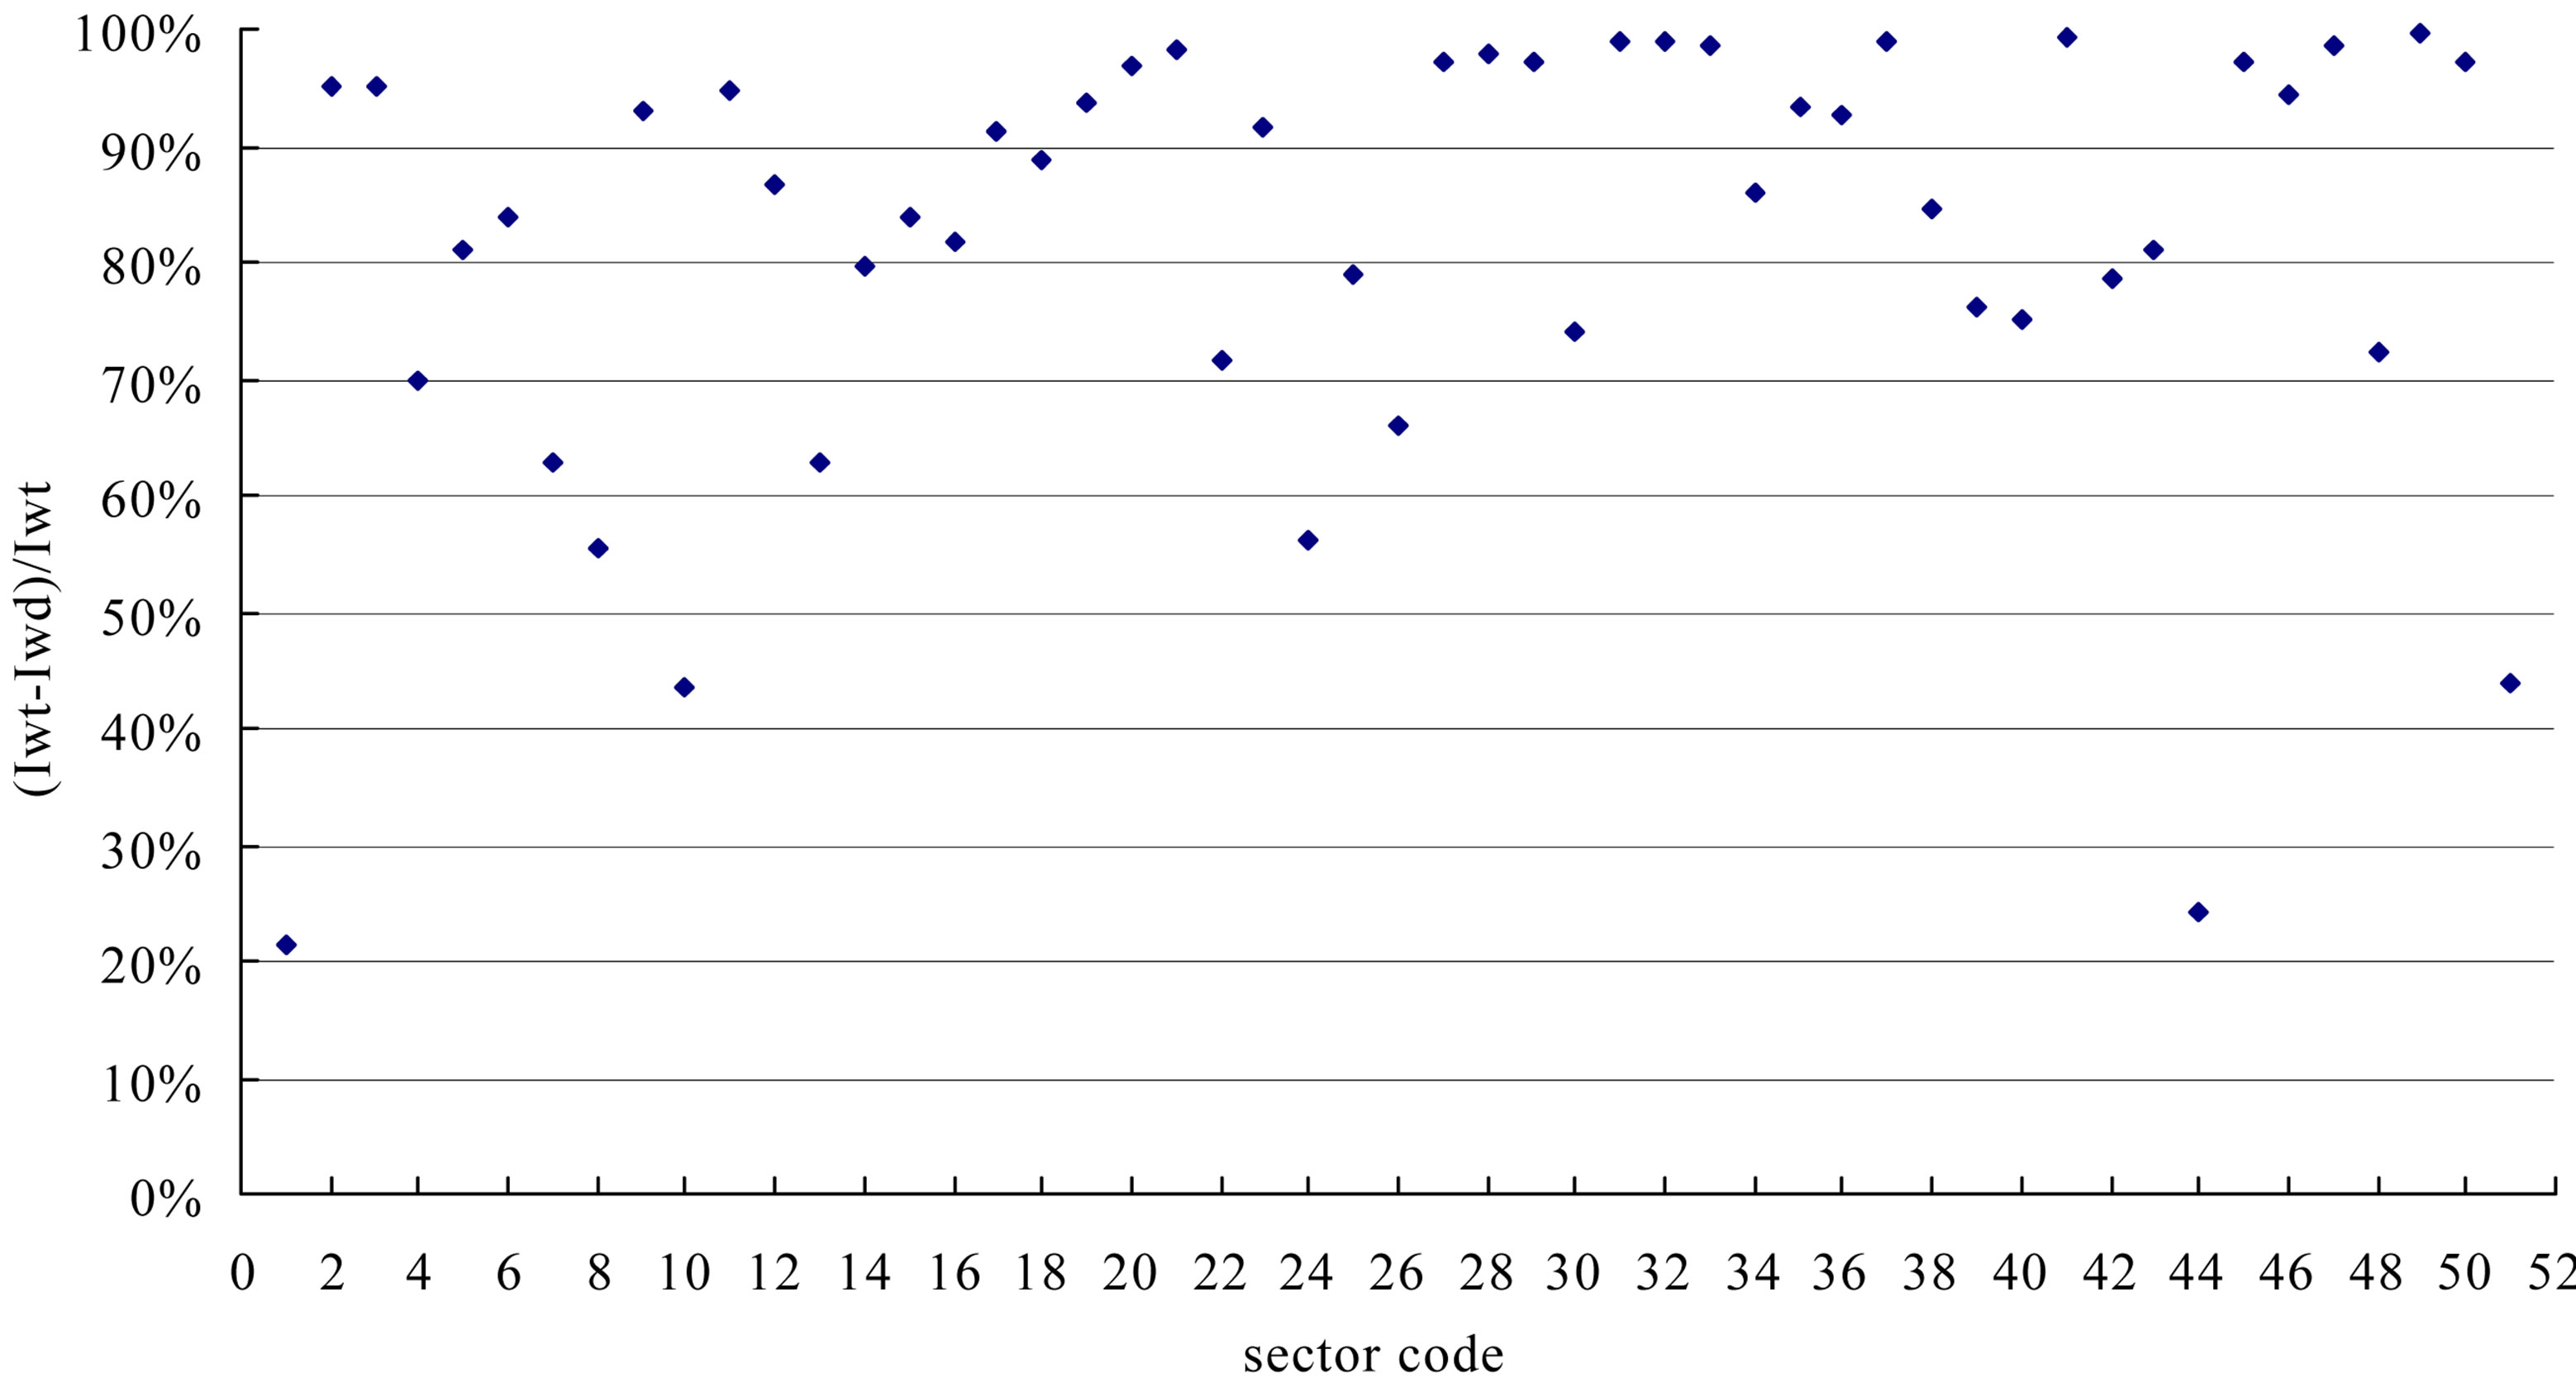
Figure 3. The ratio of indirect water consumption to total water consumption for 51 sectors in Hai River Basin in 2007.
additional 380.2, 303.1, and 73.7 m3 of water, respectively, to be consumed by agriculture.
[36,37] introduced the term “virtual water” to indicate the water consumed during the process of production that cannot be detected as direct consumption. He defined the volume of virtual water “hidden” or “embodied” in a particular product to be the volume of water that is used, both directly and indirectly, in the production of that product. This definition conveys the idea that the water consumed in the present study is first embodied in agriculture products, and then incorporated into other sectors as an intermediate input. Thus, the agriculture sector 1 is the main supplier of Indirect (virtual) water consumption. Apart from the agriculture sector 1, sector 24, sector 10, sectors 12 are also important suppliers of virtual water because of the high water content in their products. These results reveal an important fact: that despite the high direct water consumption by the agricultural sectors, most of the water is first embodied in its products and then flows to other sectors in the form of virtual water. However, because of limited knowledge about the relationship between the overall production structure and physical water use in Hai River Basin, the indirect consumption of water is always neglected by water policy and environmental planners. Finally, it should be pointed out that industrial sectors such as sector 24, sector 3, sector 12, sector 6, sector 11, sector 10 can supply a certain amount of virtual water to Hai River Basin’s economy, if large quantities of imports from outside the region.
6.3. Limitations of Our Analysis
Although input-output analysis offers one of the most robust methodologies for measuring the environmental impacts of economic activity, the limitations of the input-output model should be recognized. In particular, regional input-output tables such as the one used in the present study are not readily available in most cases, and this either restricts the applicability of this method to some regional economies or requires large labor inputs to generate this table. The data required to create such an input-output table (e.g., data on the use of intermediate goods by firms involved in different activities or on the goods consumed by households) are not often available on a regional level. This is particularly true for data on regional exports and imports, which are neither collected by national statistical offices nor easily retrievable even by regional producers themselves. Moreover, surveys to fill gaps in the existing secondary data are very costly. Therefore, various methods have been applied to derive such tables from their national counterparts using all available information about a regional economy. For example, in this study, the technical coefficients matrix (A) for Hai River Basin was derived from the Beijing, Tianjin, Hebei, Shandong, Liaoning, Inner Mongolia, Shanxi, Henan provincial input-output table in 2007. While the productions transferred from other regions into Hai River Basin was not separated from the intermediate inputs in the water conservancy IOO table of Hai River Basin for no supporting data. Although this approach may not be ideal, it makes use of the best available data.
7. Conclusions
This paper established a water consumption and economy analysis integrated model and compiled a water conservancy IOO table for Hai River Basin in China in 2007 for the first time. The merits of the model are those: the model integrated water resource consumption to the economic system, could descript detailed individual sectors’ direct and total water consumption and to trace the sources of indirect water consumption in production activities; fixed assets and import factors were considered in the total water consumption calculation, which make the model more fit for the actual situation.
Applied the model to Hai River Basin in north China, results showed that in Hai River Basin, agriculture sector is responsible for 81.2% of the total fresh water consumption in the region, the industrial and service sectors use a smaller amount of water directly in production, but to the indirect water consumption, industrial and service sectors increased greatly, account for 53.2% of the indirect total water consumption. To per unit output, water consumption intensity was the highest in agriculture sector 1 at 96.91 m3 per thousand Yuan. Water consumption intensities of industrial and service sectors remained lower than those of the agricultural sectors, the value of 28 sectors were smaller than 1. To agriculture sector 1, direct water consumption accounted for 78.7% of the sector total water consumption. In the contrary, to 24 industrial and service sectors, their ratios of indirect water consumption to total water consumption belong to [90%, 99%]. Sector 1, sector 24, sector 3, sector 12, sector 6, sector 11, sector 10 are the main suppliers of indirect (virtual) water consumption.
These results clearly reveal why some agricultural sectors impose a significant pressure on natural freshwater resources and the environment in the Hai River Basin: the magnitude of the production in these sectors, combined with their high direct water use per unit of production, results in a high pressure on the available resource and correspondingly large impacts on the environment. In this sense, slight increases in production of these sectors would greatly increase the consumption of real water. However, it should be noted that the output of grain production had increased about 500% from 1954 to 20041 in Hai River Basin. As a result, the massive expansion of agricultural activities during this period has inevitably resulted in increasing use of water resources, and is likely to be responsible for the observed environmental degradation in the middle and lower reaches of the Hai River. This conclusion strongly suggests the need to improve irrigation technologies and propose changes in the agriculture structure in this region.
The benefits of efficient agriculture irrigation technologies and practices are widely acknowledged. As changing irrigation systems can be a costly undertaking, conservation efforts often concentrate on maximizing the efficiency of the existing system. This may include chiseling compacted soils, creating furrow dikes to prevent runoff, and using soil moisture and rainfall sensors to optimize irrigation schedules. Usually large gains in efficiency are possible through measurement and more effective management of the existing irrigation system.
Although adoption of these measures in Hai River Basin has been slow. Institutional and educational barriers, along with economics, have long been known to be primary factors inhibiting widespread adoption of these technologies. State, local, and regional policy should be directed at identifying and overcoming these implementtation barriers.
As to other points, switching from water-intensive, low-valued crops to higher-valued crops that require smaller diversions of irrigation water, maximizing the value of water-intensive products, reducing the export of virtual water appear and increasing import of virtual water to be necessary strategies for this arid area.
8. Acknowledgements
This work was supported by the National Natural Science Foundation of China (Project No.70701034, 711 73210), the Knowledge Innovation Projects of the Chinese Academy of Sciences (Project No. KSCX1-YW- 09-04, KJCX2-YW-S8) and National Science and Technology Supporting Item (2009BADA9BB01-4). The author appreciate the anonymous reviewers for their helpful comments and suggestions on the paper.
REFERENCES
- D. J. Zhu and J. W. Lu, “The Water-Use Efficiency of Winter Wheat and Maize on a Salt-Affected Soil in the Huang Huai Hai River Plain of China,” Agricultural Water Management, Vol. 23, No. 1, 1993, pp. 67-82. doi: 10.1016/0378-3774(93)90021-2
- CH. M. Liu and J. Xia, “Water Problems and Hydrological Research in the Yellow River and the Huai and Hai River Basins of China,” Hydrological Processes, Vol. 18, No. 12, 2004, pp. 2197-2210. doi: 10.1002/hyp.5524
- X. B. Liu, W. Q. Peng., G. J. He, J. J. Liu and Y. C. Wang, “A Coupled Model of Hydrodynamics and Water Quality for Yuqiao Reservoir in Haihe River Basin,” Journal of Hydrodynamics, Series B, Vol. 20, No. 5, 2008, pp. 574-582.
- P. G. Yang, R. Z. Mao and H. B. Shao, “An Investigation on Magnetic Susceptibility of Hazardous SalineAlkaline Soils from the Contaminated Hai River Basin, China,” Journal of Hazardous Materials, Vol. 172, No. 1, 2009, pp. 494-497. doi: 10.1016/j.jhazmat.2009.07.011
- L. Wang, G. G. Ying, J. L. Zhao, X. B.Yang, F. Chen, R. Tao, SH. Liu and L. J. Zhou, “Occurrence and Risk Assessment of Acidic Pharmaceuticals in the Yellow River, Hai River and Liao River of North China,” Science of the Total Environment, Vol. 408, No. 16, 2010, pp. 3139-3147. doi: 10.1016/j.scitotenv.2010.04.047
- Y. H. Zhu, S. Drake, H. SH. Lüand J. Xia, “Analysis of Temporal and Spatial Differences in Eco-environmental Carrying Capacity Related to Water in the Haihe River Basins, China,” Water Resources Management, Vol. 24, No. 6, 2010, pp. 1089-1105. doi: 10.1007/s11269-009-9487-1
- S. L. Lu, B. F. Wu, H. Wang, N. L. Ouyang and SH. Y. Guo, “Hydro-Ecological Impact of Water Conservancy Projects in the Haihe River Basin Original Research Article,” Acta Oecologica, 2011, in Press. doi: 10.1016/j.actao.2011.07.003
- C. H. Xu, Y. Luo and Y. Xu, “Projected Changes of Precipitation Extremes in River Basins over China,” Quaternary International, Vol. 244, No. 2, 2011, pp. 149- 158. doi: 10.1016/j.quaint.2011.01.002
- X. R. Huang, Y. S. Pei and C. Liang, “Input-Output Method for Calculating the Virtual Water Trading in Ningxia,” Advances in Water Science, Vol. 27, No. 3, 2005, pp. 135-139.
- J. L. Zhang, “Barriers to Water Markets in the Heihe River Basin in Northwest China,” Agricultural Water Management, Vol. 87, No. 1, 2007, pp. 32-40. doi: 10.1016/j.agwat.2006.05.020
- J. Khouri, “Sustainable Development and Management of Water Resources in the Arab Region,” Developments in Water Science, Vol. 50, 2003, pp. 199-220. doi: 10.1016/S0167-5648(03)80018-7
- L. Mehta, “Whose Scarcity? Whose Property? The Case of Water in Western India,” Land Use Policy, Vol. 24, 2007, pp. 654-663. doi: 10.1016/j.landusepol.2006.05.009
- E. Velazquez, “An Input-Output Model of Water Consumption: Analyzing Intersectoral Water Relationships in Andalusia,” Ecological Economics, Vol. 56, 2005, pp. 226-240.
- E. Hellsten, S. Ribacke and G. Wickbom, “SWEEASwedish Environmental and Economic Account,” Structural Change and Economic Dynamics, Vol. 10, No. 1, 1999, pp. 39-72. doi: 10.1016/S0954-349X(98)00059-9
- United Nations, Eurostat, International Monetary Fund, Organisation for Economic Co-operation and Development, World Bank, “System of National Accounts,” Series F, 2. United Nations, New York, 1993.
- S. J. Keuning, J. V. Dalen and M. D. Haan, “The Netherlands’ NAMEA: Presentation, Usage and Future Extensions,” Structural Change and Economic Dynamics, Vol. 10, No. 1, 1999, pp. 15-37. doi: 10.1016/S0954-349X(98)00058-7
- M. Jesper, M. Wier and M. Lenzen, “Using Input-Output Analysis to Measure the Environmental Pressure of Consumption at Different Spatial Levels,” Journal of Industrial Ecology, Vol. 9, No. 1-2, 2005, pp. 169-185.
- M. Lenzen, “Primary Energy and Greenhouse Gases Embodied in Australian Final Consumption: An InputOutput Analysis,” Energy Policy, Vol. 26, 1998, pp. 495- 506. doi: 10.1016/S0301-4215(98)00012-3
- M. Lenzen, “A Guide for Compiling Inventories in Hybrid LCA: Some Australian Results,” Journal of Cleaner Production, Vol. 10, 2002, pp. 545-572. doi: 10.1016/S0959-6526(02)00007-0
- M. Lenzen, “Environmentally Important Linkages and Key Sectors in the Australian Economy,” Structural Change and Economic Dynamics, Vol. 14, 2003, pp. 1-34. doi: 10.1016/S0954-349X(02)00025-5
- K. Hubacek and L. Sun, “A Scenario Analysis of China’s Land Use Change: Incorporating Biophysical Information into Input-Output Modeling,” Structural Change and Economic Dynamics, Vol. 12, No. 4, 2001, pp. 367-397. doi: 10.1016/S0954-349X(01)00029-7
- S. Giljum, K. Hubacek and L. Sun, “Beyond the Simple Material Balance: A Reply to Sangwong Suh’s Note on Physical Input-Output Analysis,” Ecological Economics, Vol. 48, No. 1, 2004, pp. 19-22. doi: 10.1016/j.ecolecon.2003.09.004
- S. Suh, M. Lenzen and G. J. Treloar, “System Boundary Selection in Life-Cycle Inventories Using Hybrid Approaches,” Environmental Science and Technology, Vol. 38, 2004, pp. 657-664. doi: 10.1021/es0263745
- T. Wiedmann, J. Minx, J. Barrett and M. Wackernagel, “Allocating Ecological Footprints to Final Consumption Categories with Input-Output Analysis,” Ecological Economics, Vol. 56, 2006, pp. 28-48. doi: 10.1016/j.ecolecon.2005.05.012
- K. Hikita, K. Shimpo and M. Shukla, “Making InputOutput Tables for Environmental Analysis for India: 1993/94 and 1998/99,” Sixteenth International Conference on Input-Output Techniques, Istanbul, 2007.
- E. M. Lofting and P. H. McGauhey, “Economic Valuation of Water. An Input-Output Analysis of California Water Requirements,” Contribution 116. University of California Water Resources Center, Berkeley, 1968.
- X. K. Chen, “Shanxi Water Resource Input-OccupancyOutput Table and Its Application in Shanxi Province of China,” Thirteenth International Conference on InputOutput Techniques, Macerata, 2000.
- H. Bouhia, “Water in the Macro Economy: Integrating Economics and Engineering into an Analytical Model,” Ashgate Publishing Limited, Hampshire, 2001.
- R. Duarte, J. S. Choliz and J. Bielsa, “Water Use in the Spanish Economy: An Input-Output Approach,” Ecological Economics, Vol. 43, No. 1, 2002, pp. 71-85. doi: 10.1016/S0921-8009(02)00183-0
- W. Leontief, “Input-Output Economics,” Oxford University Press, New York, 1966.
- A. Manresa, F. Sancho and J. M. Vegara, “Measuring Commodities’ Commodity Content,” Economic Systems Research, Vol. 10, No. 4, 1998, pp. 357-365. doi: 10.1080/09535319800000026
- P. Gay and J. L. R. Proops, “Carbon Dioxide Production by the UK Economy: An Input-Output Assessment,” Applied Energy, Vol. 44, No. 2, 1993, pp. 113-130. doi: 10.1016/0306-2619(93)90057-V
- J. Domagalski, X. Q. Zhou, C. Lin, D. G. Zhi, L. C. Fan, K. T. Xu, Y. Lü, Y. Luo, S. D. Liu, D. W. Liu, Y. Guo, Q. Tian, J. Liu, W. D. Yu, R. Shedlock and D. Knifong, “Comparative Water-Quality Assessment of the Hai He River Basin in the People’s Republic of China and Three Similar Basins in the United States,” U.S. Geological Survey Professional Paper, 1647, Sacramento, California, 2001.
- X. K. Chen, “Input-Occupancy-Output Analysis and Its Application in China,” Macmillan Press, London, 1990.
- CH. Lin, “Hai He River Water Conservancy Commission,” Written Commun, 1998.
- J. A. Allan, “Virtual Water: A Long Term Solution for Water Short Middle Eastern Economies?” SOAS Water Issues Study Group, Occasional Papers, London, 1997.
- J. A. Allan, “ Virtual Water: A Strategic Resource. Global Solutions to Regional Deficits,” Groundwater, Vol. 36, No. 4, 1998, pp. 545-546. doi: 10.1111/j.1745-6584.1998.tb02825.x
Appendix A.1.
Sector classification of the Input-Occupancy-Output table on water conservancy for Hai River Basin in China
There are 39 non-water conservancy sectors:
1. Agriculture (Excluding Freshwater Fish Farming and Ecological Forest)
2. Coal Mining and Processing
3. Extraction of Petroleum and Natural Gas
4. Mining and Processing of Metal Ores
5. Mining and Processing of Nonmetal Ores
6. Processing and Manufacture of Foods and Tobacco Products
7. Manufacture of Textile
8. Manufacture of Wearing Apparel, Footware and Caps, Leather, Fur, Feather and Related Products
9. Timber Processing and Furniture Manufacturing
10. Manufacture of Paper and Paper Products, Printing, Manufacture of Articles For Culture, Education and Sport Activities
11. Processing of Petroleum, Coking, Processing of Nuclear Fuel
12. Chemical Industry
13. Manufacture of Non-Metallic Mineral Products
14. Smelting and Pressing of Metals
15. Manufacture of Metal Products
16. Mechanical Industry
17. Manufacture of Transport Equipment
18. Manufacture of Electrical Machinery and Equipment
19. Electronic and Communications Equipment Manufacturing
20. Manufacture of Measuring Instruments and Machinery for Cultural Activity and Office Work
21. Mechanical Equipment Repair Industry
22. Other Manufacturing
23. Waste and Scrap
24. Production and Supply of Electric Power, Steam and Heat Power (Excluding Hydro)
25. Production and Supply of Gas
26. Construction (Excluding Water Conservancy Construction)
27. Freight Transport and Warehousing (Excluding River Freight Transport)
28. Postal Service
29. Wholesale and Retail Trade
30. Catering Services
31. Passenger Transport (Excluding River Passenger Transport)
32. Finance and Insurance
33. Real Estate
34. Social Services (Excluding Wastewater Treatment)
35. Health Services, Sports, and Social Welfare
36. Education, Culture and Arts, Radio, Film and Television Industry
37. Scientific Research
38. Other Comprehensive Technical Services (Excluding Water Ecology and Water Management)
39. Administration and other Services There are 12 water conservancy sectors:
40. Construction for Flood Control and Waterlogged Elimination and Dredging Waterway
41. Management of Flood Control and Disaster Mitigation
42. Construction for Water Ecological Environment Protection
43. Water Eco-Environment Construction (Non-Construc tion)
44. Special Water Source Projects and Specific Hydroelectric Power Engineering Construction
45. Water Supply and Utilization Management Industry
46. Wastewater Treatment Industry
47. Irrigation and Rural Water Supply Industry
48. Urban and Industrial Water Supply Industry
49. Hydropower
50. River Navigation Industry, Freshwater Aquaculture
Appendix A.2.
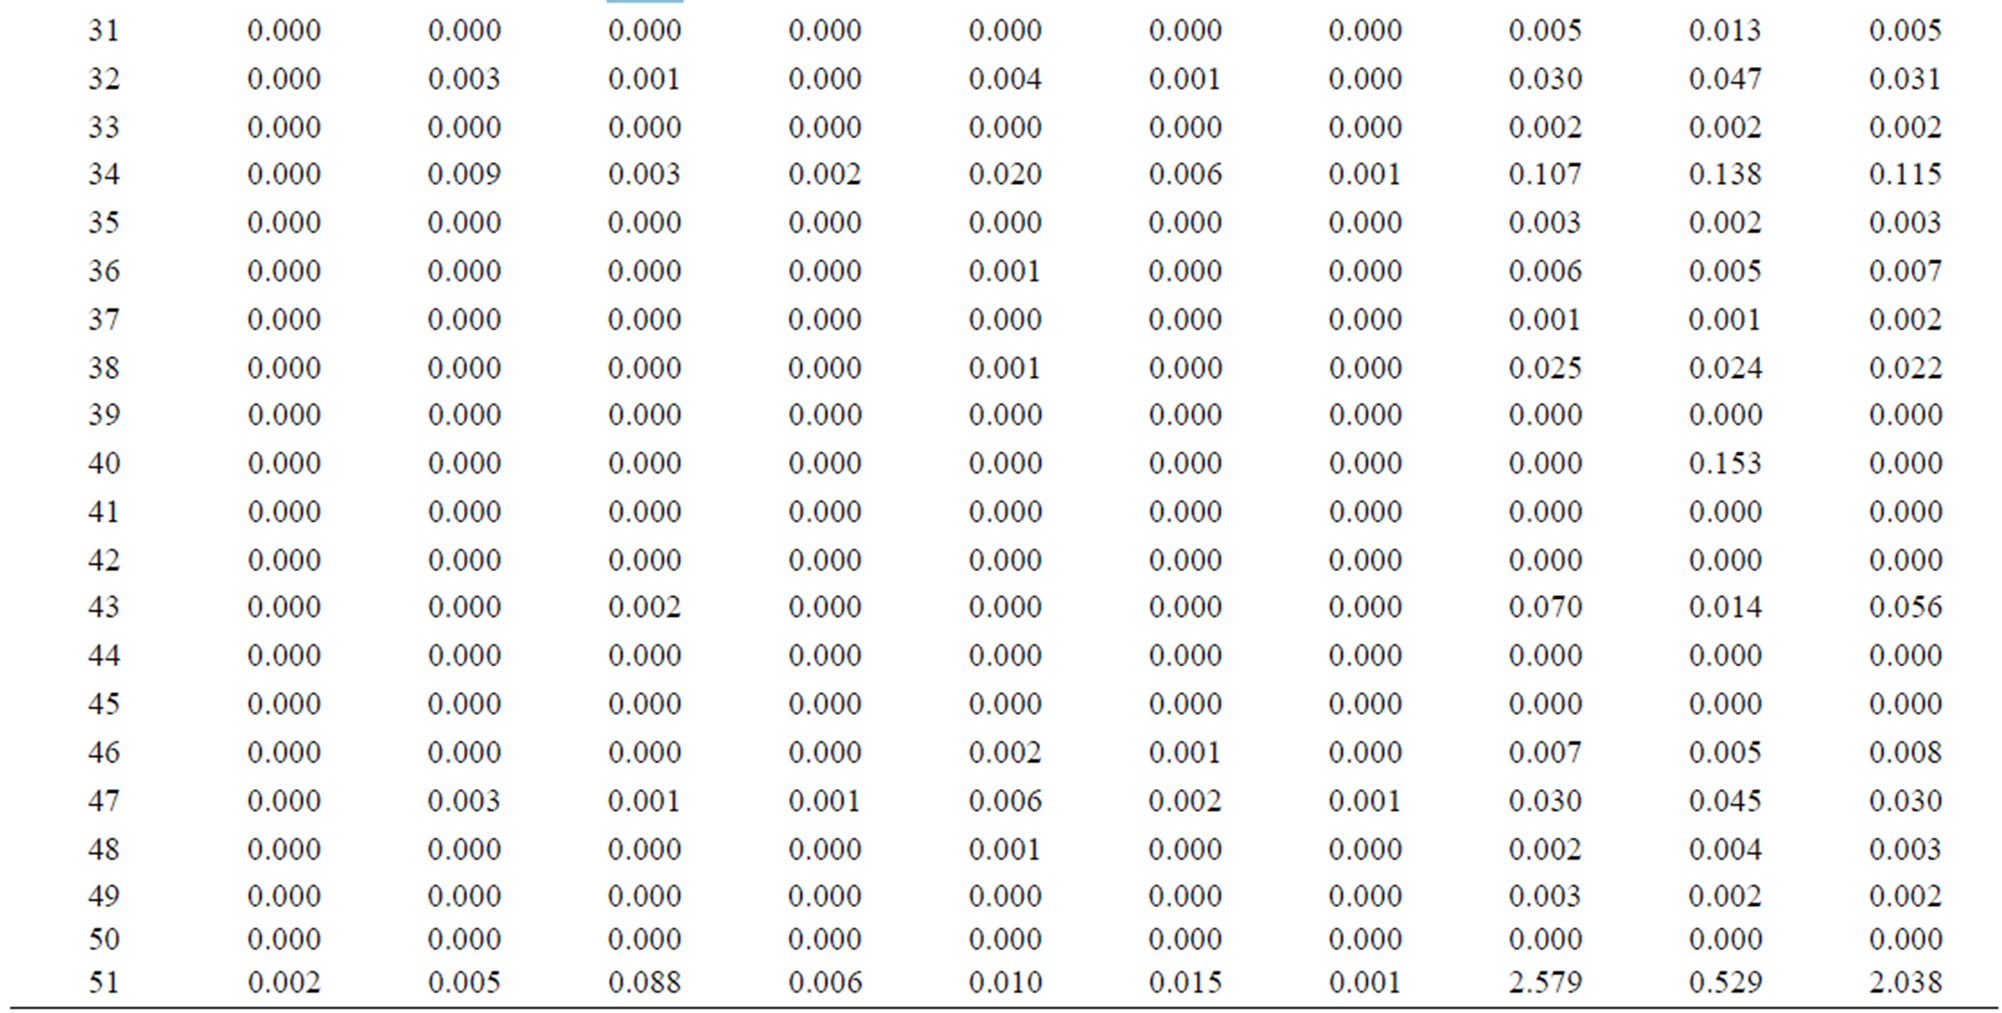
The water transaction coefficient for main sectors of Hai River Basin in 2007.

NOTES
1http://www.hwcc.gov.cn/pub/hwcc/ztxx/hhslw/12345/12347/200409/t20040908_110339.html