Journal of Water Resource and Protection
Vol. 3 No. 12 (2011) , Article ID: 16398 , 15 pages DOI:10.4236/jwarp.2011.312096
Characterization of the Hydrogeological Conditions of Some Portions of the Neoproterozoic Voltaian Supergroup in Northern Ghana
Department of Earth Science, University of Ghana, Accra, Ghana
E-mail: *smyidana@ug.edu.gh, yidanas117@gmail.com
Received October 3, 2011; revised November 5, 2011; accepted December 2, 2011
Keywords: Savelugu-Nanton, Regression, Specific Capacity, Transmissivity, Yield, Kriging
ABSTRACT
Spatial variations in the essential aquifer parameters obtained through regular aquifer tests were evaluated for some aquifers of the Neoproterozoic sedimentary aquifers of the Voltaian Basin. Ordinary least squares regression models have also been developed to relate aquifer transmissivity and specific capacity, and well yield and transmissivity. These analyses suggest that in the northern parts of the Voltaian, aquifer transmissivity exists in a non-linear relationship with specific capacity and yield. This is in keeping with the findings of previous research in the southern part of the Voltaian, and deviates from the regular Dupuit-Thiem relationship between the two major aquifer parameters. Lithology specific models have been developed in this study. The exponent of the non-linear models appears to be related to the lithology, and tends to approach unity in the mudstone and siltstone aquifers, whilst manifesting obvious departures from nonlinearity amongst the sandstone aquifers. This study finds that the sandstone aquifers are the most prolific and offer themselves as the best lithologies for drilling successful wells in the area. Linear prediction maps suggest that the most prolific aquifers are located in the northern parts of the study area, where aquifer transmissivity, specific capacity, and well yield values are quite high due to enhanced secondary permeabilities. There has been no obvious relationship between the major aquifer parameters and static water levels, which are quite high in the middle and western sections of the study area. The hydrogeological properties of rocks within the Voltaian appear to be based on discrete structural entities which manifest high variability in the study area. Even within the same lithology, standard deviations are quite high in the data for all the aquifer parameters examined in this study.
1. Introduction
Specific capacity, which is the ratio of the discharge from a well to the corresponding draw down in the hydraulic head of the aquifer, is similar to aquifer transmissivity and is much easier to determine in the field at modest to low costs. This parameter is in part, a function of the hydraulic properties of the aquifer and has been historically used to quantity the productivity of a well and to determine where to install the pump to ensure its optimal delivery [1]. Due to the relative ease of estimating specific capacity, data for this parameter are relatively much more abundant than those of aquifer transmissivity, which has to be determined from time-drawdown data. Therefore, a cost effective method of estimating aquifer transmissivity for proper characterization of aquifers will require the use of specific capacity data and any relationship that exists between the latter and the former. Incorporating specific capacity into hydrogeologic assessments allows a more rigorous characterization of the hydraulic properties of a regional aquifer and leads to a better understanding of flow in an aquifer [1,2].
Several hydrogeologists have made attempts to relate specific capacity and transmissivity so that the latter can be estimated when data for the former are available. There are various ways of relating the two parameters and for correcting specific capacity data to account for partial penetration, turbulent well losses, and fracture flow [1]. These are the analytical, empirical, geostatistical, and hybrid approaches for relating aquifer transmissivity with specific capacity. Thomason et al. [3] developed one of the first models relating aquifer specific capacity with transmissivity. Their model was based on the famous Dupuit-Thiem steady state equation. The Theis [4] nonequilibrium equation also relates aquifer transmissivity and specific capacity and is known to provide a much more definitive and robust approach to the determination of transmissivity and storativity under laminar flow conditions. The first empirical models were developed by Eagon and Johe [5], and improved upon by Razack and Huntley [6]. These were followed up by several other empirical relationships [7-11]. The application of geostatistical approaches to the estimation of aquifer transmissivity from specific capacity was pioneered by Delhomme [13,14] and Aboufirasi and Marino [15]. Several other studies resulted from these pioneering publications [16-18].
The best approach to use depends on several factors including well construction, aquifer setting, pumping rates, the number of available tests, and the accuracy of the applied tests [1]. Properties of the aquifer setting that influence the values of specific capacity are the transmissivity and storativity, which are the two most important aquifer properties, and the aquifer type. Specific capacity is directly proportional to transmissivity and storativity. For instance greater storativity leads to less drawdown and thus higher values of specific capacity. The well setting, which includes the radius of the well, the degree of penetration, well losses arising from well construction, influences the values of specific capacity. Specific capacity is higher with larger well radius for the same aquifer. This is because a larger well radius increases the surface area for more water to flow into the well. Therefore, not as much drawdown in the head occurs when the same amount of water is pumped out. The degree of penetration of the well through the aquifer also influences the value of the resulting specific capacity. A partially penetrating well will yield a lower specific capacity than a fully penetrating one. For the penetrated portion of the aquifer, there is the tendency to overestimate specific capacity due to the likelihood of vertical groundwater flow from the non-penetrated part of the aquifer.
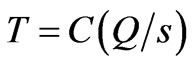
The relationship between specific capacity and transmissivity is based on the well-known Dupuit-Thiem equation for steady state flow conditions [19] and apply only to confined situations. The relationship can be generalized in the form of Equation (1).
 (1)
(1)
where T, Q, s are respectively the transmissivity, discharge and drawdown. The term Q/s defines the specific capacity of the aquifer.
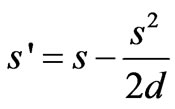
The constant, C, has been found to range between 0.9 and 1.5 with an average of 1.2 [20]. Under unconfined conditions, Equation (2) [19,21] is used to correct the drawdown for the determination of the specific capacity. Johnson et al. [22] found C to be 1.10 for wells in confined alluvial aquifers assuming a unit well radius and a radius of influence of 1000 ft (300 m). Adyalkar and Mani [23] determined C to range between 0.23 and 0.34 and as high as 0.44 for large-diameter wells in a fractured aquifer. They expected that C would be lower for less permeable fractured formations. Adyalkar et al. [24] calculated C to be 0.42 for the weathered zone of massive and vesicular basalts of the Deccan Trap in India. Thus the value of C will depend among other things, on the aquifer type (confined, unconfined, semi-confined, leaky aquifer etc.), and the material of the aquifer.
 (2)
(2)
where d is the saturated thickness of the unconfined aquifer.
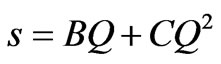
Some of these relationships between transmissivity and specific capacity apply to only laminar flow situations and do not account for turbulent flows to wells. However, the total drawdown in a well is the sum total of the laminar flow and turbulent flow. This is summarized in the relationship suggested in Equation (3) [6,20].
 (3)
(3)
where B and C refer to the laminar and turbulent flow factors respectively.
The nonlinear aspect of Equation (3) accounts for nonlaminar flow situations. Most relationships between transmissivity and specific capacity are non-linear and result from log-transformation of the original data of both parameters to take the semblance of normal distribution. Normal distribution is a key requirement of optimal multivariate statistical modeling. Therefore, in order to develop a reliable statistical model between aquifer transmissivity and specific capacity, data for both parameters must be normally distributed. In the light of the fact that both parameters are log-normal, it has been observed that the relationship between the parameters improve with a higher value of the coefficient of regression when the data is log-transformed [6,9-11,25-27]. Some other studies produced higher coefficients of regression with raw data than the log-log values [21].
Razack and Huntley [6] determined the relationship between transmissivity and specific capacity based on regression analyses of the data for both parameters in some alluvial aquifers in Morocco. Huntley et al., [7] derived a geometrical relationship between transmissivity and specific capacity for wells completed in batholiths of the Peninsular Ranges of San Diego County, USA. A high regression coefficient was realized which shows the degree of dependence of transmissivity on specific capacity for the location. Such a relationship can only be applied safely to batholithic aquifers in similar climatic zones in order to achieve optimally representative estimations of the transmissivity values. The reliability of such estimates hinges on the strength of the relationship as indicated by the coefficient of regression, the representativeness and accuracy of the original data used. Regionally representative and large datasets can yield quite robust regression relationships. Mace [11] used a similar approach to establish a model relating transmissivity and specific capacity using data of the two parameters from the Karstic Edwards Aquifer in Texas. The spatial distribution of these important aquifer properties depends on the pervasiveness of the processes controlling them in space. For instance in a fractured rock aquifer system, the hydraulic properties are determined by the fracture geometry and the pervasiveness of the fractures.
In Ghana, Acheampong and Hess [12] derived a regression model for aquifers of the southern Voltaian in the Afram Plains area based on 28 data pairs of transmissivity and specific capacity. Later, Yidana et al., [27] developed a much more robust relationship using 41 data pairs for the same area, with a much more improved coefficient of regression. The resulting relationship suggested a non-linear relation between the two parameters. The significance of these relationships lies in the fact that aquifers of the Voltaian SuperGroup are quite complex with significant variations in aquifer properties in space. Thus although one relationship can be applied to the larger Voltaian, location specific models would yield much more optimal results.
This research characterizes the hydrogeology of some parts of the Voltaian SuperGroup in some parts of Northern Ghana. Ordinary least squares regression has been applied to develop an empirical relationship between aquifer transmissivity and specific capacity. Similar models have also been developed between transmissivity and some borehole parameters such as yield, depth and static water level. A geostatistical tool was also applied to estimate the spatial spread of aquifer transmissivity in the study area.
2. The Study Area
The study area shares boundaries with four districts in the northern region, east and southeast by Karaga and Yendi Districts respectively, to the North by West Mamprusi District and the south by Tamale metropolis. The district shares border with Tolon-Kumbungu District to the west (Figure 1).
Figure 1. Map of study area.
The main drainage system in the district is made up of White Volta and its tributaries. The effect of the drainage system is felt mostly in the northern part of the district covering the areas between Nabogu and Kukuobilla. One of the tributaries of the White Volta, Kuldalnali, stretches to constitute a natural boundary between the district and Tolon/Kumbungu district.
The area lies within the tropical Continental or Interior Savannah Climatic Zone. It experiences a single rainfall season, which starts from May and ends in October. The annual rainfall ranges between 1005 and 1150 mm, with the heaviest rains occurring in August [28].
Daily temperatures are generally high (above 35˚C) except in the harmattan season (November-February) when the temperatures can get as low as 20˚C or less, especially during the night. The mean monthly temperatures vary from about 36˚C in March/April to about 27˚C in August. Relative humidity is high during the rainy season (65% - 85%) but may fall to as low as 20% during the dry season. Daily sunshine duration is about 7 hours except in the rainy days of June to September when it ranges from 6.9 hr to 4.7 hr [28].
Geological and Hydrogeological Setting
The District is underlain by rocks of the Upper and Middle Voltaian. The Upper Voltaian, comprising sandstone and underlies a small portion of the district at the extreme northwest. The sandstones range from massive to thinly bedded rocks in places. The Middle Voltaian are mainly the Obosum and Oti beds that comprise shale, mudstone, sandstone, limestone and conglomerate form practically the basement rocks that underlie the area [29]. Figure 2 presents a geological map of the study area.
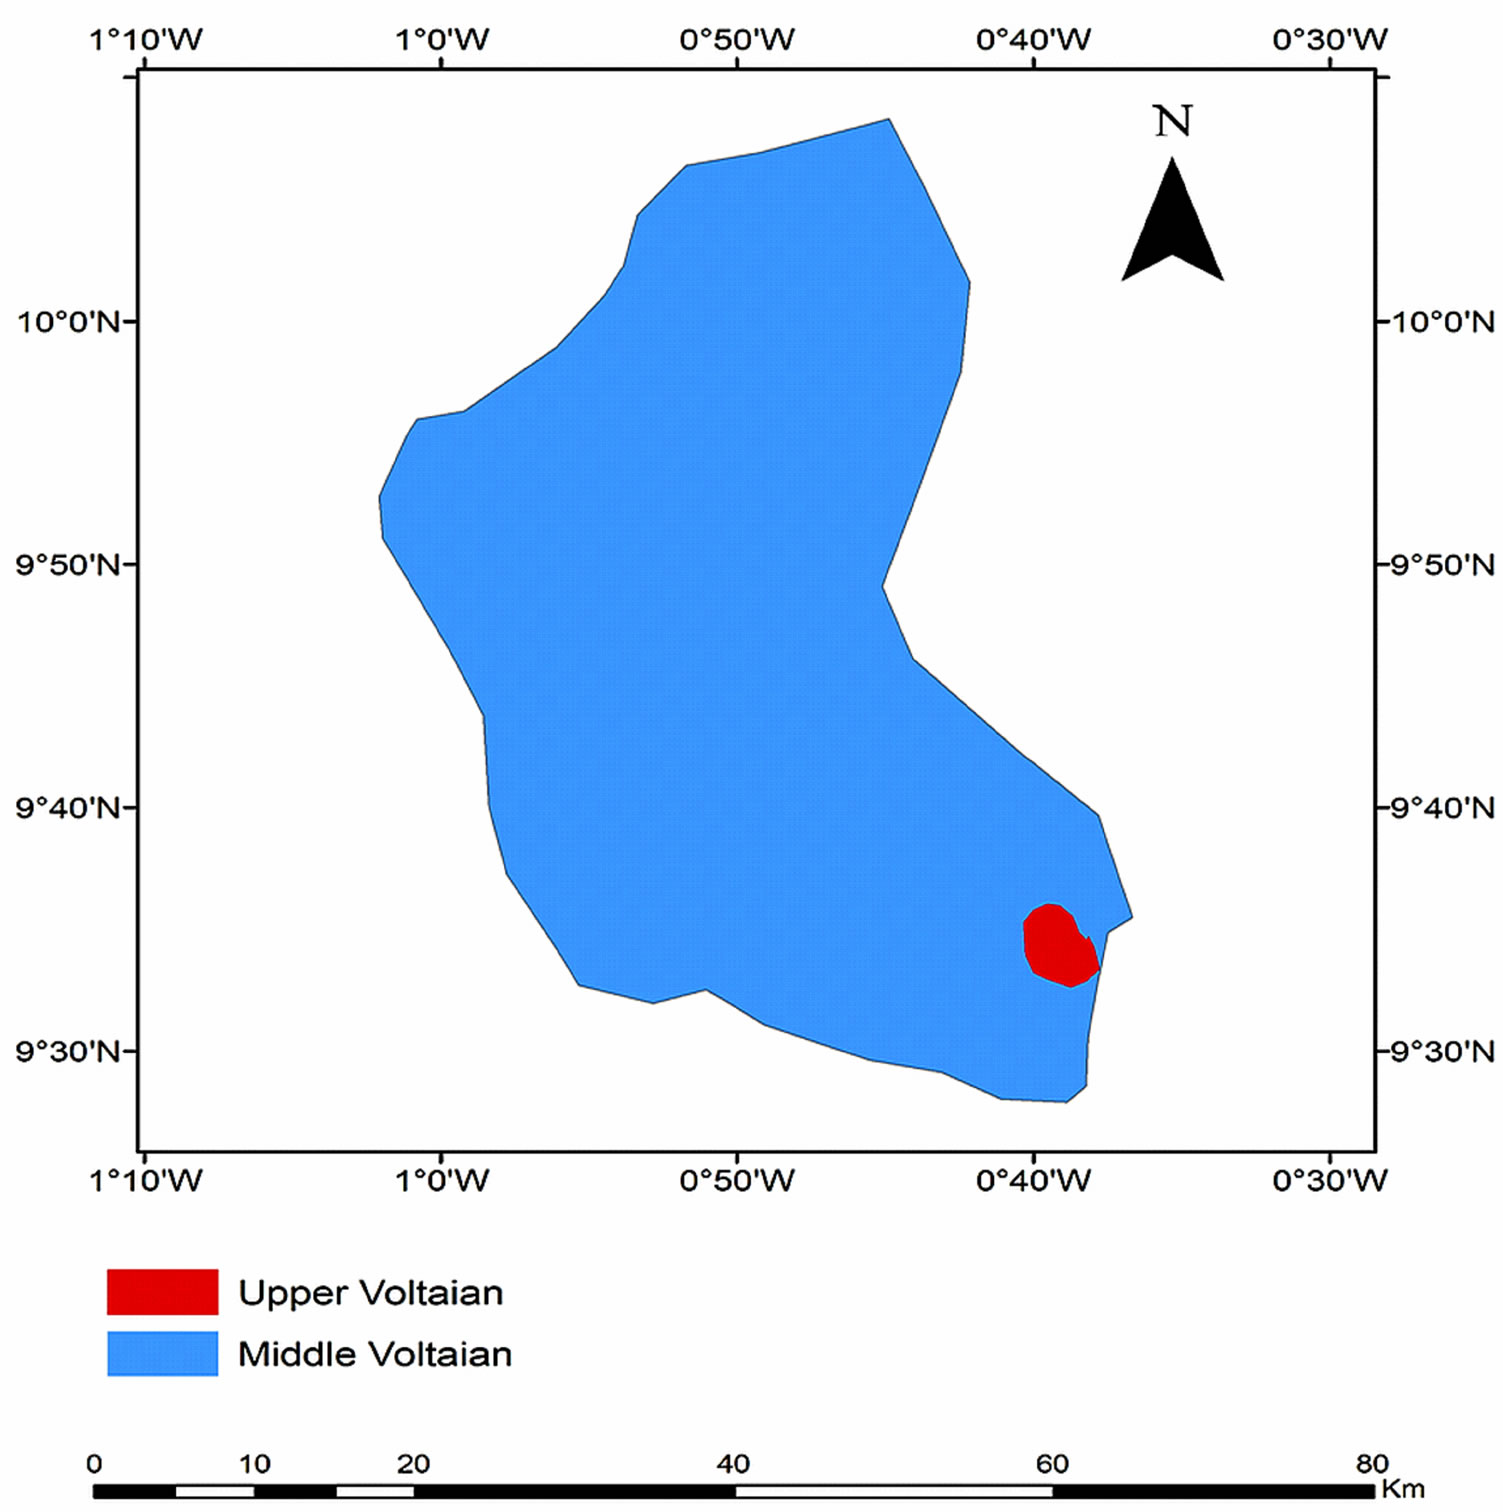
Figure 2. Geological map of the study area.
The Neoproterozoic Voltaian sedimentary rocks behave largely like hard rocks in terms of groundwater occurrence. Whereas the areas underlain by the mudstones are impermeable, lateritic cover also renders most of the shale poor in groundwater. The sandstones are largely impervious but where they are well jointed, they produce permeable horizons upon weathering. The main sources of groundwater supply are weathered layer or regolith developed on the rocks, and fractures within the bedrock [30]. Wherever the saturated regolith is thin or absent, sufficient permeability has to be identified in the jointed sandstone such that local drawdown interacts with storage in the overlying or adjacent regolith to provide sustained yield.
Some of the Voltaian rocks underlying the area have undergone low grade metamorphism and are well compacted and consolidated. That is groundwater occurrence is closely associated with the existence of faults, joints, fractures bedding planes and weathered zones as well as grain sizes of the beds [31].
The Upper Voltaian made up of sandstone and quartzites are fairly hard and well consolidated and therefore inherently impermeable. It is however characterized by well developed and extensive open joints and permeable planes in contact with other rock formations [32].
The units of middle Voltaian are well consolidated and compacted and are essentially impermeable. Groundwater occurrence is dependent on development of secondary permeabilities as a result of fracturing and jointing and existence of permeable bedding planes. Groundwater also occurs in significant quantities when the rocks are heavily schistosed. Where shales, siltstone and mudstones occur groundwater potential is low and only in weathered and fissured zone that groundwater can be expected to occur in appreciable quantities.
Two types of recharge (direct and indirect) occur in the area as a result of the harsh climatic conditions and topography of the landscape. Direct recharge occurs at relatively high ground where fissured zones are exposed to the surface. It also occurs within the alluvial deposits and soils where the iron pan is discontinuous and the argillite (clay products and mica) content of the weathered zone is low [33]. Indirect recharge principally occurs in areas of low rainfall, low relief and low permeability (i.e. in areas underlain by the Obosum beds).
In view of the low relief, rainfall and permeability, the indirect recharge is predominant in the District. During a storm event with significant magnitude to cause runoff, the drainage courses or streams which act as conduit for these overland flows are generally weak fissured zones which allow a greater part of the runoff to infiltrate through their beds to the groundwater table. Permanent rivers such as the White Volta also contributes significant amount of water to the zone of saturation either by infiltration through permeable stream beds, bank storage through alluvial soil or when the stream intersects a fractured, jointed or fault zone [31].
3. Methodology
Data on the hydrogeological properties of aquifers in the study area were obtained for existing wells from the Community Water and Sanitation Agency, CWSA, in Tamale, Northern Region. Data on aquifer transmissivity, specific capacity, well yield, well depth, and static water levels were acquired for this study. Such data were obtained during pumping tests which are usually performed after well drilling, completion, and development. It involves sustained pumping at a constant rate for a sufficiently long period (averagely 24 - 72 hours) to induce transient conditions. The results of pumping tests become representative and make sense only when the aquifer is sufficiently stressed through the pumping for a reasonable length of time. The pumping rate is usually determined by the well yield. Where the well yield is low, slug tests are encouraged due to the likelihood of drying out wells of insufficient yield during pumping tests. In Ghana in general and the study area in particular, slug tests have not been performed: all wells completed by the CWSA or its contractors are required to be pump-tested, even if the yield is low. Standard procedures require that pumping be performed in one well and the resulting changes in groundwater level are read in an observation well which penetrates the full thickness of the same aquifer. Unfortunately, the general practice in Ghana has been to perform both the pumping and observation of water levels in the same well. The difficulty with this practice is that turbulent water losses result in errors in the measurement of the water levels in wells. However, results from such tests produce reasonably representative characteristics of aquifers for basin characterization. This has been the practice in most developing economies where well drilling or groundwater development is driven by domestic water needs in communities.
Data were obtained for 75 wells completed in sandstones, mudstones, shale, and limestone aquifers in the study area. Groundwater occurrence in the area is based on the development and effectiveness of secondary permeabilities in the wake of fracturing and/or weathering. Efforts are usually made to penetrate the full thickness of the aquifer zone, which is then screened over its entire thickness to ensure maximal delivery and much more representative aquifer properties. The data were screened processed to authenticate their validity. Where timedrawdown data were available for some of the wells, recalculation of aquifer properties was performed for comparison with the data retrieved from the archives of the CWSA. In all cases, it was determined that values of aquifer properties reasonably approached the CWSA data. The data were then sorted out based on the lithology.
Optimal multivariate statistical analyses require normal distribution and homoscedasticity of data for the parameters involved. Data for most parameters in the Earth Sciences are usually positively skewed, and therefore do not meet the requirement of normal distribution. In this research, all the parameters were subjected to normality tests through normal probability plots and histograms. None of the parameters met the requirement of normal distribution. They were therefore log-transformed to approximate normal distribution. Ordinary least squares regression analyses were performed on transmissivityspecific capacity data pairs, for all such data from all lithologies, and lithology-specific data. Similar analyses were performed for well yield-aquifer transmissivity.
Maps for the various parameters were developed through kriging, to provide a smooth flow of parameter data variability in the space of the study area. Variograms were developed and fitted with appropriate theoretical models, from which interpolation surfaces were produced. Kriging is one of the most sophisticated of all interpolation methods. The accuracy is however dependent on the appropriateness of the models selected to fit the variogram distribution, data density and accuracy, and the expertise of the modeler.
4. Results and Discussion
The statistical summaries of all the parameters used in the study are presented in the forms of box-and-whisker plots in Figure 3. Extreme variabilities are quite obvious, suggesting that the processes controlling these parameters are many, and vary greatly in the space of the study area. Since optimal results of the models applied required both homoscedasticity and normal distribution, the data for each parameter were log-transformed. For instance well yield ranges between a minimum of 6 l/min and a maximum of 270 l/min; aquifer transmissivity and specific capacity respectively range between 0.115 m2/d and 51.935 m2/d, and 0.205 l/min/m and 45.075 l/min/m. These large variations are significant in terms of the hydrogeology of the entire terrain, and suggest that the hydraulic properties are highly skewed and controlled by discrete entities created in the wake of weathering and/or fracturing of the primary rock.
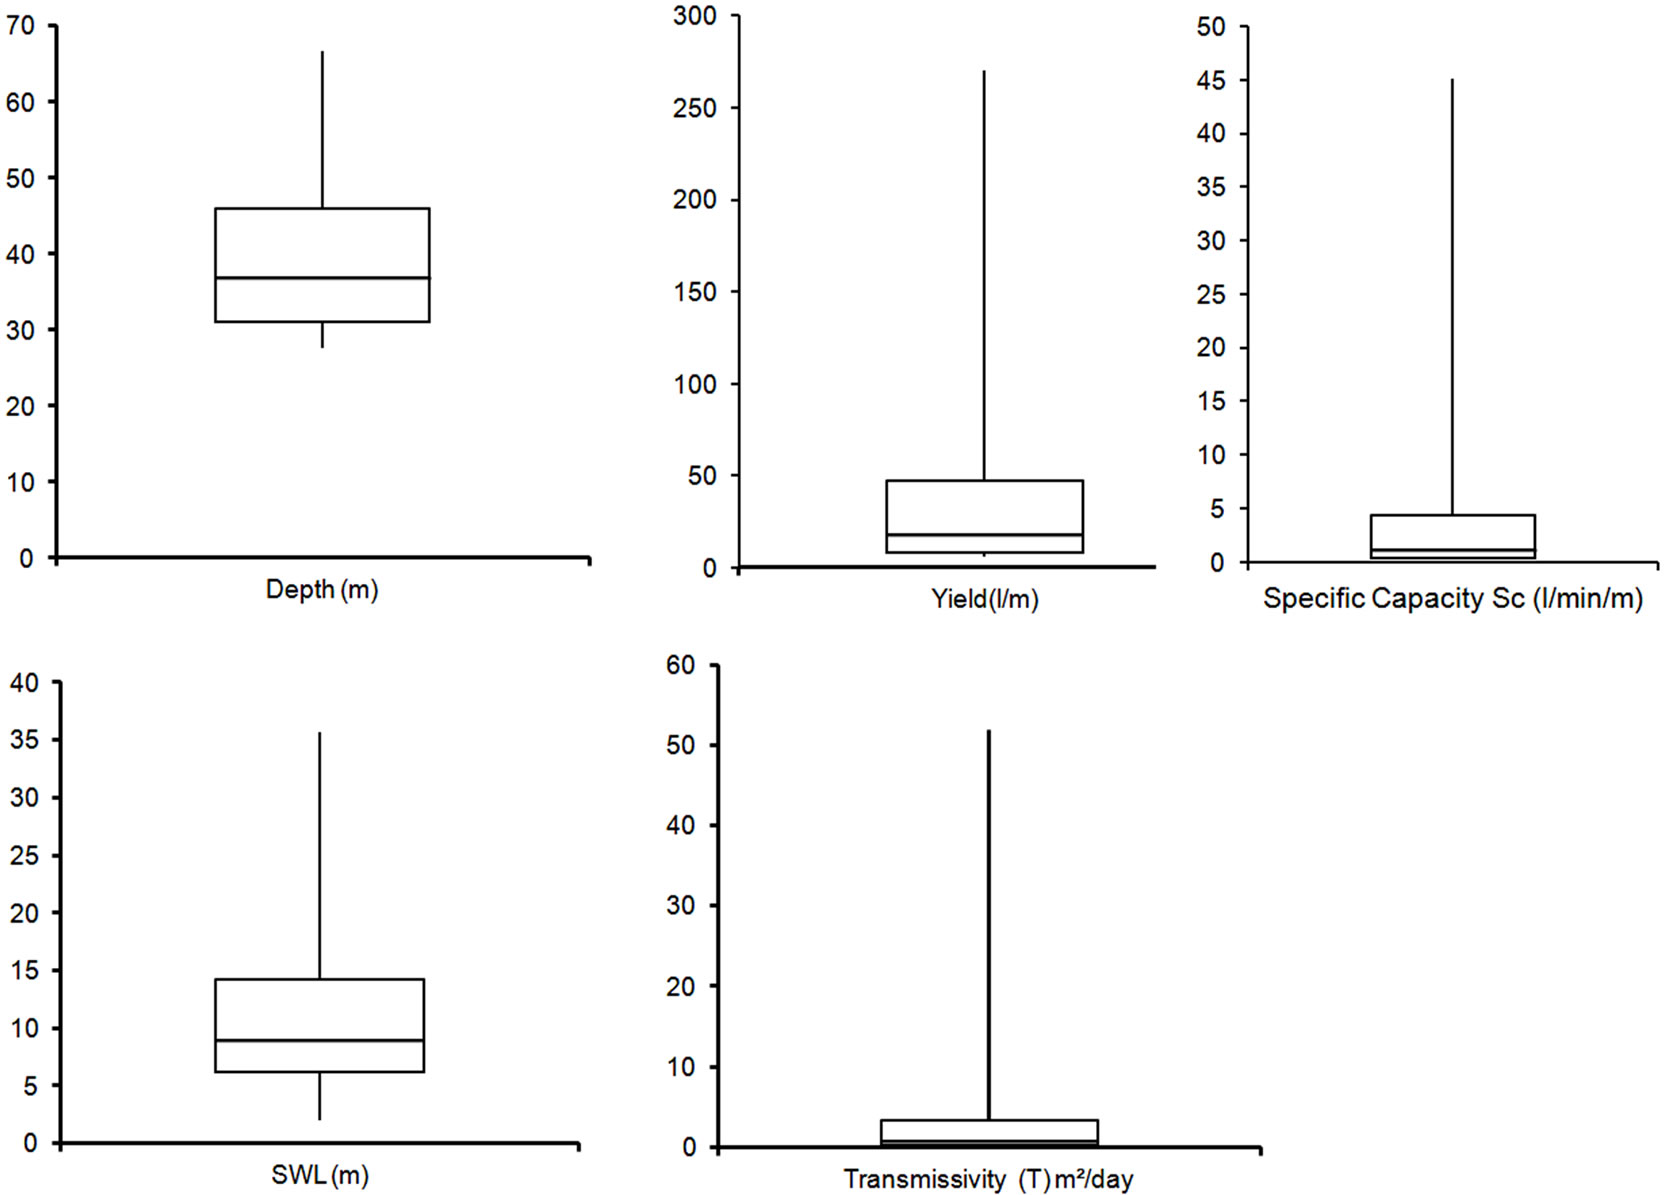
Figure 3. Box-and-Whisker plots for all the parameters used for the study.
4.1. Regression Models
The histograms in Figure 4 suggest that all the parameters are positively skewed and do not meet the requirements of normal distribution in their raw state. Figure 5 illustrates the distributions of the log-transformed parameters. Although none of the parameters assumed perfect normal distribution after the log-transformation, their distributions are much better and closer to normal distribution compared to the raw datasets. The transformed data were therefore used in the next stages of the analyses. Regression analysis between log T (transmissivity) as dependent variable against log Sc (specific capacity) as independent variable indicated a strong relationship. The analysis was performed on the entire dataset from the various rock types. The result is illustrated in Equations (4) and (5).
log T = 1.076 log Sc – 0.124(4)
T = 0.752 Sc1.076(5)
R2 = 0.982 The value of the coefficient of determination suggests that there is a large dependence (over 98%) of aquifer transmissivity on specific capacity. This is a significant improvement over the models of Acheampong and Hess [12] and Yidana et al. [27] among the Voltaian aquifers in the southern part of Ghana. Moreover, Equation (5) is the result of a larger dataset over a much smaller area. The relationship in Equation (5) suggests a non-linear relationship between aquifer transmissivity and specific capacity in the Voltaian Basin, and is in tandem with the findings of Acheampong and Hess [12], Mace [1], and Yidana et al. [27], but at variance with the general form of Equation (1). For a given aquifer the values of specific capacity depend on the well setting, which amongst others include the radius, and degree of penetration of the aquifer. Where the radius is small, drawdown is relatively larger for a given discharge. This leads to lower specific capacity. The distribution of data is not uniform amongst the major lithologies in the study area. Fifty (50) of the wells were completed in sandstone aquifers, 20 were completed in mudstones, whilst the remaining 5 were completed in siltstone aquifers. Lithology-specific regression relationships were developed for the two important aquifer parameters. For the sandstone aquifers in the area, the relationship is presented in Equations (6) and (7).
log T = 1.094 log Sc – 0.123(6)
T = 0.753 Sc1.094(7)
R2 = 0.981

Figure 4. Histograms of the raw data for all the parameters.
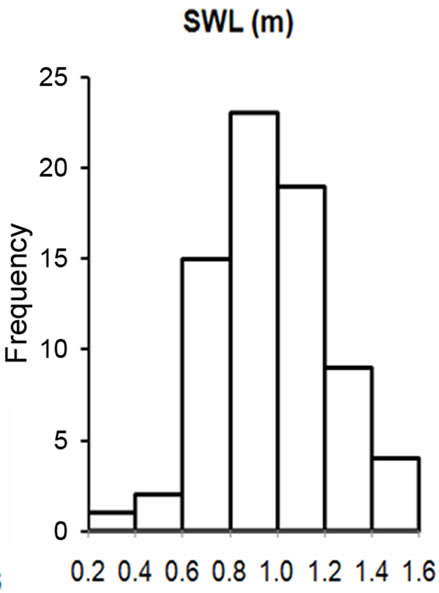
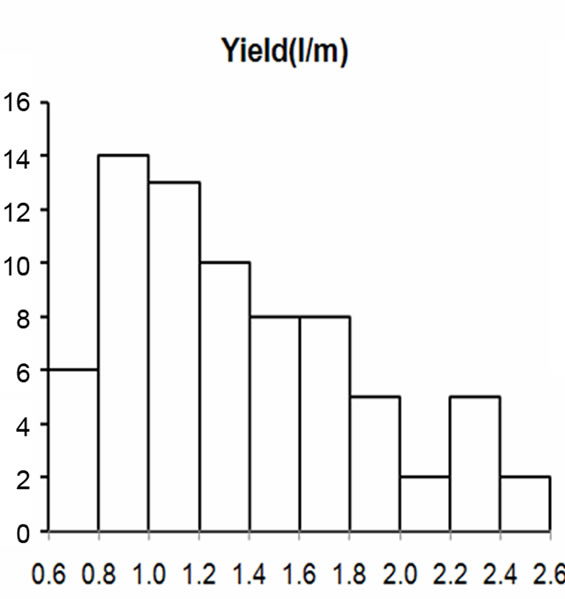
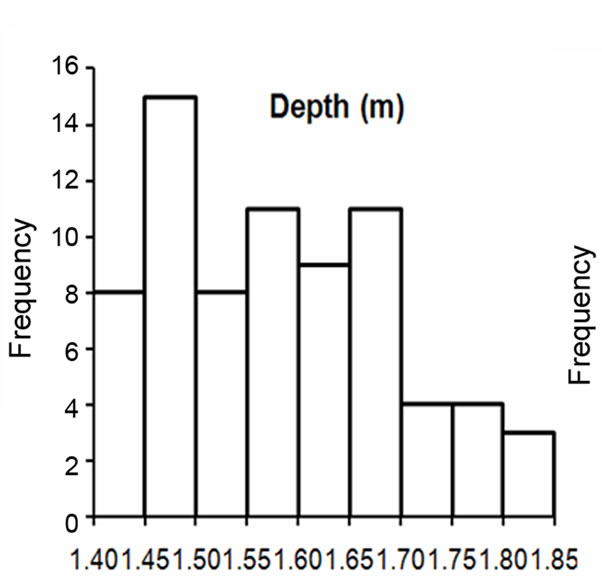
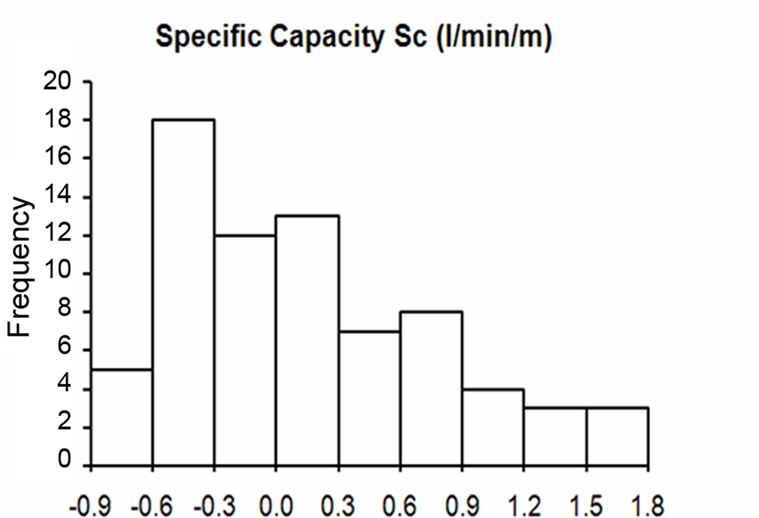

Figure 5. Histograms of the log-transformed data of all the parameters.
The coefficient of determination, R2 is 0.981, suggests a strong relationship between transmissivity and specific capacity data. Equation (7) presents the on-linear regression relationship amongst the sandstone aquifers in the study area. Although the same in essence as Equation (5), the two are slightly different in terms of the exponent on specific capacity, which is likely due to the differences in the lithology. It is however obvious that the exponents are not vastly different, and is indicative of the fact that the wells penetrating the sandstone aquifers are much more abundant, and the Equation (5) portrays the character of the sandstone aquifers much more than those of the other lithologies.
Equations (8) and (9) result from the 20 data pairs from the mudstone aquifers. Although the data is limited compared to the 50 from the sandstone aquifers, the coefficient of regression is obviously higher, suggesting a much more reliable relationship. It is also noticeable that Equation (9) is closer to a linear relationship and approximates Equation (1) better than Equations (5) and (7). Perhaps a larger data would have been required to lead to conclusive analysis of the relationship between transmissivity and specific capacity
log T = 1.037 log Sc – 0.131(8)
T = 0.74 Sc1.037(9)
R2 = 0.985 Only 5 wells were completed in siltstones. The data is too limited to result in any useful relationship for the siltstone aquifers within the Voltaian. Nevertheless, Equations (10) and (11) respectively present the linear log relationship and the non-linear relationship between aquifer transmissivity and specific capacity for the siltstone aquifers from the 5 pairs of data. The exponent in the relationship approximates 1, just as in the case of Equation (9).
log T = 0.996 log Sc – 0.126(10)
T = 0.748 Sc0.996 (11)
R2 = 0.991 The coefficient of specific capacity in the relationships is controlled by factors such as the radius of the well, the radius of influence as well as the level of penetration of the well in the aquifer. In larger diameter wells, the coefficient is expected to be higher. The values obtained in this study range between 0.74 amongst the siltstone aquifers to 0.753 amongst the sandstone aquifers, and compare with the coefficients quoted in Yidana et al. [27] for the Afram Plains portion of the Voltaian. This is at variance with the findings of Acheampong and Hess [12]. The reliability of the relationships obtained from the current research lies in the significantly enhanced datasets and the fact that specific relationships have been obtained for specific lithologies. In addition, the coefficients of regression have been considerable improved in the current study, suggesting a higher degree of confidence in the result. One of the major challenges with hydrogeological investigations in Ghana in general, and the study area in particular is the problem of partial penetration of the pumping wells. All the wells in the study area were drilled out of need. As such, the focus has always been on obtaining enough water for communities, rather than satisfying the requirements for optimal estimates of aquifer parameters. In addition, there are usually no observation wells, and the aquifer properties are obtained by observing drawdowns in the pumping well. This practice has had a bearing on the values of the transmissivities calculated from the pumping test data. Hence, although the regression relationships in this study suggest good causative relationships between transmissivity and specific capacity for the three different lithologies, there is the need to improve upon the representativeness of data on aquifer parameters through the drilling of research wells in all the lithologies mentioned.
The sandstone aquifers are the most variable in terms of transmissivity and specific capacity in the area. They have the highest values and at the same time have the lowest values of both transmissivity and specific capacity among all the rock types in the area.
In addition to aquifer transmissivity distribution in the field, hydrogeologists and groundwater resources managers are often concerned with the distribution of well yields in groundwater resources basins. Therefore, regression relationships were developed between transmissivity, T, and well yield, Y. As these parameters are lognormal, the log-transformed data were used in the regression modeling. The general equations developed for all lithologies in the study area are presented in Equations 12 and 13. The strength of the relationship suggests that well yield can be reliably determined from transmissivity data in the basin. Well yield is a parameter which depends not only on transmissivity but also on the extent of well development, and the construction materials used and the appropriateness of the drilling method. Hence the drilling method used may lead to a significant underestimation of the yield. Inadequate well development and the choice of inappropriate screen for the material of the aquifer zone may also affect the distribution of well yield.
Log Y = 0.642 log T + 1.273(12)
Y = 18.75 T0.642(13)
R2 = 0.868
4.2. Transmissivity and Specific Capacity Maps
Interpolation maps were developed for both aquifer transmissivity and specific capacity, using the 75 data of each of these parameters. Ordinary kriging, the best unbiased linear estimator was the interpolation method used. Several studies have been highlighted in the literature on the application of geostatistical techniques to the understanding the spatial distribution of aquifer parameters. Delhomme [13,14] suggested the use of linear regression and kriging to estimate aquifer transmissivity from specific capacity data. In such cases, the regression relationships were used to estimate values of aquifer transmissivity from specific capacity data. The estimated transmissivity data were then used as original data for the kriging, which then estimates the spatial distribution of the transmissivity field. This procedure transfers errors from the regression relationship to the final kriging model. Thus there are at least two possible sources of error in the final estimates: those associated with the linear regression model, and those associated with the spatial interpolation procedure. It is never possible to obtain a regression model with 100% fit. However, the technique has been used by Binsariti [34], Clifton and Neuman [35], Ahmed and de Marsily [36], and de Marsily and Ahmed [37].
The errors associated with the combined use of linear regression and kriging in the estimation of the transmissivity field made it unattractive for use in this current study. Thus the original aquifer transmissivity data obtained from pumping tests were used in the spatial modeling. Consider Z(x) as an estimate of any random parameter such as aquifer transmissivity or specific capacity at a point x, the estimation is based on the known values of the parameter at surrounding locations and defined by Equation (14).
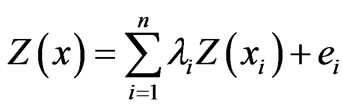 (14)
(14)
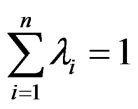 (15)
(15)
where λi is a coefficient which assigns weight to the known value of the parameter at a location, and is dependent on the proximity of the estimated location to the known point; n is the total number points used in the estimation; e is the error associated with the estimation.
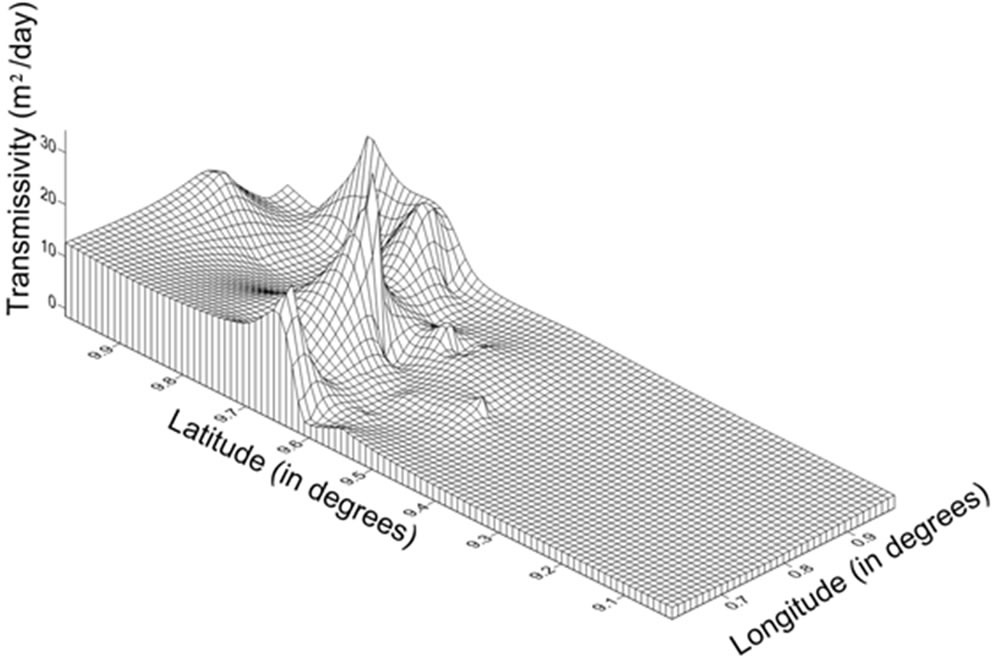
Kriging is one of the most sophisticated interpolation procedures available, and has thus been used extensively in the Earth Sciences. Details of the diverse kinds of kriging and the procedure for each kind are discussed in Isaaks and Srivastava [38] and several other texts on geospatial modeling. In ordinary kriging, a semivariogram is first developed from the raw or transformed dataset, and fitted with the appropriate theoretical model. Kriging then proceeds to estimate the spatial variation in the data of the parameter. There are various programs available for carrying out linear estimates of parameters. In this study, Surfer 9 [39] was used. Figure 6(a) presents the 2-D spatial distribution map for aquifer transmissivity in the study area. The 3-D wireframe from the same dataset is presented in Figure 6(b). In both cases, it is obvious that the highest transmissivity values are associated with the northern parts of the area, where values above 36 m2/day are common. These locations are also associated with the highest well yields in the study area. The highest transmissivity values are associated with the sandstones which are either fractured or weathered, or fractured and weathered in places. The transmissivity prediction map (Figures 6(a) and (b)) suggests low values for the southern parts of the study area. Most of the wells sampled for this study area concentrated in the northern parts, and are therefore able to quite accurately predict the trends at these areas better than the south. The thickness of the weathered zone among the Voltaian aquifers is very variable. This feature is responsible for the observed variability in transmissivity and other aquifer parameters. The entire terrain suffered an episode of low grade metamorphism during the Pan-African tectonic event [29]. This episode and the concomitant pressure and high temperatures obliterated the primary permeability of the rock. Therefore the hydrogeological properties are based on the degree of secondary permeability which varies considerably in the basin. Jalludin and Razack [20] suggested that the effects of weathering and of hydrothermal and volcanic activities decrease transmissivity, whereas effects of tectonics enhance it.
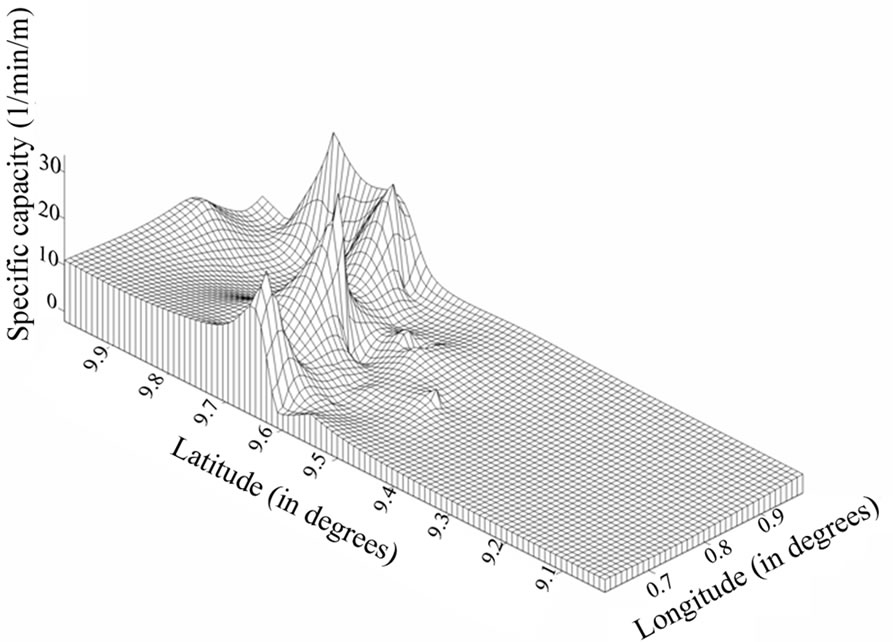
The variations in specific capacity follow the same pattern as observed for transmissivity (Figures 7(a) and (b)) and lends credence to the assertion that the two are causatively related. The causes of variation in aquifer specific capacity are similar to those outlined for transmissivity in the study area. Factors such as partial well penetration, well diameter, and the use of pumping wells as observation wells in the original data on the two aquifer parameters may compromise the accuracy of the estimates. In addition to assisting the general understanding of the hydrogeology of the study area for research purposes, the maps will aid groundwater exploration efforts in the area. In that respect, it is obvious that the northern parts of thearea are the most prolific in terms of groundwater holding and transmission properties. The tendency for
 (a)
(a)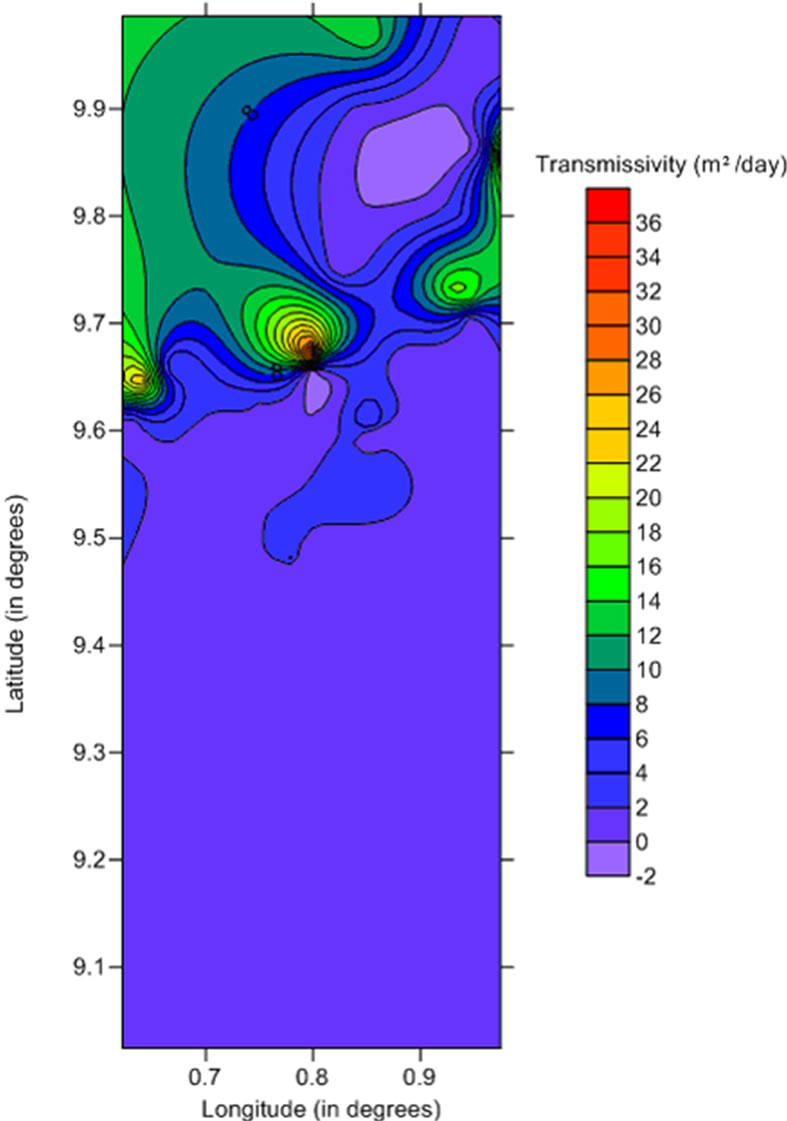 (b)
(b)
Figure 6. (a) A 2-D map of aquifer transmissivity in the study area; (b) a 3-D wireline frame showing the distribution of aquifer transmissivity in the study area.
 (a)
(a)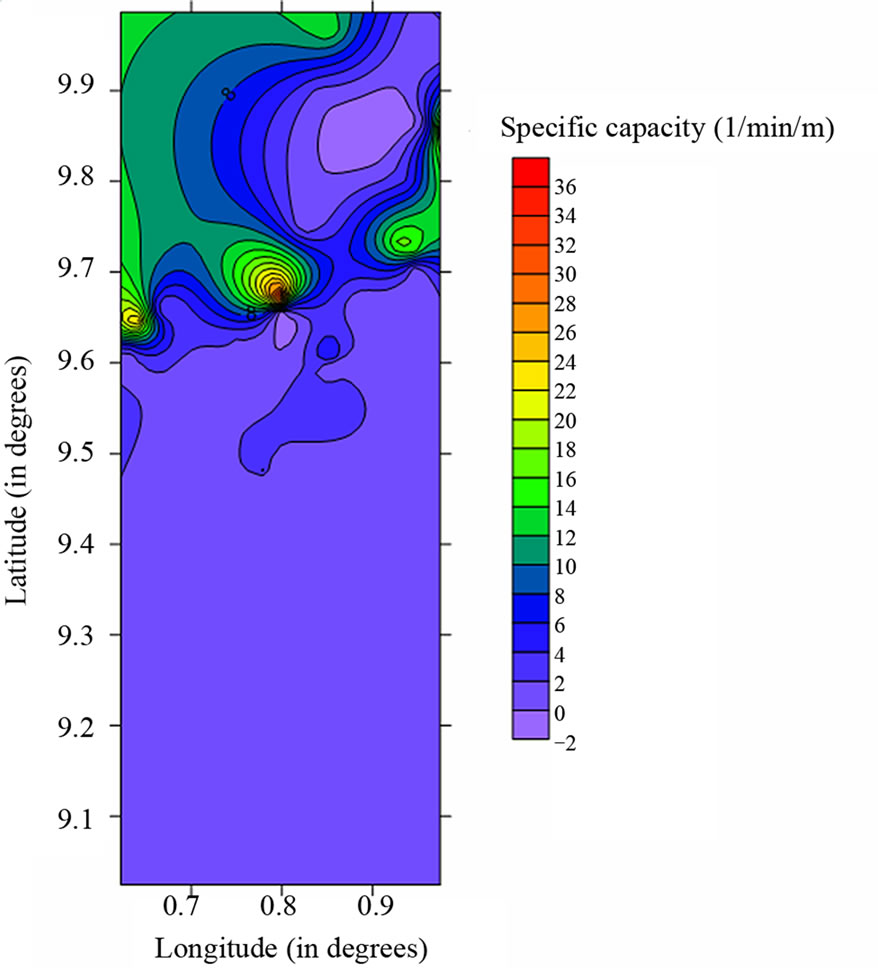 (b)
(b)
Figure 7. (a) 2-D map of the distribution of aquifer specific capacity in the study area; (b) a 3-D wireline frame for specific capacity distribution in the study area.
drilling prolific wells will therefore be higher in the northern parts compared to the south. Specific capacity for the sandstone, mudstone and siltstone aquifers respectively range from 0.211 - 45.075 l/min/m, 0.2 - 25.1 l/min/m and 0.3 - 24.5 l/min/m and that of transmissivity also range from 0.115 - 51.935 m2/day, 0.151 - 16.023 m2/day and 0.218 - 15.857 m2/day within the siltstone, mudstone and siltstone aquifers respectively.
The well yield in the district ranges from 6 to 270 l/min for the sandstone aquifer, 6 - 180 l/min for the mudstone aquifer and 10 to 34.3 l/min for the siltstone aquifer. The standard deviation for sandstone aquifers, mudstone aquifers and siltstone aquifers are respectively 75.1 m, 50.7 m and 12.6 m. The high standard deviation may be due to the high variation in the yield across the district and this is because of the difficulty in finding high yielding wells. The mean was 53.21 l/min for sandstone, 36.8 l/min for mudstone and 21.3 l/min for siltstone.
The variability in the yield in the Voltaian is attributed to the fact that the water bearing structures are discrete entities with highly variable production rates (Acheampong and Hess, [12]). This supports the assumption that groundwater occurrence is mainly controlled by seconddary geologic structures. Potential of groundwater in the district in terms of exploitability is good because the average yield of boreholes for the various rock types fall within the 30 - 80 l/min category as developed by the ICHS, [40]. Figure 8 shows a yield map of the study area. In both the 2-D map and 3-D wireline frame, the trend is similar to that observed for aquifer transmissivity (Figure 6) and specific capacity (Figure 7) in the study area. Besides boreholes in Ying, Wayayo, Sugu Tampia, Yoggu, Zukuga, Silimboma and Asibiliyili areas in the central and northwest parts where the yield exceeded 120 l/min, the yield of most of the boreholes is generally very low (less than 60 l/min) in many parts of the district especially in the southern part. Wells located in sandstones have higher yield compared to those in mudstones and siltstones. Wells in the mudstone aquifers also give moderate yields which are also higher than those from the siltstone aquifer [31,41].
Nii Consult [33] studies on the White Volta also suggested that most of the aquifers have low yield. They explained that most of the borehole data were generated through drilling programs which emphasized only hand pump boreholes for rural communities. Thus boreholes were completed anytime adequate yield to meet rural supply was obtained. Consequently most of the boreholes were only partially penetrating the saturated thickness of the aquifer leading to generally low yielding boreholes. This assertion by Nii Consult [33] can also explain why most of the boreholes in this study have low yield. Since the proper management of groundwater resources in the area is linked to the socioeconomic conditions of the communities in the study area, there is the need for detailed pre-drilling assessment of the hydrogeological situation in the area. In addition, boreholes need to fully penetrate the entire thickness of the aquifer being tapped to enhance yields. The current situation cannot sustain any viable irrigation scheme that makes use of groundwater resources from the aquifers. In the study area, the static water level varies from 2 m to 35.7 m below ground surface, with a mean value of 10.7 m for the sandstone aquifer, 4.65 m to 17.42 m with a mean value of 10.7 m for the mudstone aquifer and siltstone ranged between 6.59 m to 21.85 m and had a mean SWL of 13.1 m.
Figure 9 shows the 3-D wireline frame for static water levels (SWL) in the study area. The map shows that few boreholes in the central and the southern parts of the study area have high static water level. The static water level for most of the boreholes in the study area is very low and this can be seen from the low mean values in all the aquifers. It is obvious that there is no correlation between SWL and yield. The highest yielding wells are not necessarily those with the highest values of SWL.
According to Carrier et al. [42], the main aquifer in
 (a)
(a)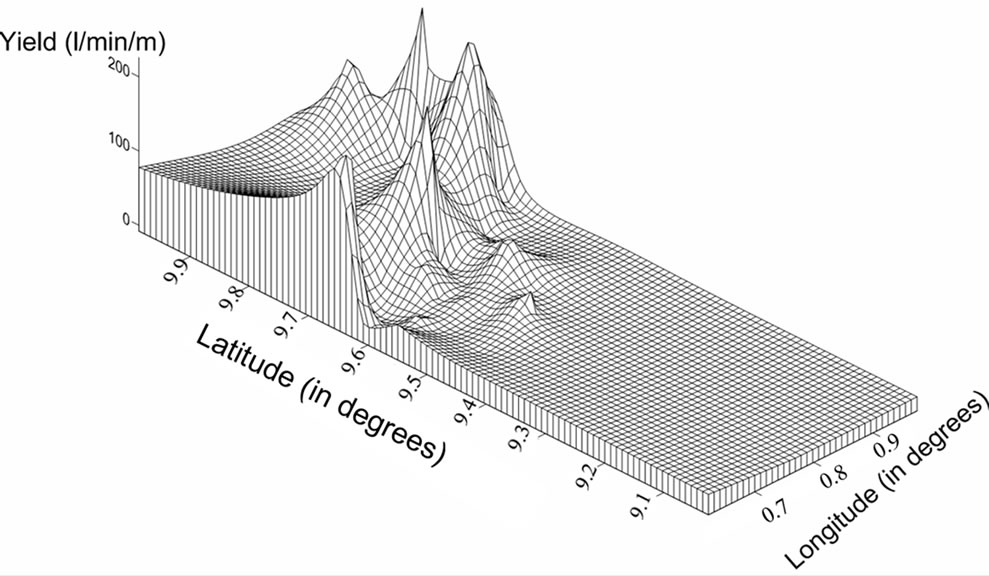 (b)
(b)
Figure 8. (a) 2-D map showing the distribution of well yields in the study area; (b) a 3-D wireline frame for the distribution of well yields in the study area.

Figure 9. A 3-D wireline frame for static water level (measured from the surface) distribution in the study area.
the Voltaian Province of Northern Ghana, is generally located in fractured rock as the regolith is often too thin to store significant amount of water. Ayamsegna and Amoateng [43] also explained that the drop in the static water level of wells in the West Mamprusi district, which is underlain by these aquifer types, is mainly due to intensive usage of the wells by people from far and near communities. In addition, they noted that high temperatures and extended dry seasons are to blame for the early drying up of surface water sources, which could recharge the groundwater system. These assertions could explain the low levels of the static water level in the district.
There is apparently no discernible relationship between yield and depth of boreholes (wells) in the study area, especially within the depth range sampled for this study. However, recent results of drilling projects of the Hydrogeological Assessment Project reveal that borehole as deep as 120 m are capable of yielding high quantities of groundwater for most purposes, although there isn’t significant data to draw concrete conclusions on the relationship. Earlier work done by Carrier et al. [42] under the Hydrogeological Assessment Project (HAP) of the area suggests that important fault zones can be present at great depths which can provide significant amounts of groundwater. This could mean that the deeper boreholes could have higher yields so there is the need for an extensive exploration for further drilling in the area to reach a more logical conclusion.
5. Conclusions
This study has shown that transmissivity exists in a nonlinear relationship with specific capacity in the Savelugu/Nanton District of the Northern Region of Ghana. This is in keeping with results of previous studies on similar aquifers within the same terrain in the southern parts of the country. The current study is based on a larger dataset, and the relationships generated have improved with higher coefficients of regression. On the basis of the data on depth, yield, static water level, transmissivity and specific capacity from wells completed in the aquifers (sandstone, mudstone and siltstone) in the area empirical relationships were determined. The sandstone aquifers are the most variable aquifers in the area in terms of transmissivity and specific capacity. In addition to general regional relationships between aquifer transmissivity and specific capacity, and well yield and transmissivity for the study area, reasonably reliable lithology specific relationships have also been determined from pumping test data. The values of the exponent on the non-linear relationships appear to be dependent on the lithology. It approximates 1 in the case of the mudstone and siltstone aquifers and deviates from unity in the sandstone aquifers. However, a larger scale study is required in order to constrain these findings. The highest yielding wells in the area are completed in sandstone aquifers followed by mudstone with siltstone having the least. Aquifer parameters are highest in the northern parts of the study area, where aquifer properties are enhanced due to high degrees of fracturing and weathering of the rock whose primary permeability has been obliterated in the wake of low grade metamorphism.
6. Acknowledgements
The authors are grateful to the Community Water and Sanitation Agency, CWSA, in the Northern Zone for assistance with the data on the aquifer properties.
REFERENCES
- R. E. Mace, “Estimating Transmissivity Using SpecificCapacity Data,” Bureau of Economic Geology, 2011, in Press.
- S. D. Hovorka, R. E. Mace and E. W. Collins, “Permeability Structure of the Edwards Aquifer, South TexasImplications for Aquifer Management: Bureau of Economic Geology,” The University of Texas at Austin, Report of Investigations No. 250, 1998, p. 55.
- H. J. Thomasson, F. H. Olmstead and E. R. LeRoux, “Geology, Water Resources, and Usable Ground Water Storage Capacity of Part of Solano County, CA,” US Geological Survey Water Supply Paper 1464, 1960, p. 693.
- C. V. Theis, “Estimating the Transmissivity of a WaterTable Aquifer from the Specific Capacity of a well,” U.S. Geological Survey Water Supply Paper 1536-I, 1963, pp. 332-336.
- H. B. Eagon and D. E. Johe, “Practical Solutions for Pumping Tests Incarbonate-Rock Aquifers,” Ground Water, Vol. 10, No. 4, 1972, pp. 6-13. doi:10.1111/j.1745-6584.1972.tb02929.x
- M. Razack and D. Huntley, “Assessing Transmissivity from Specific Capacity in a Large and Heterogeneous Alluvial Aquifer,” Ground Water, Vol. 29, No. 6, 1991, pp. 856- 861. doi:10.1111/j.1745-6584.1991.tb00572.x
- D. Huntley, R. Nommensen and D. Steffey, “The Use of Specific Capacity to Assess Transmissivity in FracturedRock Aquifers,” Ground Water, Vol. 30, No. 3, 1992, pp. 396-402. doi:10.1111/j.1745-6584.1992.tb02008.x
- R. A. Freeze and J. A. Cherry, “Groundwater,” PrenticeHall, Englewood Cliffs, 1979.
- A. El-Naqa, “Estimation of Transmissivity from Specific Capacity Data in Fractured Carbonate Rock Aquifer, Central Jordan,” Environmental Geology, Vol. 23, No. 1, 1994, pp. 73-80. doi:10.1007/BF00773142
- P. Fabbri, “Transmissivity in the Geothermal Euganean Basin; A Geostatistical Analysis,” Ground Water, Vol. 35, No. 5, 1997, pp. 881-887. doi:10.1111/j.1745-6584.1997.tb00156.x
- R. E. Mace, “Determination of Transmissivity from Specific Capacity Tests in a Karst Aquifer,” Ground Water, Vol. 35 No. 5, 1997, pp. 738-742. doi:10.1111/j.1745-6584.1997.tb00141.x
- S. Y. Acheampong and J. W. Hess, “Hydrogeologic and Hydrochemical Framework of the Shallow Groundwater System in the Southern Voltaian Sedimentary Basin, Ghana,” Hydrogeology, Vol. 6, No. 4, 1998, pp. 527-537. doi:10.1007/s100400050173
- J. P. Delhomme, “Kriging in Hydrosciences,” Advances in Water Resources, Vol. 1, No. 5, 1978, pp. 251-266.
- J. P. Delhomme, “Application de la Théorie des Variables Régionalisées Dans les Sciences de l’eau,” Ph.D. Thesis, Ecole des Mines de Paris, Fontainebleau, 1976.
- M. Aboufirassi and M. A. Marino, “Cokriging of Aquifer Transmissivities from Field Measurements of Transmissivity and Specific Capacity,” Journal of the International Association for Mathematical Geology, Vol. 16, No. 1, 1984, pp.19-35. doi:10.1007/BF01036238
- J. F. Muńoz-Pardo and R. Garcia, “Estimation of the Transmissivity of the Santiago Aquifer, Chile, Using Different Geostatistical Methods,” Groundwater Management: Quantity and Quality (Proceedings of the Benidorm Symposium), IAHS Publication No. 188, October 1989.
- H. Lance, D. Huntley and M. Razack, “Cokriging Limited Transmissivity Data Using Widely Sampled Specific Capacity from Pump Tests in an Alluvial Aquifer,” Groundwater, Vol. 34, No. 1, 1996, pp.12-18. doi:10.1111/j.1745-6584.1996.tb01859.x
- R. E. Mace, R. C. Smyth, L. Xu and J. Jiang, “Transmissivity, Hydraulic Conductivity, and Storativity of the Carrizo-Wilcox Aquifer in Texas,” Bureau of Economic Geology, Austin, 1999.
- G. P. Kruseman and N. A. de Ridder, “Analysis and Evaluation of Pumping Test Data,” 2nd Edition, International Institute for Land Reclamation and Improvement, Wageningen, 1990, p. 377.
- M. Jalludin and M. Razack, “Assessment of hydraulic Properties of Sedimentary and Volcanic Aquifer Systems under Arid Conditions in the Republic of Djibouti (Horn of Africa),” Hydrogeology, Vol. 12, No. 2, 2004, pp. 159- 170. doi:10.1007/s10040-003-0312-2
- T. Verbovśek, “Estimation of Transmissivity and Hydraulic Conductivity from Specific Capacity and Specific Capacity Index in Dolomite Aquifers,” Journal of Hydrologic Engineering, Vol. 13, No. 9, 2008, pp. 817-823.
- A. I. Johnson, R. P. Moston and S. F. Versaw, “Laboratory Study of Aquifer Properties and Well Design for an Artificial Recharge Site,” US Geological Survey Water Supply Paper, No. 1615-H, 1966, pp. H23-H25.
- P. G. Adyalkar and V. V. S. Mani, “An Attempt at Estimating the Transmissibilities of Trappean Aquifers from Specific Capacity Values,” Journal of Hydrology, Vol. 17, No. 3, 1972, pp. 237-241. doi:10.1016/0022-1694(72)90007-8
- P. G. Adyalkar, J. P. Dias and R. S. Srihari, “Empirical Methods for Evaluating Hydraulic Properties of Basaltic Water Table Aquifers with Specific Capacity Values,” Indian Journal of Earth Sciences, Vol. 8, No. 1, 1981, pp. 69-75.
- A. R. H. Swan and M. Sandilands, “Introduction to geological Data Analysis,” Blackwell Science, London, 1995.
- S. Y. Hamm, J. Y. Cheong, S. Jang, C. Y. Jung and B. S. Kim, “Relationship between Transmissivity and Specific Capacity in the Volcanic Aquifers of Jeju Island, Korea,” Journal of Hydrology, Vol. 310, No. 1-4, 2005, pp. 111- 121. doi:10.1016/j.jhydrol.2004.12.006
- S. M. Yidana, D. Ophori and B. Banoeng-Yakubo, “Hydrogeological and Hydrochemical Characterization of the Voltaian Basin: The Afram Plains Area, Ghana,” Environmental Geology, Vol. 53, No. 6, 2008, pp. 1213-1223. doi:10.1007/s00254-007-0710-1
- K. B. Dickson and G. Benneh, “A New Geography of Ghana,” Metricated Edition, Longman, London, 2004.
- G. O. Kesse, “The Mineral and Rock Resources of Ghana,” A. A. Balkema, Rotterdam, 1985.
- H. E. Gill, “A Groundwater Reconnaissance of the Republic of Ghana, with a Description of Geohydrologic Provinces,” Geological Survey Water-Supply Paper 1757-K, Washington DC, 1969.
- S. Dapaah-Siakwan and P. Gyau-Boakye, “Hydrogeologic Framework and Borehole Yields in Ghana,” Hydrogeology, Vol. 8, No. 4, 2000, pp. 405-416. doi:10.1007/PL00010976
- S. Y. Acheampong, “Geochemical Evolution of the Shallow Groundwater System in the Southern Voltaian Sedimentary Basin of Ghana,” Ph.D. Thesis, University of Nevada, Reno, 1996.
- Nii Consult, “Information Building Block. Ghana Water Management Study,” Unpublished Consultancy Report for the Ministry of Works and Housing, Ghana/Danida/ WorldBank, 1998.
- A. A. Binsariti, “Statistical Analysis and Stochastic Modeling of the Cortaroaquifer in Southern Arizona,” Ph.D. Thesis, University of Arizona, Tucson, 1980.
- P. M. Clifton and S. P. Neuman, “Effects of Kriging and Inverse Modeling on Conditional Simulation of the Avra Valley Aquifer in Southern Arizona,” Water Resources Research, Vol. 18, No. 4, 1982, pp. 1215-1234. doi:10.1029/WR018i004p01215
- S. Ahmed and G. De Marsily, “Comparison of Geostatistical Methods for Estimating Transmissivity Using Data on Transmissivity and Specific Capacity,” Water Resources Research, Vol. 23, No. 9, 1987, pp. 1717-1737. doi:10.1029/WR023i009p01717
- G. de Marsily and Sh. Ahmed, “Application of Kriging Techniques in Groundwater Hydrology,” Journal of the Geological Society of India, Vol. 29, No. 1, 1987, pp. 57-82.
- E. H. Isaaks and R. H. Srivastava, “Applied Geostatistics,” Oxford University Press, Oxford, 1989.
- Golden Software Inc., “Surfer Version 9: Surface Mapping System,” Golden Software Inc., Colorado, 2011.
- Inter-African Committee for Hydraulic Studies (ICHS), “Explanatory Notice and Recommended Usage of the Map of Potential Groundwater Resources in Western and Central Africa 1:5,000,000,” Orléans, ICHS, BRGM, 1986.
- A. M. MacDonald and J. Davies, “A Brief Review of Groundwater for Rural Water Supply in Sub-Saharan Africa British Geological Survey,” Technical Report WC/00/33, 2000.
- M. A. Carrier, R. Lefebvre, J. Racicot and E. B. Asare, “Northern Ghana Hydrogeological Assessment Project,” 33rd WEDC International Conference, Accra, 2008.
- J. A. Ayamsegna and P. Amoateng-Mensah “Well Monitoring: World Vision’s Experience in Ghana,” Sustainable Environmental Sanitation and Water Services: 28th WEDC Conference, Kolkata (Calcutta), 2002. (Cited 24 July 2009) http://www.ghanadistricts.com