Journal of Water Resource and Protection
Vol. 3 No. 10 (2011) , Article ID: 8132 , 11 pages DOI:10.4236/jwarp.2011.310082
Particle Association of Enterococcus and Total Bacteria in the Lower Hudson River Estuary, USA
1Lamont Doherty Earth Observatory of Columbia University, Palisades, USA
2School of Marine and Atmospheric Sciences, Stony Brook University, Stony Brook, USA
3School of Earth and Environmental Sciences, Queens College, City University of New York, Flushing, USA
E-mail: *andyjuhl@ldeo.columbia.edu
Received August 6, 2011; revised September 7, 2011; accepted October 7, 2011
Keywords: Attachment, Fecal Indicator Bacteria, Sedimentation, Sinking Rate, Sewage
ABSTRACT
Bacterial particle association has important consequences for water-quality monitoring and modeling. Particle association can change vertical and horizontal transport of bacterial cells, as well as patterns of persistence and production. In this study, the abundance and particle association of total bacteria and the fecal-indicator, Enterococcus, were quantified between June and October 2008 in the lower Hudson River Estuary (HRE). Twelve sites were sampled, including mid-channel, near shore, and tributary habitats, plus a sewage outfall. Total bacterial cell counts averaged 9.2 × 10⁹ ± 6.4 × 10⁹ cell·l–1 (1 standard deviation), comparable to previous sampling in the HRE. Unlike earlier studies, bacterial abundance did not change consistently along the north/south estuarine salinity gradient. Enterococcus concentrations were highly variable, but mid-channel stations had significantly lower values than other habitat categories. Counts of total bacteria and Enterococci were both correlated with turbidity, which was also significantly lower at mid-channel stations. A larger fraction of Enterococci were associated with particles (52.9% ± 20.9%, 1 standard deviation) than in the pool of total bacteria (23.8% ± 15.0%). This high frequency of particle association, relative to total bacteria, could cause Enterococci to be preferentially retained near input sources because of enhanced deposition to bottom sediments, where they would be available for later resuspension. In turn, retention and resuspension in nearshore environments may explain the observed cross-channel variability of turbidity and Enterococci. Assessments and predictive models of estuarine water quality may be improved by incorporating cross-channel variability and the effects of particle association on key indicators.
1. Introduction
Association with particles can be a key aspect of the ecology of aquatic bacteria, including both naturallypresent cells, and allochthonously-introduced pathogens [1]. Solute concentrations in the vicinity of particles can be dramatically higher than in the surrounding water, providing a habitat for bacterial physiologies that would not be supported in the bulk phase [2,3]. As a consequence, the bacterial species composition and physiological diversity associated with particles can diverge markedly from the free-living community [4,5]. Particle-associated bacteria can have higher production rates [6,7] and different susceptibility to predation than freeliving cells [8,9]. For these reasons, particles can be viewed as islands of favorable microbial habitat suspended within the less favorable water phase [1].
Particle association is also relevant to the management of bacterial contamination of ambient water by sewage. For example, particle-associated bacteria may be shielded from disinfection by UV light and chemicals [9]. Another consideration is that bacteria associated with particles are likely to sink faster than free-living cells [10,11]. In shallow water columns, rapid settling should lead to shorter horizontal transport and deposition to the sediments. Fecal-indicator bacteria (FIB) have been found in high numbers in the sediments of many systems. FIBs and other exogenous bacteria, including pathogens, may persist longer in sediment reservoirs, or even grow [12, 13] and can cause water-column contamination after resuspension events [14,15]. Thus, estimating particle association of FIB is important for modeling sewage contamination and transport. Most sewage contamination models currently only account for free-living bacteria, which have negligible settling velocities and gain none of the protective advantages of particle-association [16, 17]. Recent models have begun to consider particle association and resuspension as critical, though poorly constrained factors [18,19].
Although high particle loading and turbidity are recognized as defining characteristics of the Hudson River Estuary (HRE), bacterial particle association has not been previously studied within this system. The HRE runs through one of the most densely-populated and heavilyurbanized areas in the United States, including the New York City metropolitan area. Although the HRE has a long history of environmental degradation, many waterquality indicators have been improving for several decades [20]. Such improvements are best documented for the interconnected waterways around Manhattan Island and the New York City Harbor [21], although those data have only been reported after considerable temporal (seasonal) and spatial averaging. Systematic water-quality data are rare for much of the HRE north of New York City.
The goal of this study was to determine the fraction of total bacteria and of Enterococci attached to particles in the lower HRE at stations representing a variety of habitats and to examine whether the concentrations and particle-attachment of these organisms differed between habitats or correlated with easily-measured hydrographic parameters. The results have implications for understanding microbial processes in the lower HRE, as well as for monitoring, predicting, and managing microbial water quality in this important estuary.
2. Material and Methods
2.1. Study Sites and Sample Collection
The data described in this study are part of a larger, ongoing water-quality testing program on the HRE (study description and additional data available at http://www. riverkeeper.org). This study is based on the subset of stations from the larger program that included measurements of total bacterial concentration and/or estimates of particle-associated bacteria and particle-associated Enterococci. The fecal-indicator organism, Enterococcus is widely used for indicating sewage contamination in marine and freshwaters because it is easily detected, abundant in sewage, and rarely present in uncontaminated water [22]. Water samples for this study were collected at 12 sites along the lower HRE and its tributaries (Figure 1) between June and October 2008. Samples at 9 of the 12 sites were collected during monthly water quality surveys conducted aboard the Riverkeeper survey vessel, R. Ian Fletcher. Three additional sites, (24W, SC1, and 26.1) were sampled from shore (Table 1).
For the 9 stations sampled from the survey vessel, temperature, salinity, in vivo chlorophyll fluorescence, turbidity, and % oxygen saturation (at approximately 25 cm depth) were measured using a Hydrolab DS-5 Datasonde. Sensors were calibrated before each survey using the manufacturer’s recommended protocols. In vivo chlorophyll fluorescence (measured as relative fluorescence units) was converted to chlorophyll-a equivalents (µg·l–1) using a regression between the fluorescence signal and extracted chlorophyll-a [23] measured in water samples collected from a subset of the stations (r = 0.93, n = 28). For the shore stations (24W, SC1, and 26.1) sampled before 7/25/08, only temperature and salinity were measured using a handheld YSI 30 salinity/ temperature meter. After 7/25/08, the Hydrolab DS-5 data sonde was available for use during shore sampling, so that the full suite of variables measured at other stations could be measured.
2.2. Bacterial Abundance
500-ml water samples were collected by hand using clean polycarbonate containers that were triple-rinsed with river water from the station before collecting the sample. After gentle mixing, a 1-ml subsample was preserved with glutaraldehyde (1% final concentration). This “whole-water” sample was used to determine total bacteria. Then, following Crump et al. [6], a 15- to 105-ml water subsample was gravity filtered through a 47-mm diameter, 3.0-µm pore size, polycarbonate membrane filter (Millipore Isopore TSTP). A 1-ml subsample of the “filtered” water was preserved as above to determine the count of non-particle-associated bacteria. The particleassociated bacterial fraction was then calculated by subtraction.
Preserved whole and filtered water samples were processed in the same way for microscopic counts. The first step was to release any potentially-attached bacteria from particles, which could otherwise lead to undercounting. We tested several published protocols based on: incubation in an ultra-sonic bath [24], Triton-X 100 (detergent) plus sonication [6], and methanol plus sonication [25]. However, none of these methods caused any significant release of bacteria from particles (i.e., no significant change in bacterial count vs. untreated samples, data not shown). We obtained more complete release of
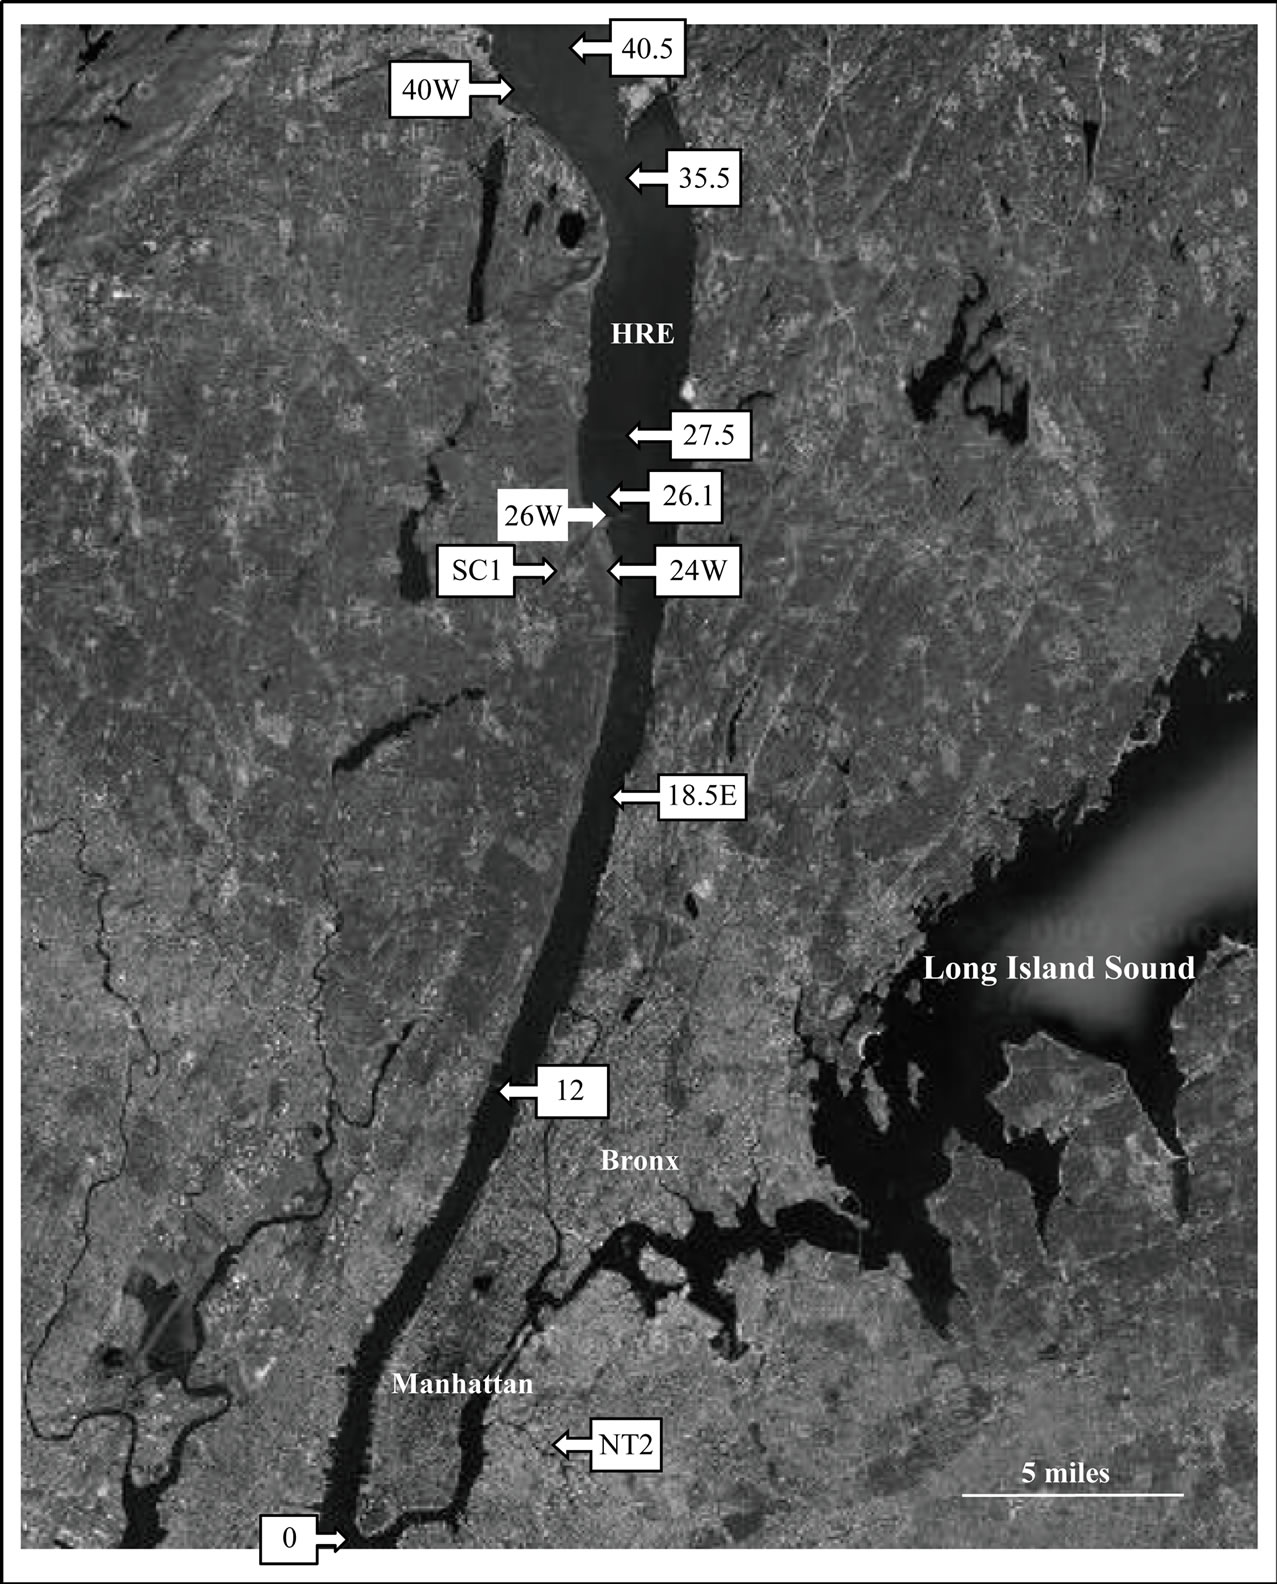
Figure 1. Map of sampling stations in the Hudson River Estuary system. Station numbers are river miles, starting from the southern tip of the estuary. Tributary stations are indicated with letters.
bacteria from particles with the following procedure, used for both filtered and whole water. Tween-80 (0.1% final concentration, [26] and EDTA (10 mM final concentration, [25]) were added to preserved samples. The samples soaked for at least 2 hours and were then vortexed at the highest speed of a Vortex-Genie 2 (Scientific Industries). Samples were vortexed at least 6 min. because the increase in bacterial cell count (relative to untreated samples) appeared to asymtote after this point (Figure 2). After vortexing, bacterial samples were stained according to a method adapted from Noble and Fuhrman [27]. Samples were gently filtered onto 25-mm diameter, 0.2-µm pore, black Nuclepore polycarbonate membrane filters and then washed with 0.5 ml of phosphate-buffered saline solution (PBS, 0.05 M NA2HPO4, 0.85% NaCl, with 0.01M ascorbic acid added to reduce stain fading). The nucleic acid stain, SYBR Green 1 (Sigma), was diluted 1:10 of the supplied concentration with the PBS buffer. A 10-µl drop of the stain solution was placed in the center of each filter and then immediately mixed and further diluted by adding an additional 200 µl of PBS. The sample was allowed to stain for 15 minutes before vacuuming the solution through the filter. Filters were then mounted directly on a glass slide (i.e., without mounting medium). A 10-µl drop of 50% glycerol/50% PBS was added to the center of the filter, which was then covered with a glass cover slip. Slides were stored frozen for no longer than 1 month and then counted on a Leitz Laborlux 11 epifluorescence microscope with blue-light excitation at 1000× magnification.
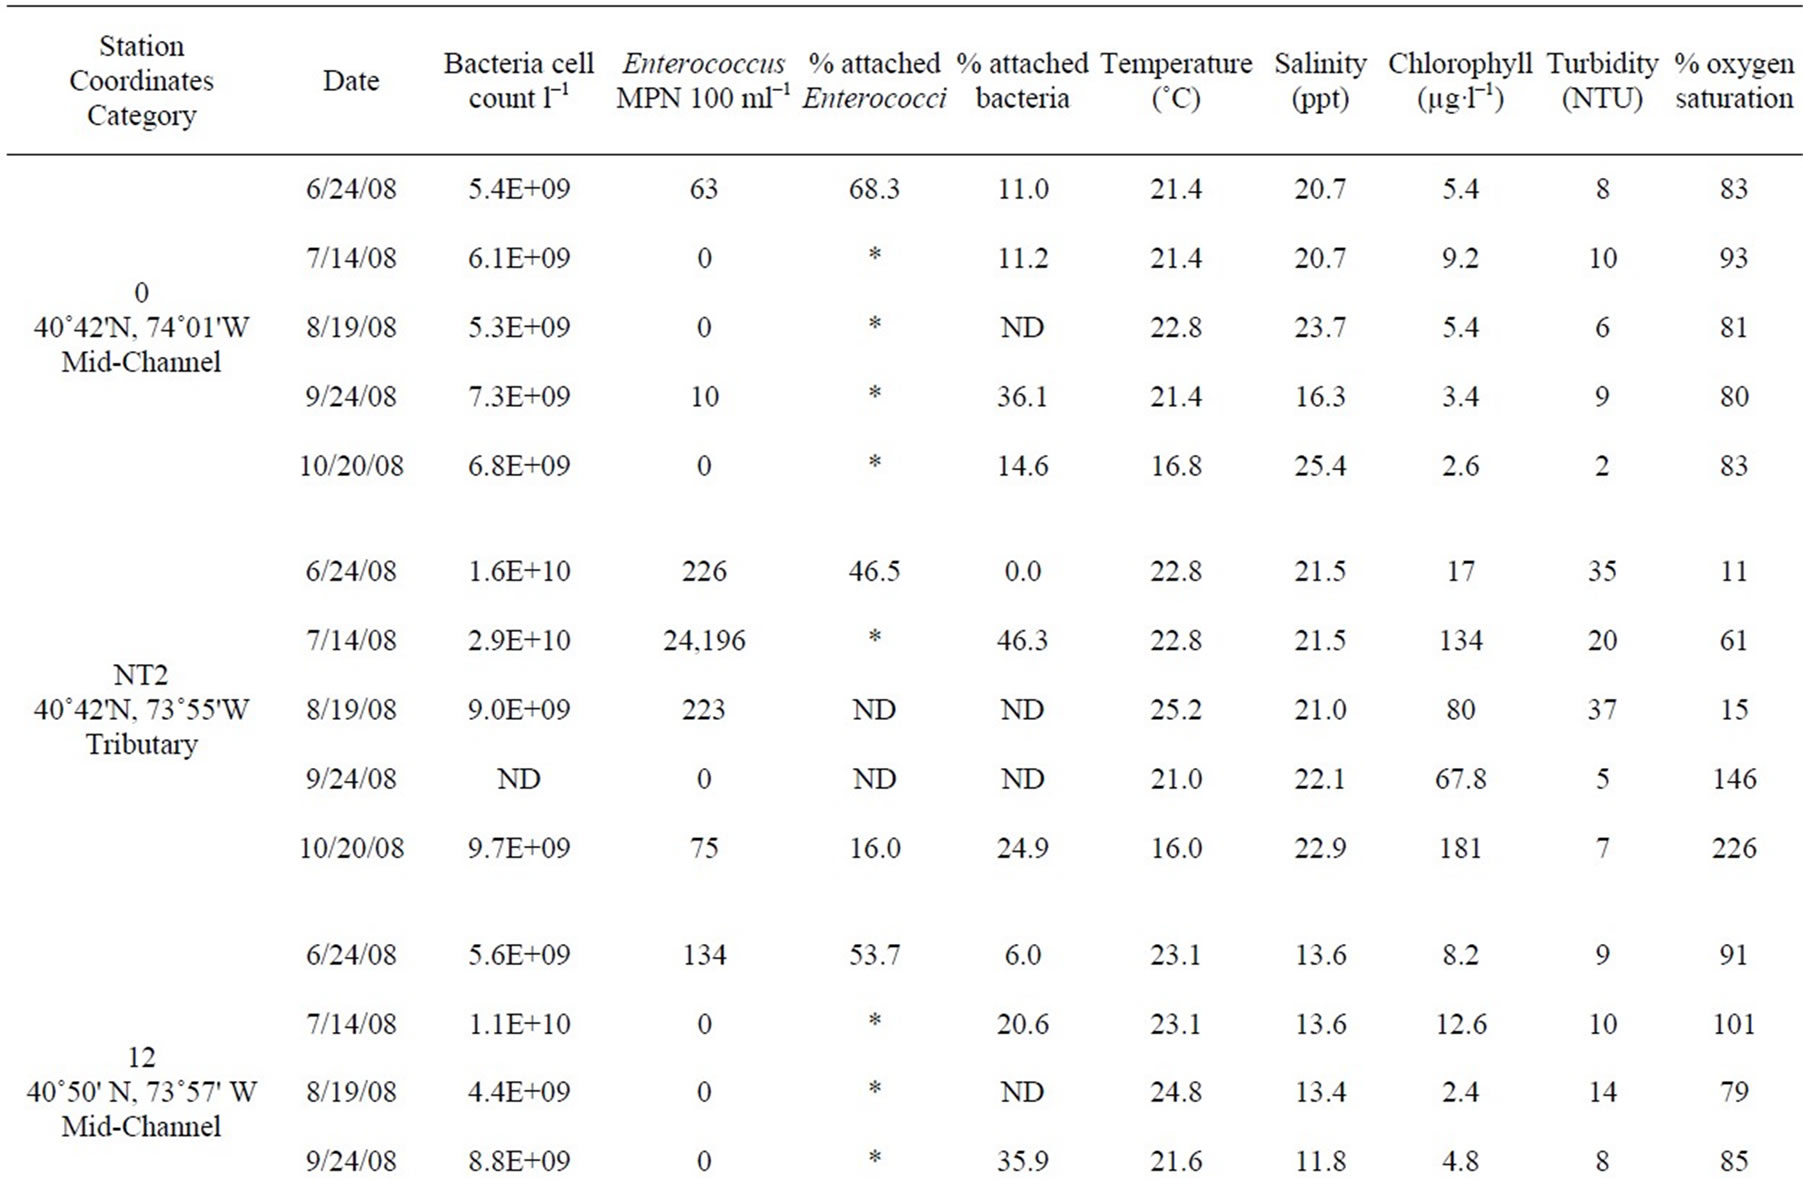
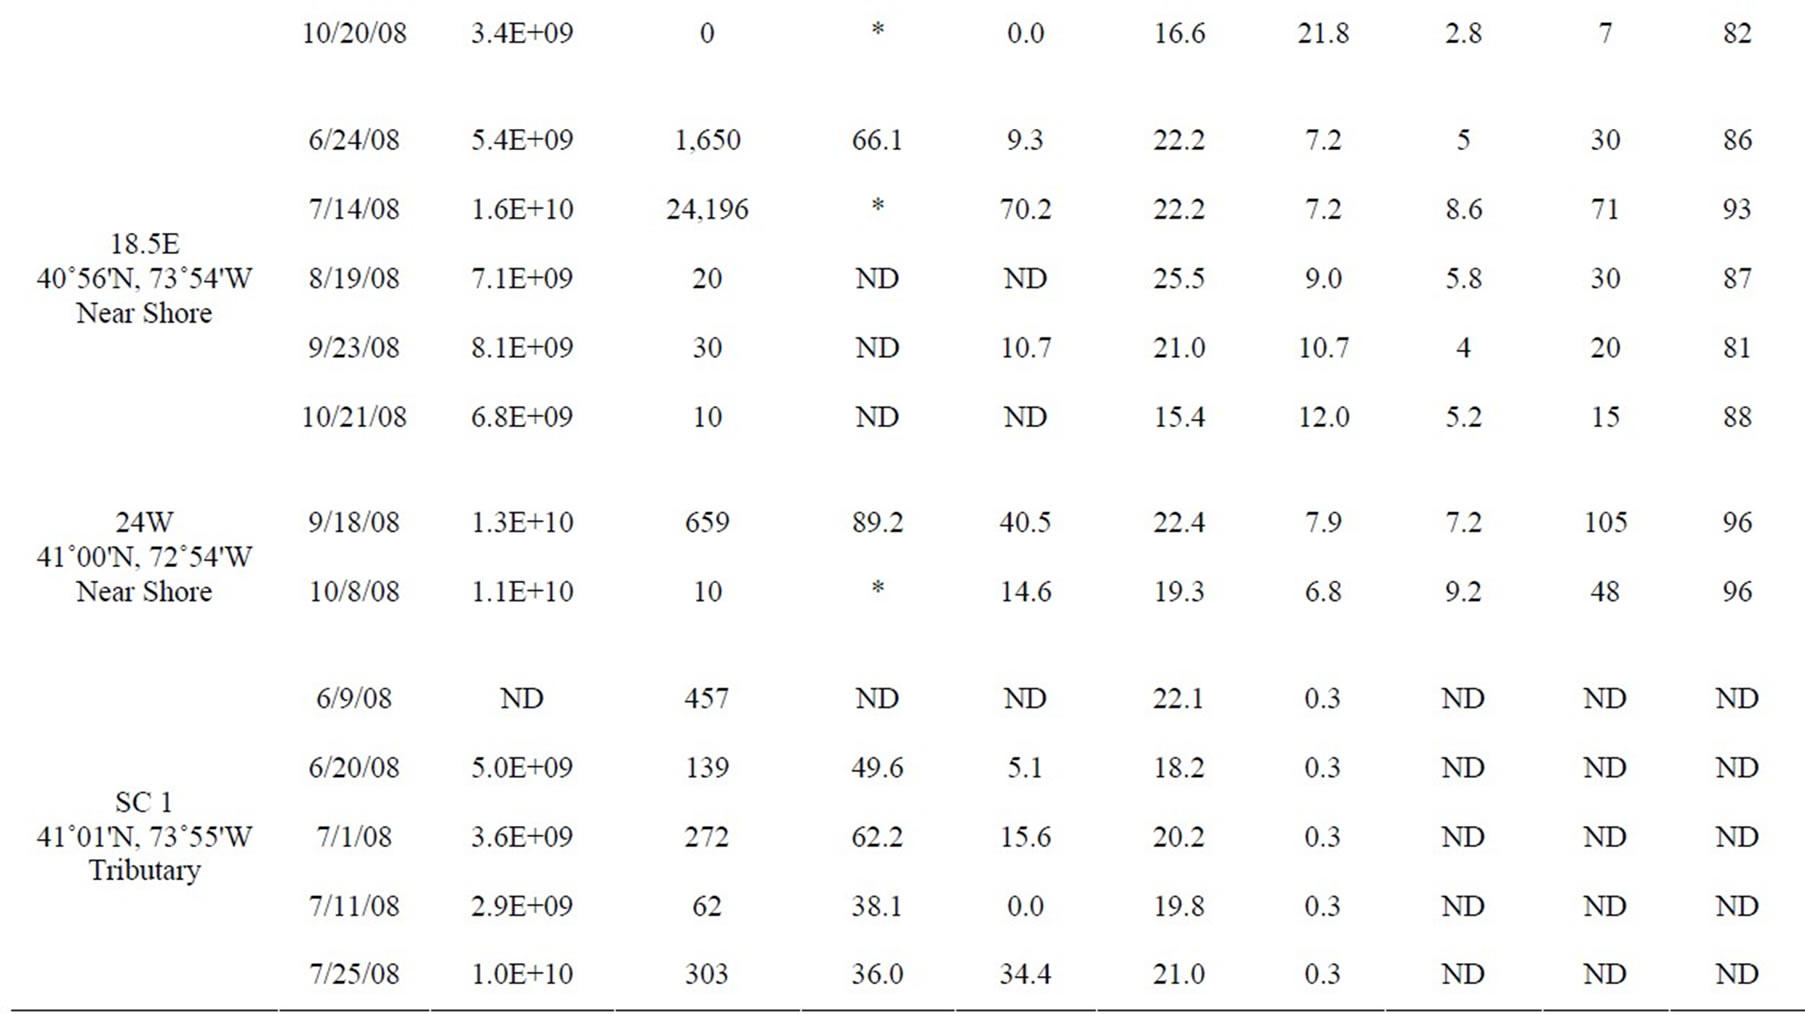
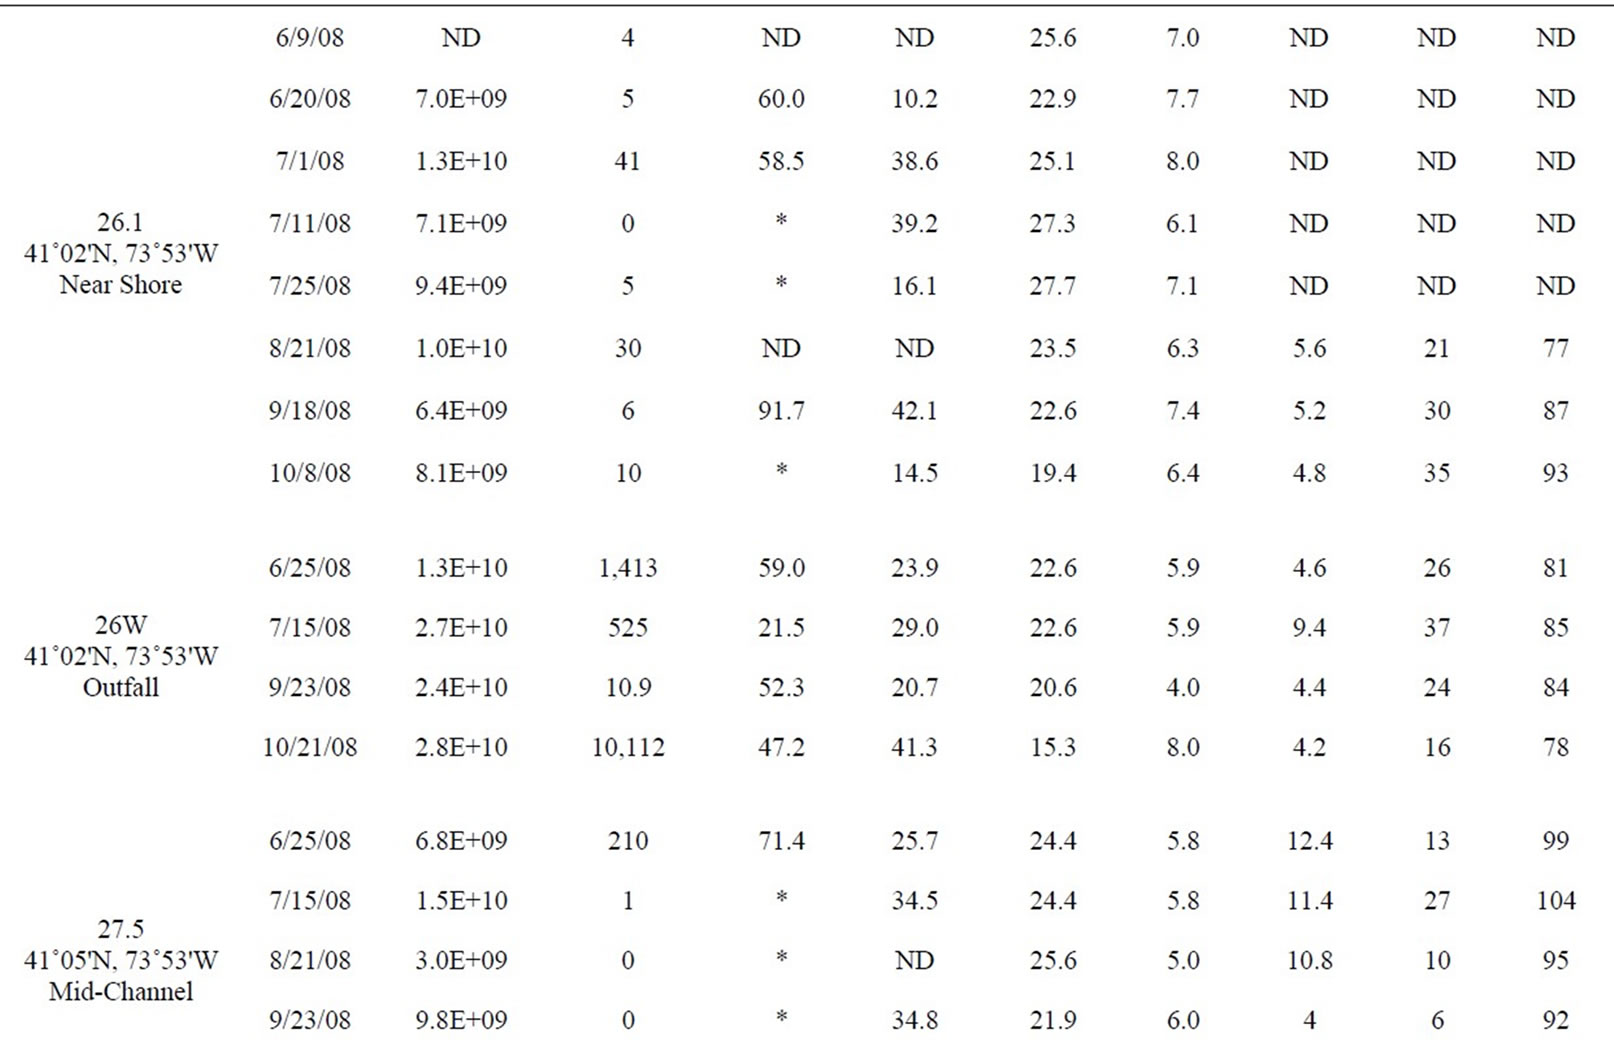
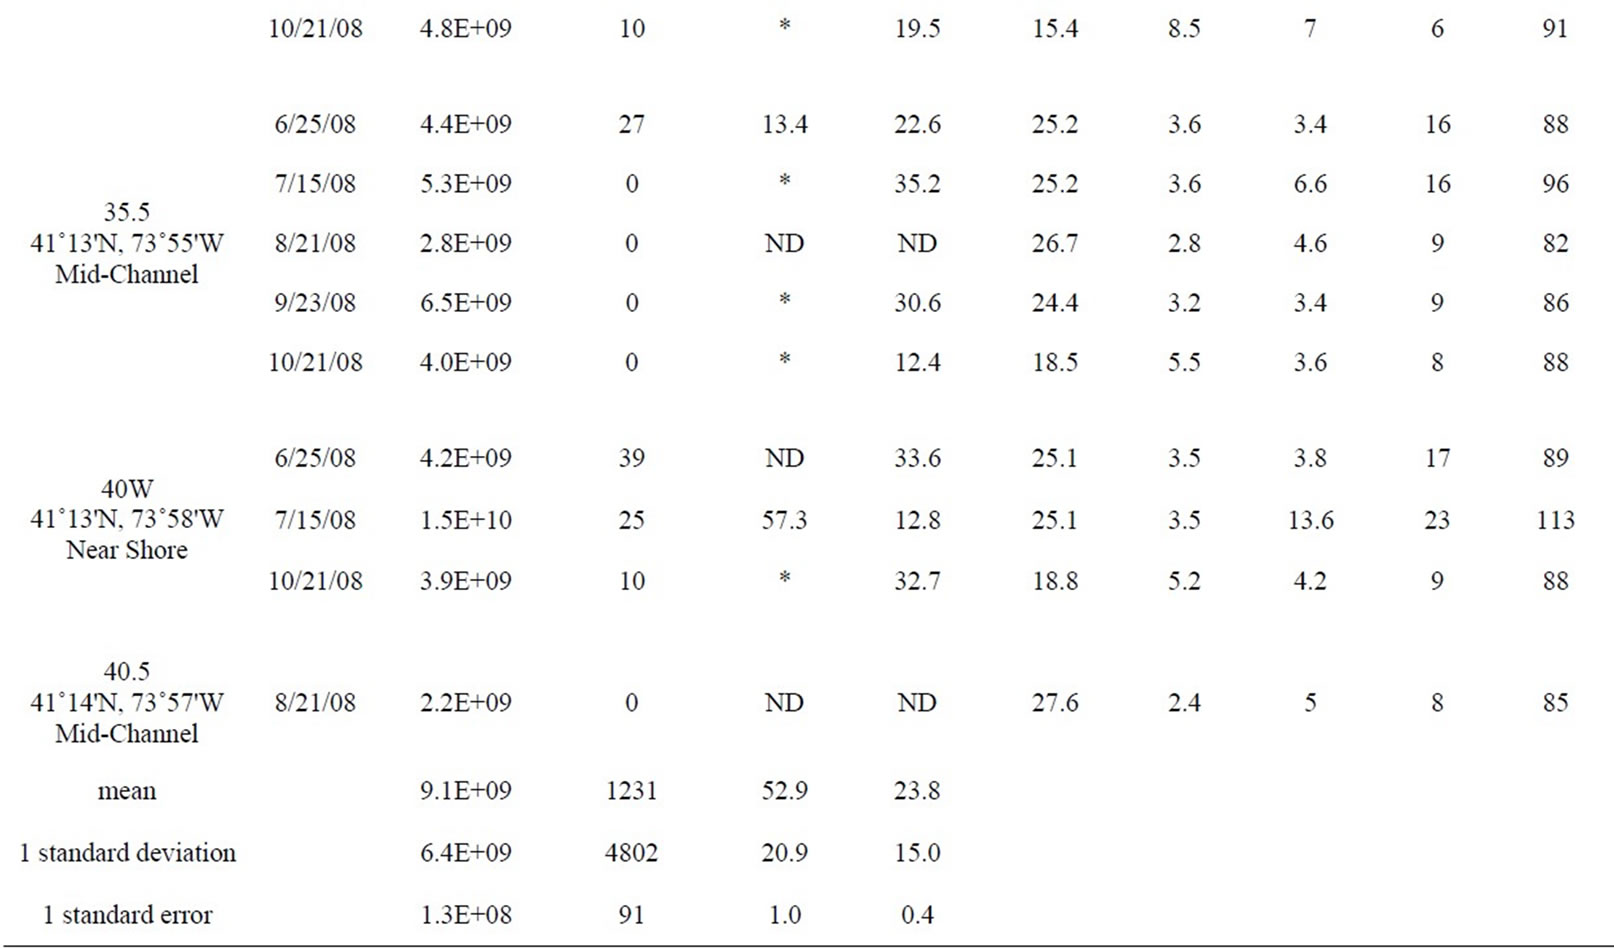
Table 1. All data measured between June and October 2008 at 12 stations in the lower HRE. ND means no data was collected or calculated. Only values <10 and >24,196 MPN 100 ml–1 were used to calculate percent attached Enterococci, *denotes a percentage that was not calculated because at least one of the Enterococcus counts (total and >3 µm) were either too low or too high.
Twenty fields per slide were counted; field size was adjusted for each slide to reach an approximate count of 10 cells per field.
2.3. Enterococcus Counts
The same whole and filtered water samples used for the
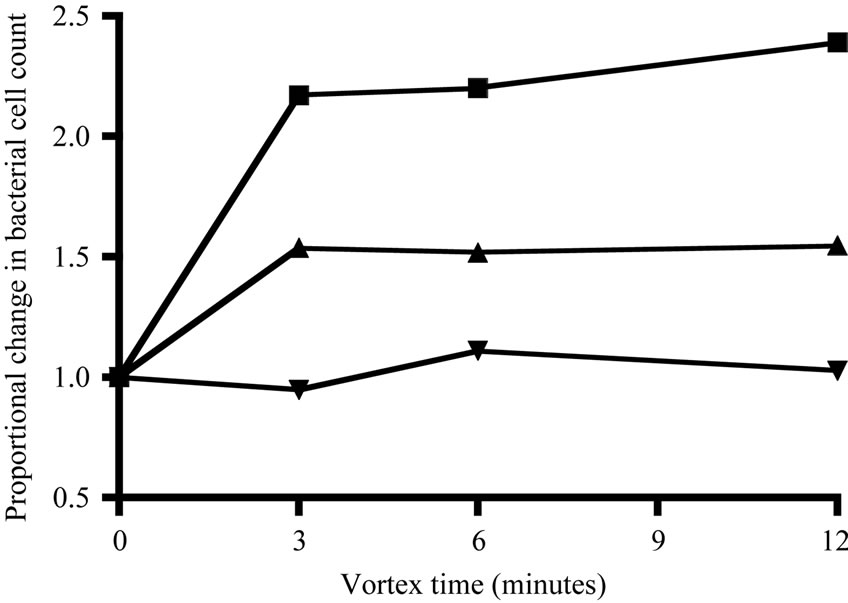
Figure 2. Change in final bacterial cell count during vortexing, shown as the proportional change relative to the initial count at time 0 (i.e., no change = 1).
counts of total bacteria were used to determine free-living and particle-associated Enterococcus concentrations. Enumeration was based on Enterolert media and Quantitray/2000 (IDEXX Laboratories). The trays were incubated at 41˚C for 24 hours and counted using Enterolert’s Most Probable Number (MPN) method based on total numbers of large and small positive wells per tray. Samples with salinity >5 ppt were diluted 1:10 with sterile, deionized water, following the manufacturer’s instructions.
2.4. Statistical Analyses
Because of high variability in the Enterococcus data, central tendency for Enterococcus counts pooled by station or habitat category used medians and geometric means, rather than arithmetic means. For geometric mean calculation, zero-values were replaced with a value 1 significant digit below the detection limit. Because nonparametric statistical tests were required for the Enterococcus data, non-parametric tests were used throughout. Multiple-means comparisons used two-tailed KruskalWallis tests with post-hoc testing based on Dunn’s Multiple Comparison with a significance threshold of 0.05. Correlations between variables paired by station and time were assessed using Spearman’s rs and p-values from two-tailed tests, with a significance threshold of 0.05.
3. Results/Discussion
Table 1 shows the full data set included in this study from both monthly surveys and shore sampling; the data is organized by station from south to north (decreasing salinity), and by date. Each site was assigned a habitat category. “Mid-channel” and “near shore” categories are self-explanatory. Some of the “near shore” sites (18.5E and 40W) were near the mouths of tributaries (the Sawmill River and Cedar Pond Brook, respectively) and thus also potentially influenced by those tributaries. However, all of the “near shore” sites were located in the main river, near the edge. The “tributary” category includes only those samples that were actually within tributaries, away from direct influence of the main river. One site, labeled “Outfall,” was sampled in the rising effluent plume of the Orangetown sewage outfall, near Piermont, NY.
On several dates, dense phytoplankton blooms were found in Newtown Creek (station NT2). Presumably because of very high primary production, on two dates the surface waters in these blooms were highly supersaturated with O2. The O2 readings provided for that station on those two dates were well beyond the range of values for which the sensor was calibrated (maximum value in calibration = 100% saturated). Although the absolute accuracy of those readings is therefore uncertain, they clearly indicate extreme supersaturation.
3.1. Turbidity
A north/south turbidity maximum in the HRE midchannel is not always clearly present, particularly in surface sampling [28] and was not apparent in our observations (Figure 3). However, turbidity did differ significantly between habitat categories (H = 21.8, P < 0.001). Mean turbidity was lowest in the mid-channel, and posthoc testing indicated that the mid-channel mean was significantly different from both the near shore and outfall sites.
3.2. Bacterial Abundances
Average bacterial abundance in this study was 9.2 × 10⁹ ± 6.4 × 10⁹ cell·l–1 (1 standard deviation), a relatively high value compared to many estuaries [29], but consistent with other data from the HRE. Findlay [30] found a grand mean in the HRE of 7.6 × 10⁹ bacterial cell·l–1 with lower and upper quartiles of 4.6 and 9.5 × 10⁹ cell·l–1, respectively, although the observations were mostly from the freshwater portion of the estuary, north of the stations sampled in this study. The range of bacterial abundance in this study also overlapped with data for the lower HRE provided in Taylor et al. [31]. While relatively lower bacterial abundances for the lower HRE were described in Sanudo-Wilhelmy and Taylor [32], that study took place in early spring when water temperatures were <6.5˚C.
Sanudo-Wilhelmy and Taylor [32] found a general northward decrease in bacterial abundance in the lower HRE in early spring, while Taylor et al. [31] found a
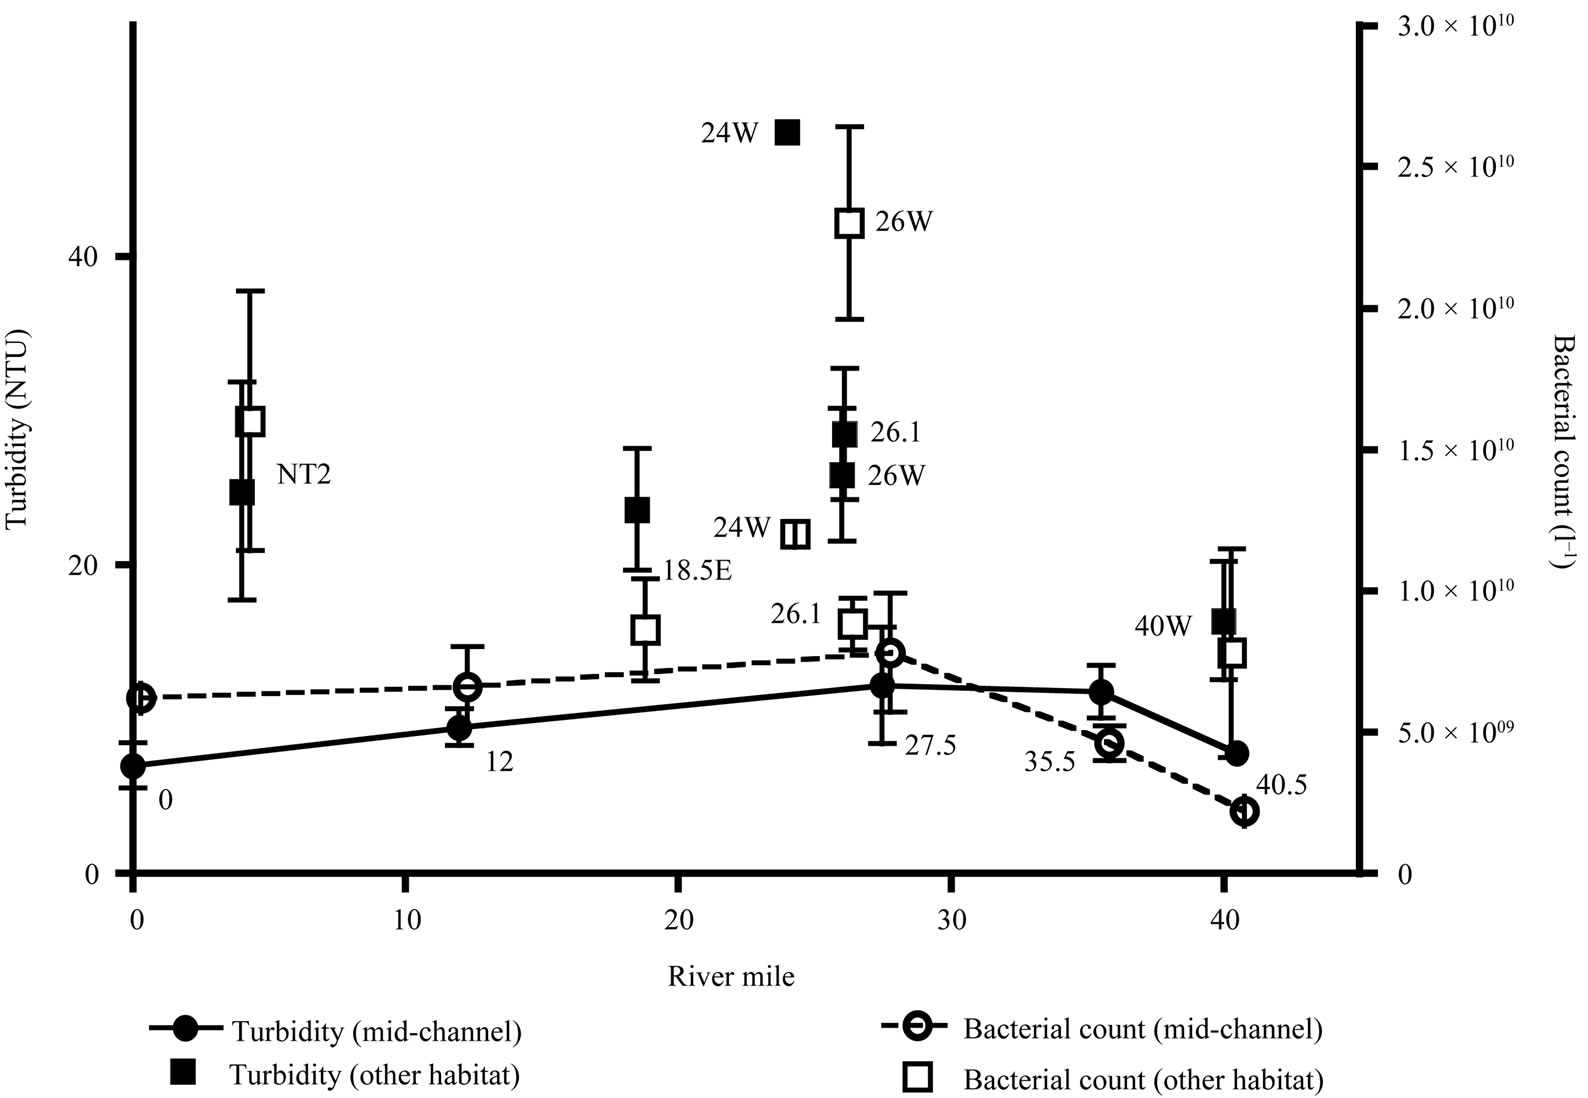
Figure 3. Mean turbidity and bacterial counts plotted by river mile. Mid-channel sites shown with circular symbols, other habitat categories shown with square symbols. Data for mid-channel sites are also connected by lines. Station names are indicated near each data point. Error bars are 1 standard error.
general northward increase. In this study, mean bacterial abundance at mid-channel sites showed little evidence for any north/south trends (Figure 3). Significant differences in bacterial abundance were found among the four different habitat categories (H = 14.9, P = 0.002). However, post-hoc testing indicated that only the outfall had significantly higher bacterial abundance.
The mean percent of total bacteria associated with particles (>3.0 µm) was 23.8% ± 15.0% (1 standard deviation). For comparison, Ducklow and Kirchman [33] quantified particle-associated bacteria in the offshore Hudson River plume in early spring, finding approximately 16% attached bacteria (i.e., those captured by a 3-µm filter). Approximately 9% of the bacteria were particle-associated in waters outside the plume. It is not unusual for estuaries to have high levels of bacterial particle association. For example, approximately 45% of total bacteria were associated with >3-µm particles in the estuarine turbidity maximum of the Columbia River estuary [6,34]. In this study, the highest turbidities (at stations 18.5E (7/14/08) and 24W (9/18/08)) also coincided with high bacterial abundances and a high percentage of particle-attached bacteria (1.6 × 10¹⁰ cell·l–1, with 70.2% attached and 1.3 × 10¹⁰ cell·l–1, with 40.5% attached, respectively). However, the mean percent of particleassociated bacteria did not differ significantly between the four habitat categories (H = 2.2, P = 0.54).
3.3. Enterococcus Counts
Enterococcus concentrations in this study ranged between 0 and 24,196 MPN 100 ml–1 (both ends of the detection limit). US Environmental Protection Agency (US EPA) guidelines recommend closure of marine swimming beaches after a single-sample Enterococcus count exceeding 104 cells 100 ml–1 [22]. Of the 52 samples, 15 had undetectable Enterococcus concentrations, while 15 samples had an MPN 100 ml–1 greater than the US EPA’s single sample maximum criteria for Enterococci. While there were single-sample maximum exceedances of Enterococci in some mid-channel sites, these were rare compared to exceedances at other stations (such as Piermont Outfall, Newtown Creek, and Sparkill Creek). Geometric mean values for the near shore, tributary and outfall sites were all higher than the mid-channel sites (Figure 4). Median values for each category followed the same pattern, which was statistically significant (H = 26.24, P < 0.0001). Post-hoc testing indicated that the mid-channel category was significantly different from the other 3 categories; the remaining 3 categories were
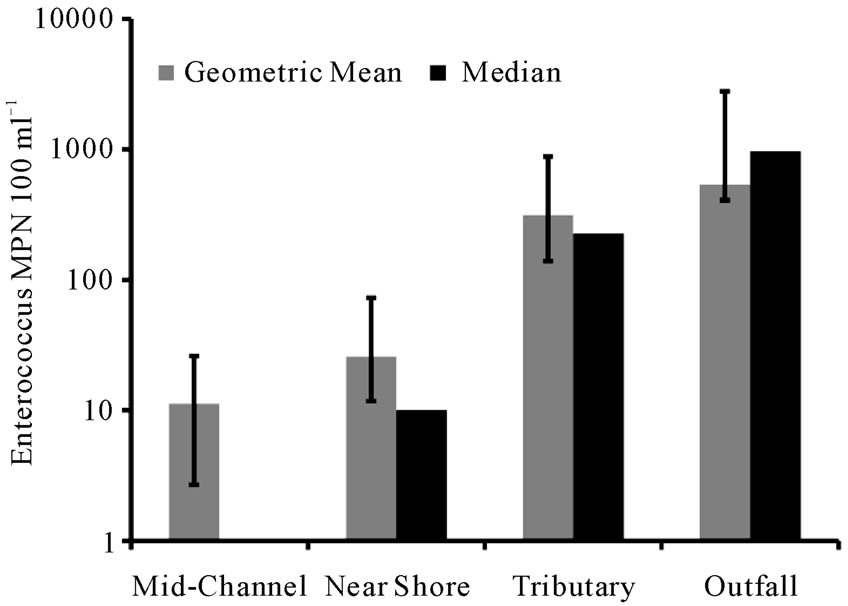
Figure 4. Geometric mean and median of Enterococcus concentration for each habitat category. Positive error bars are larger than the negative error bars because they are the geometric standard error. The median value of the midchannel category was 0.
not significantly different from each other. This result may reflect greater near-shore inputs (e.g. CSOs, tributaries, and non-point source run off), and possibly also different Enterococcus retention and resuspension, in these habitats compared to the main channel.
The mean fraction of Enterococci (52.9% ± 20.9%, 1 standard deviation) associated with particles in the HRE was greater than the fraction of particle-associated bacteria in the background community. Other studies have described similarly-high particle associations for Enterococci. In the Neuse River Estuary (North Carolina, USA), an average of 60% of Enterococci were attached to “settleable particles” (separated by centrifugation) during dry weather and 35% during wet weather [35]. By contrast, in North Carolina creeks, an average of 15% of Enterococci were particle associated in dry weather and 45% in wet weather [17]. In a subsequent study of the same systems, 37% of Enterococci were particle associated on average during storm events [36]. Potential differences in particle association of Enterococci between wet-weather and dry-weather events were not accounted for in this study; however, the lower HRE has a high particle load even during dry weather. Although Enterococcus counts differed significantly among habitat categories (see above), no significant differences in particle association of Enterococci were found between categories (H = 7.22, P = 0.07).
3.4. Correlations
Turbidity correlated significantly with total bacterial counts (Table 2), though not with the percent of particleassociated bacteria. There was also a significant positive relationship between total bacteria and the percent particle associated. The correlation between turbidity and bacterial counts in this study contrasts with studies of the Columbia River Estuary and San Francisco Bay, where the two variables were not significantly correlated [7,34]. However, in both of those systems, turbidity did correlate positively with bacterial production, so a connection between bacteria and turbidity is not necessarily unusual.
Enterococcus MPN and turbidity were also significantly correlated. Similarly, two studies in the Neuse River Estuary found significant correlations between Enterococci and total suspended solids (TSS) [14,35]. Other studies have also found correlations between turbidity/TSS and other FIB, including E. coli and fecal coliforms [37]. While the correlation is consistent with the high fraction of particle-associated Enterococci found in the HRE, turbidity was not significantly correlated with the percent of particle-attached Enterococci.
Relationships between turbidity or TSS and FIBs in the HRE and other systems suggest that better sedimentation control practices could improve microbial water quality, as has been suggested for streams in North Carolina [36]. However, the mechanistic connection between FIB and suspended solids is not well understood. In the HRE, the correlation between Enterococci and turbidity, as well as the high degree of particle association by Enterococci compared to the background bacterial community, could result from input conditions, colonization of particles after input, enhanced in-situ persistence of particle-associated Enterococci, or resuspension of contaminated sediments. A related issue is the physical/ chemical characteristics and source of the particles colonized by Enterococci in the HRE compared to the bulk of suspended solids. The majority of suspended solids in the HRE are delivered from upriver sources [38]. It is unknown whether these particles can be colonized by Enterococci, or other exogenous bacteria, following sewage input events.
In these data, the relationship between chlorophyll concentration and bacterial abundance was significant, as has been described for other systems [39], though not for the HRE [30,31]. The correlation between bacterial abundance and chlorophyll concentration in this study may be related to a wider range of habitat categories (and a correspondingly wider range of chlorophyll concentrations) sampled compared to previous research.
Counts of Enterococci and chlorophyll concentration were also significantly related in these data. Significant correlations between Enterococci and phytoplankton pigments have been described for other estuaries [40]. A plausible explanation for a positive relationship between Enterococci and chlorophyll may be that the nutrients in sewage, input together with Enterococci, contribute to phytoplankton blooms. Similarly, sewage inputs may
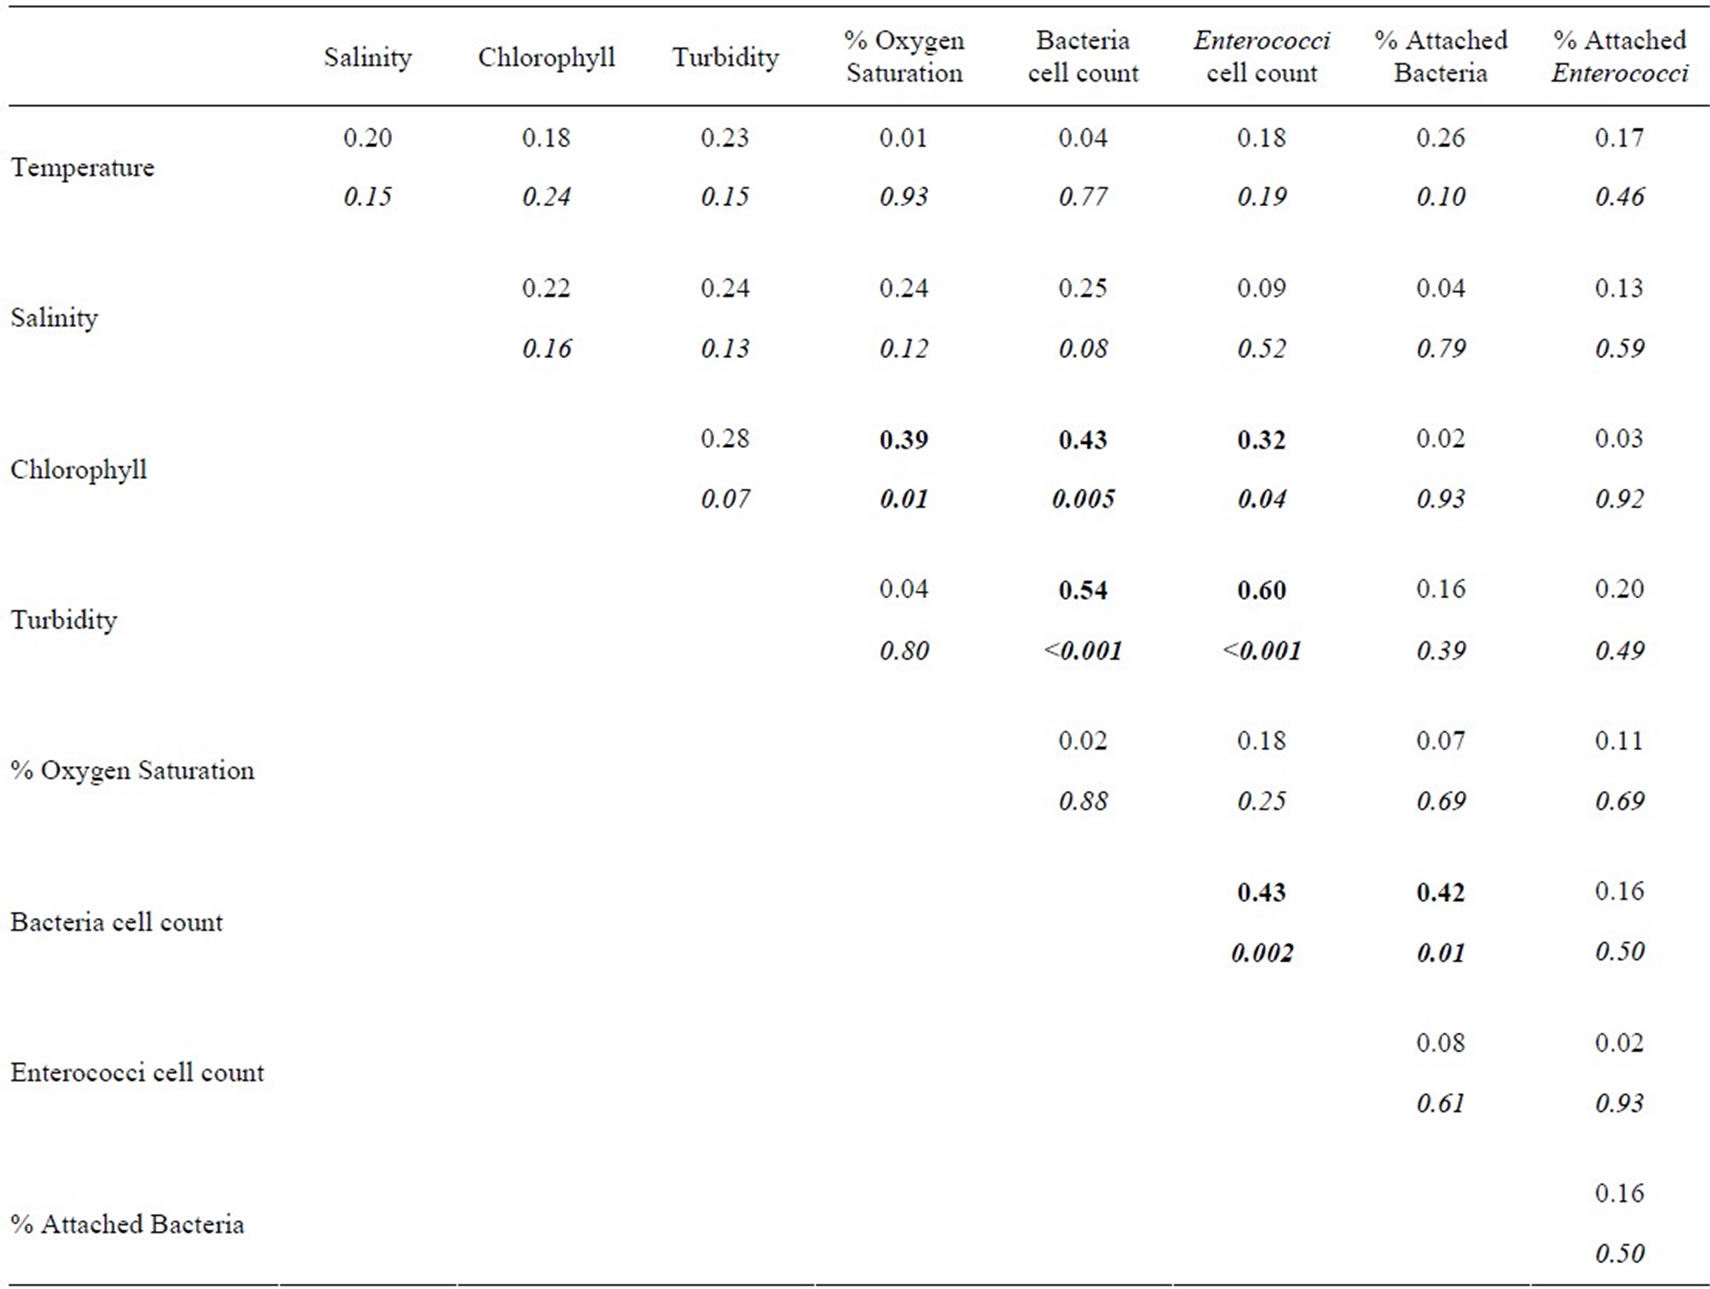
Table 2. Correlation matrix of variables from Table 1. The upper number is the Spearman correlation coefficient (rs), corresponding P-values are listed below in italics. Correlations with P-values < 0.05 are highlighted in bold type.
elevate dissolved organic matter concentrations, which could explain the positive relationship between counts of total bacteria and counts of Enterococcus. Alternately, the correlation could simply derive from covariation between bacteria, Enterococci, and chlorophyll. The remaining robust correlation in these data, between chlorophyll and oxygen saturation, is almost certainly attributable to oxygen production during photosynthesis.
4. Conclusions
Many portions of the HRE currently lack comprehensive water-quality testing for sewage indicators, and the microbiology of the lower HRE has received only limited study. Combining the available information (including this study), bacterial abundance in the lower HRE is relatively high compared to many estuaries. While previously described north-south patterns of bacterial abundance were not apparent, new spatial patterns between the mid-channel and near shore sites were revealed. Similarly, mid-channel Enterococcus counts were lower than counts near shore, in tributaries, and near an outfall. In establishing a comprehensive water-quality testing program for the HRE, it will be important to take crosschannel variability into account.
This was the first study to assess particle association of bacteria in the HRE. On average, 24% of total bacteria in the lower HRE were associated with particles, bacterial abundance was significantly correlated with turbidity, and the percent of particle-associated bacteria rose with increasing bacterial count. These relationships may reflect the more favorable conditions for bacterial activity near particles, or they may simply reflect the observation that turbidity tends to be higher near shore where inputs and resuspension lead to high bacterial counts.
The finding that over half of the Enterococci were associated with particles has important management implications. The microenvironment around particles may favor longer Enterococci persistence and settling to the bottom. This could reinforce the heterogeneous distribution of Enterococci in the estuary. For example, large particles may settle out in the vicinity of near shore sources (e.g., sewage outfalls, CSOs), potentially reinforcing the difference between depositional near shore and mid-channel environments. Resuspension in nearshore environments could explain the correlation between Enterococci and turbidity.
The high degree of particle association by Enterococci in relation to the background bacterial community may result from input conditions, preferential attachment by Enterococci after input, or higher in-situ persistence of particle-associated compared to free-living Enterococci. Understanding the dynamics of particle-associated cells is critical to evaluating monitoring data, developing water-quality models, and selecting best management practices. The process of attachment and the effects of particle association on persistence and sedimentation of FIB, such as Enterococcus, should be studied in greater detail, especially in systems with high particle concentrations, like the HRE.
5. Acknowledgements
The authors wish to thank John Lipscomb, the captain of the R. Ian Fletcher, and Riverkeeper for their support and assistance. Carol Knudson and Sarah McGrath also provided field and laboratory assistance. Partial funding for this study was provided by the National Science Foundation through OCE 08-45799 to ARJ. An internship funded through OCE 06-49024 supported ES during the summer of 2008. Additional critical support was provided by grants from the Wallace Research Foundation and the Brinson Foundation.
REFERENCES
- M. M. Lyons, J. E. Ward, H. Galf, R. E. Hicks, J. M. Drake and F. C. Dobbs, “Theory of Island Biogeography on a Microscopic Scale: Organic Aggregates as Islands for Aquatic Pathogens,” Aquatic Microbial Ecology, Vol. 60, No. 1, 2010, pp. 1-13. doi:10.3354/ame01417
- T. Kiorboe and G. A. Jackson, “Marine Snow, Organic Solute Plumes, and Optimal Chemosensory Behavior of Bacteria,” Limnology and Oceanography, Vol. 46, No. 6, 2001, pp. 1309-1318. doi:10.4319/lo.2001.46.6.1309
- A. L. Shanks and M. L. Reeder, “Reducing Microzones and Sulfide Production in Marine Snow,” Marine Ecology Progress Series, Vol. 96, No. 1, 1993, pp. 43-47. doi:10.3354/meps096043
- E. F. DeLong, D. G. Franks, and A. L. Alldredge, “Phylogenetic Diversity of Aggregate-Attached vs. Free-Living Marine Bacterial Assemblages,” Limnology and Oceanography, Vol. 38, No. 5, 1993, pp. 924-934. doi:10.4319/lo.1993.38.5.0924
- K. D. Bidle and M. Fletcher, “Comparison of Free-Living and Particle-Associated Bacterial Communities in the Chesapeake Bay by Stable Low-Molecular-Weight RNA Analysis,” Applied and Environmental Microbiology, Vol. 61, No. 3, 1995, pp. 944-952.
- B. C. Crump, J. A. Baross and C. A. Simenstad, “Dominance of Particle-Attached Bacteria in the Columbia River Estuary, USA,” Aquatic Microbial Ecology, Vol. 14, No. 1, 1998 pp. 7-18. doi:10.3354/ame014007
- J. T. Hollibaugh and P. S. Wong, “Microbial Processes in the San Francisco Bay Estuarine Turbidity Maximum,” Estuaries, Vol. 22, No. 4, 1999, pp. 848-862. doi:10.2307/1353066
- C. M. Davies and H. J. Bavor, “The Fate of Stormwater-Associated Bacteria in Constructed Wetland and Water Pollution Control Pond Systems,” Journal of Applied Microbiology, Vol. 89, No. 2, 2000, pp. 349-360. doi:10.1046/j.1365-2672.2000.01118.x
- O. Hess-Erga and K. Attramadal, “Biotic and Abiotic Particles Protect Marine Heterotrophic Bacteria during UV and Ozone Disinfection,” Aquatic Biology, Vol. 4, No. 2, 2008, pp. 147-154. doi:10.3354/ab00105
- H. W. Ducklow, D. L. Kirchman and G. T. Rowe, “Production and Vertical Flux of Attached Bacteria in the Hudson River Plume of the New York Bight as Studied with Floating Sediment Traps,” Applied and Environmental Microbiology, Vol. 43, No. 4, 1982, pp. 769-776.
- T. Garcia-Armisen and P. Servais, “Partitioning and Fate of Particle-Associated E. coli in River Waters,” Water Environment Research, Vol. 81, No. 1, 2009, pp. 21-28.
- C. M Lee, T. Y. Lin, C. C. Lin, G. A. Kohbodi, A. Bhattl, R. Lee and J. A. Jay, “Persistence of Fecal Indicator Bacteria in Santa Monica Bay Beach Sediments,” Water Research, Vol. 40, No. 14, 2006, pp. 2593-2602. doi:10.1016/j.watres.2006.04.032
- A. Hartz, M. Cuvelier, K. Nowosielski, T. Bonilla, M. Green, N. Esiobu, D. McCorquodale and A. Rogerson, “Survival Potential of Escherichia coli and Enterococci in Subtropical Beach Sand: Implications for Water Quality Managers,” Journal of Environmental Quality, Vol. 37, No. 3, 2008, pp. 898-905. doi:10.2134/jeq2007.0312
- J. S. Fries, G. W. Characklis and R. T. Noble “Sediment-Water Exchange of Vibrio sp. and Fecal Indicator Bacteria: Implications for Persistence and Transport in the Neuse River Estuary, North Carolina, USA,” Water Research, Vol. 42, No. 4-5, 2008, pp. 941-950. doi:10.1016/j.watres.2007.09.006
- D.A. T. Phillip, P. Antoine, V. Cooper, L. Francis, E. Mangal, N. Seepersad, I. Singh and A. Ramsubhag, “Impact of Recreation on Recreational Water Quality of a Small Tropical Stream,” Journal of Environmental Monitoring, Vol. 11, 2009, pp. 1192-1198. doi:10.1039/b817452k
- R. Jamieson, R. Gordon, D. Joy and H. Lee, “Assessing Microbial Pollution of Rural Surface Waters—A Review of Current Watershed Scale Modeling Approaches,” Agricultural Water Management, Vol. 70, No. 1, 2004, pp. 1-17. doi:10.1016/j.agwat.2004.05.006
- G. W. Characklis, M. J. Dilts, O. D. Simmons, C. A. Likirdopulos, L. A. H. Krometis and M. D. Sobsey, “Microbial Partitioning to Settleable Particles in Stormwater,” Water Research, Vol. 39, No. 9, 2005, pp. 1773- 1782. doi:10.1016/j.watres.2005.03.004
- L. Liu, M. Phanikumar, S. Molloy, R. Whitman, D. Shively, M. B. Nevers, D. Schwab and J. Rose, “Modeling the Transport and Inactivation of E. coli and Enterococci in the Near-Shore Region of Lake Michigan,” Environmental Science and Technology, Vol. 40, No. 16, 2006, pp. 5022-5028. doi:10.1021/es060438k
- J.-W. Kim, Y. A. Pachepsky, D. R. Shelton and C. Coppock, “Effect of Streambed Bacteria Release on E. coli Concentrations: Monitoring and Modeling with the Modified SWAT,” Ecological Modeling, Vol. 221, 2010, pp. 1592-1604. doi:10.1016/j.ecolmodel.2010.03.005
- T. M. Brosnan, A. Stoddard and L. J. Hetling, “Hudson River Sewage Inputs and Impacts: Past and Present,” In: J. S. Levinton and J. R. Waldman, Eds., The Hudson River Estuary, Cambridge University Press, New York, 2006, pp. 335-348. doi:10.1017/CBO9780511550539.025
- NYC DEP, “2008 New York Harbor Water Quality Report,” New York City Department of Environmental Protection, New York, 2008, http://www.nyc.gov/html/dep/pdf/hwqs2008.pdf
- US EPA, “Ambient Water Quality Criteria for Bacteria,” U.S. Environmental Protection Agency, Office of Water, Washington DC, EPA 440/5-84-002, 24, 1986.
- UNESCO, “Protocols for the Joint Global Ocean Flux Study (JGOFS) Core Measurements,” IOC Manuals and Guides, No. 29, UNESCO, Paris, 1994.
- N. Buesing and M. O. Gessner, “Comparison of Detachment Procedures for Direct Counts of Bacteria Associated with Sediment Particles, Plant Litter and Epiphytic Biofilms,” Aquatic Microbial Ecology, Vol. 27, No. 1, 2002, pp. 29-36. doi:10.3354/ame027029
- M. Lunau, A. Lemke, K. Walther, W. Martens-Habbena and M. Simon, “An Improved Method for Counting Bacteria from Sediments and Turbid Environments by Epifluorescence Microscopy,” Environmental Microbiology, Vol. 7, No. 7, 2005, pp. 961-968. doi:10.1111/j.1462-2920.2005.00767.x
- W. B. Yoon and R. A. Rosson, “Improved Method of Enumeration of Attached Bacteria for Study of Fluctuation in the Abundance of Attached and Free-Living Bacteria in Response to Diel Variation in Seawater Turbidity,” Applied and Environmental Microbiology, Vol. 56, No. 3, 1990, pp. 595-600.
- R. T. Noble and J. A. Fuhrman, “Use of SYBR Green I for Rapid Epifluorescence Counts of Marine Viruses and Bacteria,” Aquatic Microbial Ecology, Vol. 14, No. 2, 1998, pp. 113-118. doi:10.3354/ame014113
- H. Bokuniewicz, “Sedimentary Processes in the Hudson River Estuary,” In: J. S. Levinton and J. R. Waldman, Eds., The Hudson River Estuary, Cambridge University Press, New York, 2006, pp. 39-50. doi:10.1017/CBO9780511550539.006
- H. W. Ducklow and F. Shiah, “Estuarine Bacterial Production,” In: T. Ford, Ed., Aquatic Microbiology: An Ecological Approach, Blackwell, London, 1993, pp. 261- 284.
- S. E. G. Findlay, “Bacterial Abundance, Growth and Metabolism in the Tidal Freshwater Hudson River,” In: J. S. Levinton and J. R. Waldman, Eds., The Hudson River Estuary, Cambridge University Press, New York, 2006, pp. 99-106. doi:10.1017/CBO9780511550539.010
- G. T. Taylor, J. Way and M. I. Scranton, “Planktonic Carbon Cycling and Transport in Surface Waters of the Highly Urbanized Hudson River Estuary,” Limnology and Oceanography, Vol. 48, No. 5, 2003, pp. 1779-1795. doi:10.4319/lo.2003.48.5.1779
- S. A. Sanudo-Wilhelmy and G. T. Taylor, “Bacterioplankton Dynamics and Organic Carbon Partitioning in the Lower Hudson River Estuary,” Marine Ecology Progress Series, Vol. 182, 1999, pp. 17-27. doi:10.3354/meps182017
- H. W. Ducklow and D. L. Kirchman, “Bacterial Dynamics and Distribution during a Spring Diatom Bloom in the Hudson River Plume, USA,” Journal of Plankton Research, Vol. 5, No. 3, 1983, pp. 333-355. doi:10.1093/plankt/5.3.333
- B. C. Crump and J. A. Baross, “Particle-Attached Bacteria and Heterotrophic Plankton Associated with the Columbia River Estuarine Turbidity Maxima,” Marine Ecology Progress Series, Vol. 138, No. 1-3, 1996, pp. 265-273. doi:10.3354/meps138265
- J. S. Fries, G. W. Characklis and R. T. Noble, “Attachment of Fecal Indicator Bacteria to Particles in the Neuse River Estuary, NC,” Journal of Environmental Engineering-ASCE, Vol. 132, No. 10, 2006, pp. 1338-1345. doi:10.1061/(ASCE)0733-9372(2006)132:10(1338)
- L. A. H. Krometis, G. W. Characklis, O. D. Simmons, M. J. Dilts, C. A. Likirdopulos and M. D. Sobsey, “IntraStorm Variability in Microbial Partitioning and Microbial Loading Rates,” Water Research, Vol. 41, No. 2, 2007, pp. 506-516. doi:10.1016/j.watres.2006.09.029
- M. Mallin, V. L. Johnson and S. H. Ensign, “Comparative Impacts of Stormwater Runoff on Water Quality of an Urban, Suburban, and Rural Stream,” Environmental Monitoring and Assessment, Vol. 159, 2009, pp. 475-491. doi:10.1007/s10661-008-0644-4
- G. R. Munoz and M. A. Panero, “Sources of Suspended Solids to the New York/New Jersey Harbor Watershed,” The New York Academy of Sciences. New York, 2008.
- D. F. Bird and J. Kalff, “Empirical Relationships between Bacterial Abundance and Chlorophyll Concentration in Fresh and Marine Waters,” Canadian Journal of Fisheries and Aquatic Sciences, Vol. 41, No. 7, 1984, pp. 1015- 1023. doi:10.1139/f84-118
- A. Mill, T. Schlacher and M. Katouli, “Tidal and Longitudinal Variation of Faecal Indicator Bacteria in an Estuarine Creek in South-East Queensland, Australia,” Marine Pollution Bulletin, Vol. 52, No. 8, 2006, pp. 881-891. doi:10.1016/j.marpolbul.2005.11.018