Journal of Software Engineering and Applications
Vol.08 No.04(2015), Article ID:55671,7 pages
10.4236/jsea.2015.84019
Reusable Function Discovery by Call-Graph Analysis
Dan Zhao, Li Miao, Dafang Zhang
College of Information Science and Engineering, Changsha, China
Email: dzhao34@hnu.edu.cn, miaoli@hnu.edu.cn, dfzhang@hnu.edu.cn
Copyright © 2015 by authors and Scientific Research Publishing Inc.
This work is licensed under the Creative Commons Attribution International License (CC BY).
http://creativecommons.org/licenses/by/4.0/


Received 16 January 2015; accepted 14 April 2015; published 15 April 2015
ABSTRACT
Nowadays, one of the IT challenges faced by many enterprises is the maintenance of their legacy system and migration of those systems to modern and flexible platform. In this paper, we study the network properties of software call graphs, and utilize the network theories to understand the business logic of legacy system. The call graphs turn out approximately scale-free and small world network properties. This finding provides new insight to understand the business logic of legacy system: the methods in a program can be naturedly partitioned into the business methods group and supportive methods group. Moreover, the result is also very helpful in reusing valuable functionality and identifying what services should be to expose in the migration from legacy to modern SOA context.
Keywords:
Call Graph, Network Properties, Legacy System, Service-Oriented Architecture

1. Introduction
In today’s Internet-driven economy, one of the IT challenges faced by many enterprises is the maintenance of their legacy system and migration of those systems to modern and flexible platform [1] . Legacy systems generally consist of invaluable assets with embedded critical business logic representing many years of coding, developments, enhancements and modification. However, they are always undocumented, tightly coupled, and relative closed and inflexible. Thus, legacy systems present a dilemma: on the one hand, enterprises cannot simply remove/replace those systems as they are mission critical and their failure can have a significant impact on business. On the other hand, maintaining them incurs unjustifiable expense. A viable solution to this dilemma is to migrate those systems into new technological environments in which the legacy features can be reused. Service-Oriented Architecture (SOA) [2] has gained significant attention from academic and industry as a promising architectural style enabling legacy system to expose and reuse their functionalities. The objective of SOA is extracting and modularizing the valuable functionality in legacy system into shared, reusable service. The service here is some encapsulated component with well-defined interface and interoperability protocol, which composes SOA-style application flexibly and quickly. But both in commercial and academic context, currently most legacy system are extremely large and complex. They easily contain hundreds of thousands or even millions of lines of code, and different parts may be developed by different developers with various styles and documentation never catches up with the code change. Therefore, it is almost impossible to comprehend the whole system for developer when they migrate legacy to SOA, let alone find valuable functionalities and wrapper them into services [3] . Therefore, it would be quite helpful for developers to have some “intelligent and knowledgeable searching” technique to understand the business logic of legacy system and highlight the valuable functionality which has potential to be wrapped into service.
A call-graph is one kind of internal graph structure of software program, and reflects the essential function and behavior of programs. It is a directed graph G = (N,E), which maybe has loops, where N is the set of nodes which represent methods, and E is the set of edges which represents invocation relations between methods. For every node , in-degree is the number of the in-coming edges of this node, which indicates the times that this method is invoked by other methods; Out-degree is the number of the out-going edges of this node, which indicates the times that this method invokes other methods. We made three empirical analyses to investigate the network properties of software call-graph, and utilize the network theories to understand the business logic of legacy system. The reason we make use of the network theories is that the invocation relationship underlying call-graph is very similar to the link relationship in network:
・ They both have same static structure.
In software programs, the caller method invokes the callee method and the callee method is invoked by caller method; while in network, the source web page links to the target web page and the target web page is linked to the source web page. Both of them are directive connection relationships within different systems.
・ They both perform their functions through dynamic connection
In software programs, different modules execute step-by-step invocation then they can provide computing capability; while in network, different web pages can be dynamically linked together then they can provide information service. Both of them reflect the essential function by the runtime characteristics. This characteristics has already used in the Google web crawling, which is done by analyzing this link relationship underlying webpages.
The most interesting observation in the empirical analyses is that there are a few key nodes in software call graphs with the in-degree above average or the out-degree above average. Re-checking our testing cases, we found that the nodes with the out-degree above average correspond to those methods which provide high-level business functions; and the nodes with the in-degree above average correspond to those methods which provide low-level supportive functions. For example, the method init() has the out-degree above average, which performs the business function “initialization” to initialize the whole system; the methods initDB(), initCache() and buildConc() invoked by init() have high in-degree, which can provide some supportive functions, such as initializing database, clearing cache and building socket connection. These key methods provide new insight to understand the business logic in legacy systems: the methods in a program can be naturedly partitioned into the business methods group and supportive methods group. Moreover, the result is also very helpful in reusing valuable functionality and identifying what services should be to expose in the migration from legacy to SOA context.
The rest of this paper is structured as follows: Section II explains our approach; Section IV makes three empirical analyses to investigate network properties of software call graphs. Section V presents and the findings as lessons learned. Section VI the paper concludes with some potential work.
2. Approach
We generate and analyze call-graph by static program analysis [4] , which is a significant technique to determine the properties of program behavior without execution, has already been adopted in the software comprehension, debugging and testing field in the past twenty years. There have already many algorithms to construct a call graph from the software program, such as Class Hierarchy Analysis (CHA), Rapid Type Analysis (RTA) and Control Flow Analysis (CFA) [5] . We select CHA algorithm [6] , which means scanning the class inheritance graph and constructing call-graph based on class hierarchy information. This is a relative simple algorithm and there is no reduplicate edge in the call-graph generated, which means even if a caller method invokes the callee method multiple times, there is only one edge existed between the caller method to the callee method. So for every node in our call-graph, in-degree indicates the number of the methods which invoke this method, and out- degree indicates the number of the methods which are invoked by this method. The reason we select this algorithm is that what we focus on the happiness of invocation relationship, not the time of the invocation relationship.
We use Java programming language as the target language and analyze ten widely used Java programs, whose code are publicly available and can be downloaded from the open-source website. They are listed as following Table 1.
We implement our analysis tool “Spotglitter” as a plugin for Eclipse. The tool is based on T.J. Watson Libraries for Analysis (WALA) [17] , which is a bytecode analysis framework for Java. The tool first accept Java programs input, no matter source code or bytecode, and then generate call-graph for the program based on class hierarchy information. After that, It analysis the call-graph and visualize the result. We make three empirical analyses to detect characteristic of the degree distribution, node distribution, clustering degree and the separation degree of software programs call-graph. The detail is introduced in the Section 3.
3. Empirical Analysis
3.1. Empirical Analysis 1
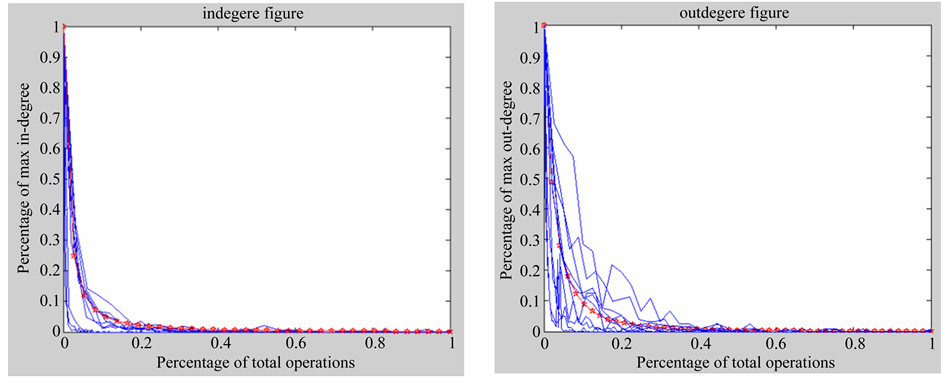
For call-graph is a directed graph, where an invocation relationship corresponds to a directed link pointing from the caller method to the callee method, in this empirical analysis, we explored the in-degree distribution and out- degree distribution respectively in order to give an exact analysis for the invocation relationship underlying soft- ware programs. The results are illustrated in Figure 1(a) and Figure 1(b). Here the X axis represents the percentage of the total methods and the Y axis represents the percentage of the max in-degree (in Figure 1(a)) or max out-degree (in Figure 1(b)).
From the results, we observed that both the in-degree distribution and out-degree distribution can be approximately characterized by the following algebraic scaling behavior:
 (1)
(1)
where k is the variable that measures the number of links at different nodes and γ is the scaling exponent. We calculate the mathematical expectation and variance for the ten programs, the scaling exponent γ in in-degree distribution (in Figure 1(a)) is 1.6 and the scaling exponent γ in out-degree distribution (in Figure 1(b)) is 2.1 ± 0.1.

Table 1. Summary of analyzed programs.
 (a) (b)
Figure 1. (a) In-degree Distribution (γ = 1.6); (b) Out-degree Distribution (γ = 2.1).
3.2. Empirical Analysis 2
The aim of this experiment is to analyze the nodes distribution in call-graph based on the result in empirical analysis 1. The result is shown in Figure 2. Here the X axis represents the percentage of the max in-degree and the Y axis represents the percentage of the max out-degree.
We observe in Figure 2 that most of the nodes are located in the left-lower area, namely that both the in- degree and out-degree of those nodes are below average in-degree and out-degree. But in the right-upper area there isn’t any node existed, which indicates that there existed no nodes in the call-graph which have both above average in-degree and out-degree. Another interesting observation is that there are nearly 20% nodes with the out-degree above average out-degree, whose out-going edges cover over 70% of total out-going edges, and there are nearly 13% nodes with the in-degree above average in-degree, whose in-coming edges cover over 50% of total in-coming edges.
3.3. Empirical Analysis 3
In this empirical analysis, we try to analyze the clustering degree and the separation degree of the call-graph by computing the clustering coefficient and the characteristic path length. The characteristic path length L is defined as the average over all the links in the shortest path connecting the two nodes in the call-graph, which is used to measure the typical separation between two nodes in the network (a global property). The characteristic path length L can be computed with the Dijkstra algorithm [18] . The clustering coefficient C is defined as the average fraction of pairs of neighbors of a node that are also neighbors of each other, which can measure the cliquishness of a typical neighborhood (a local property). The clustering coefficient C can be computed by the following equation:
 (2)
(2)
Suppose that a nodev has kv neighbors; then the clustering coefficient Cv of a node n is given by theratio of existing links Ev between its kv first neighbors to the potential number of such ties . By averaging Cv over all nodes one arrives at the clustering coefficient C of the call-graph. We also compare these values to the random networks with the same number of nodes N. Toa given N and μ, where μ is the average number of links per node, the value of the clustering coefficient C and the characteristic path length L of random network are very small. In particular, for N → ∞ and μ fixed, the characteristic path length in the largest connected component approaches the logarithmic behavior of a Moore graph,
![]() (3)
(3)
![]()
Figure 2. Distribution of in-degree and out-degree.
and the clustering coefficient approaches zero,
![]() (4)
(4)
The result is listed in Table 2. From Table 2, we see that the call-graph has large clustering, C ![]() Crand, and the characteristic path length, L ≈ Lrand, where Crand and Lrand are the respective statistical quantities for a random network with the same parameters N and μ.
Crand, and the characteristic path length, L ≈ Lrand, where Crand and Lrand are the respective statistical quantities for a random network with the same parameters N and μ.
4. Finding and Discussion
4.1. Findings
From our preliminary empirical analysis, we can propose that these call-graph generated from software programs show the properties in both scale-free network [19] [20] and small-world network [21] [22] , which has already shown in many physical networks, such as cellular network [23] , scientific literature [24] , WWW [25] and telephone network [26] .
・ Scale-free network characteristics
Scale-free networks, including the Internet, are characterized by an uneven distribution of connectedness. Instead of the nodes of these networks having a random pattern of connections, some nodes act as “very connected” hubs, a fact that dramatically influences the way the network operates. Scale-free networks are characterized by a power-law distribution of a node’s degree (i.e. the number of its next neighbors). From the empirical analysis 1, we have observed that the in-degree distribution and out-degree distribution of call graphs can be approximated by the power law, where the scaling exponent γ in in-degree distribution is 1.6 and the scaling exponent γ in out-degree distribution is 2.1 ± 0.1. While other scale-free network, such as WWW, Social network, Cellular network, phone call network, the scaling exponent is between 2.0 to 3.0. The power law distribution brings out the result that the structure and dynamics of scale-free network are strongly affected by a few nodes covering a great number of connections. This result is proved in empirical analysis 2. We have seen that nearly 20% nodes with the out-degree above average out-degree, whose out-going edges cover over 70% of total out-going edges, and there are nearly 13% nodes with the in-degree above average in-degree, whose in-coming edges cover over 50% of total in-coming edges. Comparing with the internet, the methods with high out-degree are very similar to hub nodes on the internet, i.e., pages with many links to authorities pages, based on only the links between web pages [27] . The number of hub nodes is very small but they are very highly connected, which means deleting them is far more destructive to the whole internet.
・ Small-world network characteristics
Roughly speaking, small-world network are those with high clustered subsets of nodes that there are a few steps away from each other. More precisely, the defining properties of small-world network rest on two structural properties: clustering and separation. In term of network topology, clustering, a local property, is used to measure the probability that two neighbors of one node are connected themselves, which is expressed by clustering coefficient. And separation, a global property measured by the characteristic path length, is used to evaluate the separation degree between two nodes in the network. In a small-world network, the characteristic path length compares to that in a random network with the same number of edges, whilst the clustering coefficient of its nodes can be orders of magnitudes larger on average. Watts [7] discusses several models for generating graphs simultaneously satisfying these two properties. From empirical analysis 3 (Table 2), we find that obviously the call-graph lies in these two extremes: they have large clustering, C ![]() Crand, and small characteristic path length, L ≈ Lrand. Therefore, we conclude that the call-graph of software program can be described by small-world network. With the localization attribute in small-world network, we can also give some explanation to the separation of the nodes with the in-degree above average and the out-degree above average in the second empirical analysis. Because of the large clustering coefficient and the small average shortest path, the nodes in the call-graph will be concentrated in several local areas with large numbers of edges. These local areas are composed of those key nodes with in-degree above average or out-degree above average and the nodes which are directly connected to the key nodes.
Crand, and small characteristic path length, L ≈ Lrand. Therefore, we conclude that the call-graph of software program can be described by small-world network. With the localization attribute in small-world network, we can also give some explanation to the separation of the nodes with the in-degree above average and the out-degree above average in the second empirical analysis. Because of the large clustering coefficient and the small average shortest path, the nodes in the call-graph will be concentrated in several local areas with large numbers of edges. These local areas are composed of those key nodes with in-degree above average or out-degree above average and the nodes which are directly connected to the key nodes.
4.2. Discussion
Based on scale-free network and small-world network theories, we conclude that the key methods in the software programs contain about 20% of the total programs. This result provides extremely valuable and useful information to perform the reusing action to existing applications. In SOA context, most services should be mapped to business functions. So we believe that those methods with the out-degree above average, about 20% of total methods, should be extracted as services first of all. The other methods with large in-degree should also take into consideration because they can be used as atomic services to compose complex services. Based on this conclusion, developers can “search” in existing programs quickly and reuse proper methods based on this degree distribution. Moreover, as we explained in Section 1, the connectivity properties reflect essential function and behavior of programs. So from the analysis of degree distribution, maybe we can give an appropriate measurement to “reusage quality”. Similar to the Pareto Principle (also known as 20 - 80 rule), we can assume that the methods with large connections are quite possibly be connected again in future, which means these methods are more useful than the others. Then we can get a conclusion that these methods can have higher reusage quality than the other methods. In addition, most of the test cases are well known and regarded as good-design programs. The out-degree distribution in a few programs cannot be identified with a scale-free regime, which is due to the limited size of the sample and some fine difference among different programming models. So what is the best distribution model for the invocation relationship in software programs? How can we use the degree distribution for call-graph as a criterion to evaluate the design of the software programs? Can this power law distribution or the key methods ratio be used as an indicator to measure the quality of the software? These are also very interesting but critical problems in software engineering area.
Table 2. Clustering coefficient and average shortest path in call-graph and random network.
5. Conclusions
With the quickly changing requirements and the ever growing high cost for software programs, how to reuse legacy system asset and extend current software lifecycle has already become an urgent problem in IT field. SOA technology emerges as a promising approach. But a basic problem for SOA is how to find the similar functions and evaluate the “reusage quality” of these functions rapidly. For invocation relationship reflects the essential function and behavior of programs, in this paper we try to investigate the properties of this relationship in order to evaluate the reusable functions in existing software programs. Here we use Java programming language as the testing language, and make use of call-graph analysis technique, which is a new application for traditional static program analysis techniques. From the empirical analysis, we have found that the call-graph generated from software programs exhibited the properties both in scale-free network and small-world network: the distributions of in-degree and out-degree follow the low-power; a few nodes cover most of connections; and the call- graph shows large clustering and small characteristic path length. According to scale-free network and small- world network, we can differentiate the business methods and supportive methods in software programs. More precisely, those methods with high out-degree provide high-level business functions; and those with high in-de- gree provide low-level supportive functions. Based on this conclusion, developer can select appropriate functions to reuse. Especially in SOA context, those methods with high out-degree, about 20% of total methods, should be extracted as services first of all; and those methods with high in-degree, about 13% of total methods, should also be extracted as atomic services to compose complex services. Further, this connectivity may also be used as a measurement to evaluate reusage quality of different methods, which also provide strong supportive information to reuse of existing programs.
We plan to continue to study the reason why the software programs present such properties in scale-free network and small-world network. Also we want to explore how to expose and package these methods with strong connectivity as reusable services, because as programming paradigms move, we need to expose these services into new form factors too. We would also like to understand if we can use these properties to measure the quality of the design and software programs.
References
- Heckel, R., Correia, R., Matos, C., EI-Ramly, M., Koutsoukos, G. and Andrade, L. (2008) Software Evolution. Chapter Architectual Transformations: From Legacy to Three-Tier and Service, Springer, Berlin, 139-170.
- Papazoglou, M., Traverso, P., Dustdar, S. and Leymann, F. (2007) Service-Oriented Computing: State of the Art and Research Challenges. Computer, 40, 38-45. http://dx.doi.org/10.1109/MC.2007.400
- Khadka, R., Saeidi, A., Idu, A., Hage, J. and Jansen, S. (2012) Legacy to SOA Evolution-A Systematic Literature Review. In: Ionita, A.D., Litoiu, M. and Lewis, G., Eds., Migrating Legacy Applications: Challenges in Service Oriented Architecture and Cloud Computing Environments, IGI Global, 40-71.
- Binkley, D. (2007) Source Code Analysis: A Roadmap. 2007 Future of Software Engineering, Minnesota, 23-25 May 2007, 104-119.
- Ali, K. and Lhoták, O. (2012) Application-Only Call Graph Construction. Proceedings of the 26th European conference on Object-Oriented Programming, Beijing, 11-16 June 2012, 688-712. http://dx.doi.org/10.1007/978-3-642-31057-7_30
- Dean, J., Grove, D. and Chambers, C. (1995) Optimization of Object-Oriented Programs Using Static Class Hierarchy Analysis. Proceedings of the 9th European Conference on Object-Oriented Programming (ECOOP'95), arhus Denmark, 7-11 August 1995, 77-101.
- JBPM. http://www.jboss.com/products/jbpm
- SableCC. http://www.sable.mcgill.ca/software/
- JUNG. http://jung.sourceforge.net/index.html
- JGraph. http://www.jgraph.com/
- Azureus. http://sourceforge.net/projects/azureus/
- Apache James. http://james.apache.org/download.cgi
- Java Pet Store. http://java.sun.com/developer/releases/petstore/
- Damls Matcher. http://kbs.cs.tu-berlin.de/ivs/Projekte/damlsmatcher/download.html
- JTB. http://compilers.cs.ucla.edu/jtb/
- LGMA. http://121.37.58.35:8080/LGMA.jar
- WALA. http://wala.sourceforge.net/wiki/index.php/Main_Page
- Rosen, K.H. (2000) Handbook of Discrete and Combinatorial Mathematics. CRC Press, Boca Raton.
- Barabási, A.L. and Albert, R. (1999) Emergence of Scaling in Random Networks. Science, 286, 509-512. http://dx.doi.org/10.1126/science.286.5439.509
- Baccaletti, S., Latora, V., Moreno, Y., Chavezf, M. and Hwanga, D. (2006) Complex Networks: Structure and Dynamics. Physics Reports, 424, 175-308. http://dx.doi.org/10.1016/j.physrep.2005.10.009
- Milgram, S. (1967) The Small World Problem. Psychology Today, 1, 61-67.
- Watts, D.J. and Strogatz, S.H. (1998) Collective Dynamics of “Small-World” Networks. Nature, 393, 440-442. http://dx.doi.org/10.1038/30918
- Brin, S. and Page, L. (1998) The Anatomy of a Large-Scale Hypertextual Web Search Engine. In: Seventh International World-Wide Web Conference (WWW 1998), Brisbane, 14-18 April 1998, 107-117.
- Karp, P.D., Riley, M., Saier, M., Paulsen, I.T., Paley, S.M. and Pellegrini-Toole, A. (2000) The EcoCyc and MetaCyc Databases. Nucleic Acids Research, 28, 56-59. http://dx.doi.org/10.1093/nar/28.1.56
- Wasserman, S. and Faust, K. (1994) Social Network Analysis: Methods and Applications. Cambridge University, Cambridge.
- Broder, A., Kumar, R., Maghoul, F., Raghavan, P., Rajagopalan, S., Stata, R., et al. (2000) Graph Structure in the Web. Computer Networks, 33, 309-320. http://dx.doi.org/10.1016/S1389-1286(00)00083-9
- de Moura, A.P.S., Lai, Y.C. and Motter, A.E. (2003) Signatures of Small-World and Scale-Free Properties in Large Computer Programs. Physical Review E, 68, Article ID: 017102.