Journal of Biomedical Science and Engineering
Vol.6 No.8(2013), Article ID:35434,8 pages DOI:10.4236/jbise.2013.68096
Predictive models of ethanol concentrations in simulated exhaled breath and exhaled breath condensate under varied sampling conditions
![]()
Department of Agricultural and Biological Engineering, University of Illinois at Urbana-Champaign, Urbana, USA
Email: gdanao@illinois.edu
Copyright © 2013 Shih-Fang Chen, Mary-Grace C. Danao. This is an open access article distributed under the Creative Commons Attribution License, which permits unrestricted use, distribution, and reproduction in any medium, provided the original work is properly cited.
Received 25 June 2013; revised 26 July 2013; accepted 30 July 2013
Keywords: Simulated Breath; Exhaled Breath Condensate; Ethanol; Modeling
ABSTRACT
Breath monitoring is a non-invasive, safe, and repeatable approach to determining the respiratory, gastrointestinal, and general health status of humans and other mammals. Breath samples could be detected in two ways—directly sensing exhaled breath (EB) or chilling the EB to obtaining the exhaled breath condensate (EBC). Each has its advantages and disadvantages but they are both affected by different sampling conditions. The dearth of information on how sampling conditions affect the intrinsic properties of biomarkers in breath hinders the use of breath monitoring in clinical use. In this study, ethanol, a potential biomarker of liver function, was chosen as a model biomarker to demonstrate the effect of sampling conditions on different phases and how breath sampling could be standardized by developing predictive models. EB and EBC samples were determined under three simulated breath temperatures, two breath rates, and two condensing temperatures for developing predictive models. Results showed EB samples were affected by breath temperatures and EBC samples were affected by condensing temperatures. Flow rate changes did not have a significant influence on both EB and EBC samples. Final predictive models based on 5 minute sensing time were developed for EB (R2 = 0.8261) and EBC (R2 = 0.9471).
1. INTRODUCTION
Exhaled breath contains hundreds of metabolic products that may be biomarkers of animal well-being, physiological and enzyme reactions, and the onset of disease.
Compared to clinical blood and urine tests, breath monitoring offers several advantages—it is noninvasive, offers a low risk of infection, repeatable, and convenient for long-term clinical monitoring. Breath monitoring is carried out by sensing exhaled breath (EB) in the gas phase directly or passing the EB through a chilled condenser to obtain the exhaled breath condensate (EBC) sample in aqueous phase for further sensing. EB represents the first-hand information in breath and avoids further dilution by water vapor, but it has the difficulties in storage. Hence, immediate sensing is necessary for preventing possible decomposition or contamination reaction. In terms of EBC, researchers have argued that EBC provides better storage options and off-line detection than EB, because both non-volatile organic compounds (non-VOCs) and water-soluble volatile organic compounds (VOCs) are more stable in liquid phase. EBC usually preserves non-VOCs and water-soluble VOCs at trace concentrations, nmol/l to pmol/l (ppbv to pptv) [1]. In clinical studies, 1 - 3 ml of EBC is collected from patients, which takes, on average, 10 - 30 minutes of sampling time [2]. The long sampling time impedes practical application for clinical diagnosis. Generally, a preconcentration step is needed to reach the detection limit of the instrument by removing excess water vapor in the breath sample. Solid-phase extraction (SPE), solid-phase microextraction (SPME) or direct cryofocusing are widely used preconcentration techniques in EBC detection [3,4].
In general, factors that could influence breath biomarker concentrations can be classified into three categories—conditions of subject, sampling conditions, and post analytical processes. Conditions of subject include temperature and pH of airway lining fluid, breathing rate, contamination by upper airways and mouth, and intrasubject diurnal activities [5,6]. Temperature and pH lead to changes in intrinsic properties of biomarkers, such as its volatility and solubility [7]. Bell and Flack [8,9] reported breath alcohol levels can vary with EB temperatures. Reinhold et al. [10] measured breath pH and carbon dioxide levels and found them to be affected by airflow rate during EBC collection. Schleiss et al. [11] noted hydrogen peroxide concentrations were also flowdependent, while others reported malondialdehyde and adenosine levels in breath were flow-independent [12, 13].
Sampling conditions are related to condensing temperatures, collection device materials, collection time, dilution, pH of EBC, contamination from ambient air, and cross reactions in EBC matrix [5-7]. Horváth et al. [1] found that lower condensing temperatures stabilized unstable mediators, such as leukotrienes and purines, and the solubility of ammonia was proportional to the sampling temperature. Higher acetone concentrations were found in condensate when a lower condensing temperature (−50˚C, −20˚C, and 0˚C) was applied [14]. For varied sampling times (3 - 20 min), no significant difference was found between pH, concentrations of H2O2, 8-isoprostane,adenosine, nitrite/nitrate, and malondialdehyde [1,15]. Post analytical processes cover possible pretreatment procedure (e.g. preconcentration, separation), reference standard using in quantification device (e.g. mass spectrometry), and validation method [5].
The objectives of this study were to determine the effects of varied sampling conditions, such as breath temperatures, flow rates and condensing temperatures, in EB and EBC sensing and to develop the predictive models. Ethanol was chosen as the model biomarker in this study. Ethanol levels in breath are associated with intake of carbohydrate (e.g., glucose) and overgrowth of bacteria or yeast in the digestive system. Ethanol and acetone are also presumed biomarkers to determine blood glucose level [16]. Risby [17] and Cope et al. [18] determined that the regulation of gut bacteria and obesity in mice were correlated to breath ethanol.
2. MATERIALS AND METHOD
2.1. Reagents
Alcohol oxidase (AOX, E.C. 1.1.3.13, 30 U/mg protein) from Pichiapastoris was purchased from Sigma Aldrich (St. Louis, MO). Bovine serum albumin (BSA, 96% w/w), glutaraldehyde (25% w/w), potassium phosphate monobasic, methanol (99.8% w/w) and ethanol (99.5% w/w) were of analytical reagent grade and purchased from Sigma-Aldrich (St. Louis, MO). Potassium phosphate buffer solutions (100 mM, pH 7.4) were prepared using deionized water and stored at 4˚C until use. Immediately before testing, ethanol solutions were prepared in potassium phosphate buffer solution to hold a neutral pH condition.
2.2. Breath Output Simulator
A breath output simulator (Figure 1) was designed and built to simulate the expiration of breath biomarkers [19]. A volume of compressed air was humidified by bubbling it through an aqueous solution containing one of the chosen biomarker. The humidified air exiting the bubbler was considered as the simulated exhaled breath.
Flow rate ( ) was manually controlled using a valve and measured using a shielded flow meter (GF-1260 and GF-1360, Gilmont, Barrington, IL). In general, exhaled breath flows through the trachea of a healthy person under laminar conditions and the Reynolds number is estimated to be around 1600 to 2000 [20,21]. The Reynolds
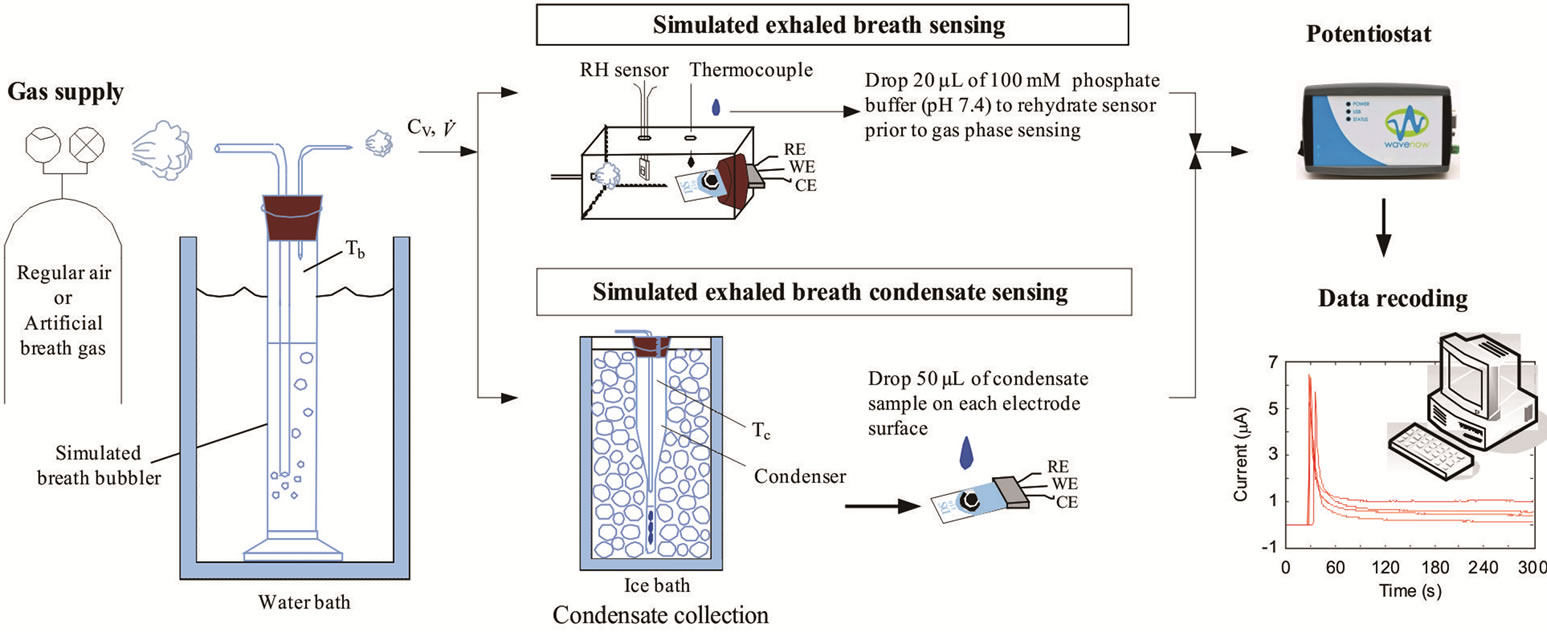
Figure 1. The breath output simulator was used to simulate exhaled breath by humidifying compressed air using an aqueous solution of a biomarker. The concentrations of the biomarkers in the simulated exhaled breath sample were measured amperometrically at the gas phase and condensed (liquid) using enzyme-coated electrodes.
number of the simulated exhaled breathin this study was set at 957 and 1833 to simulate laminar conditions for average, healthy individuals. The simulated breath was maintained at saturated conditions (>95% relative humidity) through the bubbler, which was monitored using a humidity sensor (HIH-4000, Honeywell Sensing and Control, Valley, MN). The bubbler was submerged in a water bath (Digital One, Thermo Scientific, Newington, NH) and the temperature (Tb) was adjustable to 295, 307, 310, and 315 K. The temperature of the humidified air was monitored using a datalogging thermometer (HH3 09A, MEGA Engineering, INC., Stamford, CT). These temperatures corresponded to room temperature, exhaled breath temperature from the mouth, blood and alveolar air temperature, and extremely high fever temperature that can cause brain damage [22-24]. The simulated exhaled breath either passed through a chamber for vapor phase sensing or was delivered to a condenser to cool it down to 274 K or 256 K in an ice bath. The latter condition was achieved using a condenser bath containing 1:8 weight ratio of sodium chloride and ice mixture. Sodium chloride was purchased from Sigma-Aldrich (St. Louis, MO). The condensate was collected in 10 minutes to obtain 105 - 700 μl samples depending on the simulated exhaled breath temperature. Aqueous solutions of ethanol were prepared to deliver 4, 5, and 7.5 ppm of ethanol vapor in the simulated breath output of the bubbler.
2.3. Henry’s Law
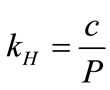
The vapor concentrations of the biomarkers in the simulated exhaled breath can be calculated using Henry’s law. Henry’s law describes the solubility of a compound at a constant temperature. The amount of gas dissolved in an aqueous solution is directly proportional to the partial pressure of that gas in equilibrium with the aqueous solution:
 , (1)
, (1)
where kH is Henry’s law constant for a given solute (mol/L·atm); c is the concentration of the solute (mol/L); and P is the partial pressure of the solute in the gas above the solution (atm). kH is used for describing the solubility of the solute in water and it is related to the solute volatility,  , by
, by
 , (2)
, (2)
where xa is the molar mixing ratio in aqueous phase;  is the density of water;
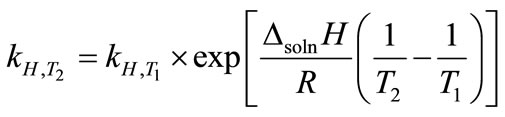
  is the molar mass of water. When applying Henry’s law, certain assumptions need to be met for the compound to behave ideally and the chemical form is identical in both gas and aqueous phases [25]. Henry’s law constant kH also varies with temperature:
 , (3)
, (3)
where ∆soln H is the enthalpy of solution; R is the universal gas constant, 8.314 J/K×mol; T1 is the temperature under standard condition (298.15 K); and T2 is the sample temperature. From empirical results [26],  is 184 M/atm and
 is 6500 K at 298.15 K for ethanol, respectively. Based on the
  and
and 
 values, aqueous ethanol was prepared and used as stock solutions in the bubbler to produce expected amount of concentrations of biomarkers. The conversion between aqueous phase and gas phase were calculated under standard conditions (298.15 K, 1 atm).
2.4. Sensor Preparation and Amperometric Measurements
The Screen-printed carbon electrode (SPCE), DRP-410, purchased from Metrohm USA Inc. (Riverview, FL), was composed of three parts a carbon-based working electrode containing cobalt phthalocyanine (CoPC) (12.56 mm2) as electrochemical mediator, a counter electrode made of carbon paste (1.45 mm2), and a reference electrode (2.2 mm2 area) made of silver paste (Figure 2). AOX was immobilized on the cell by dropcoating a 2 μl aliquot of mixture containing 0.2 μl BSA (40 mg/ml), 0.6 μlglutaraldehyde (1.5% (v/v)) and 1.2 μl AOX (400 units/ml) on the working electrode of a CoPC SPCE. The mixture was allowed to dry for 2 to 2.5 h at room temperature. H2O2 was the byproduct from ethanol oxidation reaction and it was oxidized and measured through the oxidation of 2Co+ to Co2+ (Figure 2).
A portable USB potentiostat (WaveNow, Pine Research Instrumentation, Raleigh, NC) was used to meas-
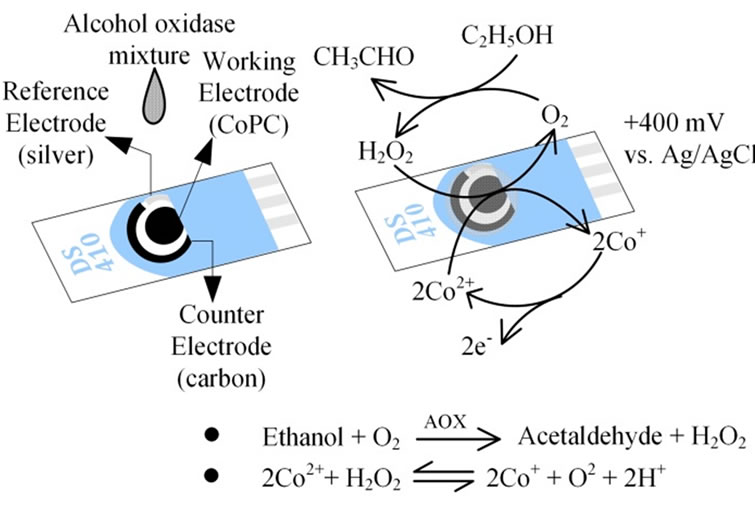
Figure 2. The sensor preparation and sensing process were involved dropcoating enzyme solutions on the working electrodes of the screen printed carbon electrodes.
ure the redox reaction occurring on the sensor surface. In preliminary tests, H2O2 showed a cathodic (reduced) peak around +400 mV vs. Ag (reference electrode), resulting in a linear response to increasing concentrations (Figure 3). For vapor phase measurements, the electrode was exposed to ambient air for a period of 30 s prior to coating the electrode with 20 μl of 100 mM potassium phosphate buffer. After an additional 30 s, the electrode was inserted into the sensing chamber and the amperometric response for the simulated exhaled breath sample was recorded in 10 min. Similarly, for condensate phase measurements, the electrode was exposed to ambient air for 30 s prior to coating the electrode with 50 μl of condensate sample. The signal was processed according to the procedure described earlier by Chen and Danao [19].
2.5. Predictive Model Selection
Current responses were determined to be a function of biomarker’s concentration from source and sampling condition variables (Equation (4)).
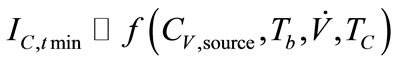 , (4)
, (4)
initial models, which included each sampling parameters and the two-way interaction terms, were tested through a model selection process using Akaike’s information criterion (AIC) or cross validation (CV). AIC, which was first published by Hirotsugu Akaike in 1974, is used for comparing nested model and provided a criterion to choose the best compromised model between the goodness of fit and the numbers of parameters included in the model based on the theories of maximum likelihood, information and entropy [27]. AIC is calculated as:
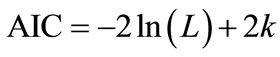 , (5)
, (5)
where L is the maximized likelihood of the estimated model; k is the number of parameters in the model. Cross validation, which was also one means of prediction error
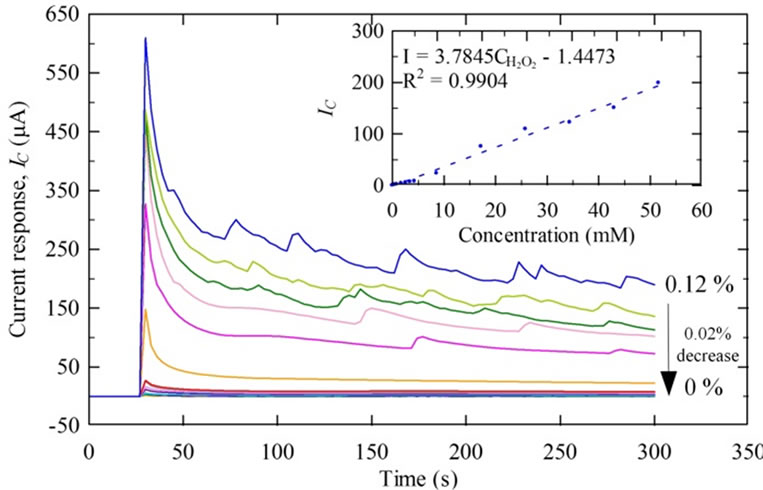
Figure 3. The amperometric response increased linearly with increasing levels of the byproduct, H2O2, from ethanol oxidation.
estimation, was carried out by the k-fold validation, which was also one means of prediction error estimation, was carried out by the k-fold cross validation. The original dataset was partitioned into k fold nearly equally and k = 10 was commonly used in the field of data mining [28]. (k − 1) fold was randomly chosen in a certain times of iterations to serve as a training set to develop a predictive model and the remaining one fold was used as a test set for validating the predictive model. In each iteration, the sum of mean squared error in the test set was calculated. By comparing the values, the model with a minimum sum of mean squared error was pursued further in developing the predictive models.
Models selected by AIC and CV were subjected to a multifactor analysis of variance (or factorial ANOVA) that contained factors of vapor concentrations of ethanol (CV, ppm), temperatures of the simulated exhaled breath from the bubbler (Tb, K), breath rates ( , liter per minute (LPM)), condensing temperatures (Tc, K) in condensate sensing. In each case, three replications were taken in each test. The sensing duration was 5 minutes. All the statistical analyses were computed in R environment (version 2.11). The final predictive models were chosen in consideration of a shorter sensing duration and a bigger R2 (Figure 4).
3. RESULTS AND DISCUSSION
3.1. Breath Temperatures (Tb)
Current measurements due to ethanol vapor and condensate typically increased linearly as CV increased (Figure
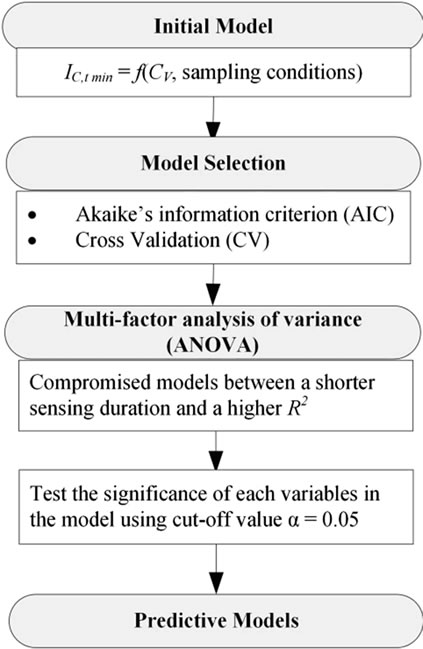
Figure 4. Compromised models between the goodness of fit and the numbers of parameters included in predictive models were chosen through AIC and CV model selection processes.
5). Flow rate in this test was set at 3.438 LPM (Reynolds number = 957) and the condensing temperature was 274 K. Three replications were measured for each condition of vapor and condensate samples. One replication was conducted for stock solution. Error bars and dashed lines represent ± one standard error (S.E) and linear regression results, respectively. In general, the higher the Tb, the lower the current response derived for the same CV. The results were possibly due to further water condensation with increasing Tb. Moreover, higher current responses were found in the results from 10 min sensing duration compared to 5 min sensing duration for vapor samples, but the effect was notseen with condensate samples. Additionally, current responses for condensate samples were higher than the current responses for vapor and stock solution after 5 min of sensing (Figure 5). When the sensing time was extended to 10 min, vapor samples had the highest current responses, followed by condensate and stock solution, respectively.
Ethanol molecules in the vapor were present as aerosol particles that randomly deposited on the sensor surface. As sensing duration increased, the chances of aerosol deposition increased. With the condensate sample, the composition was fixed after collection by directly drop-
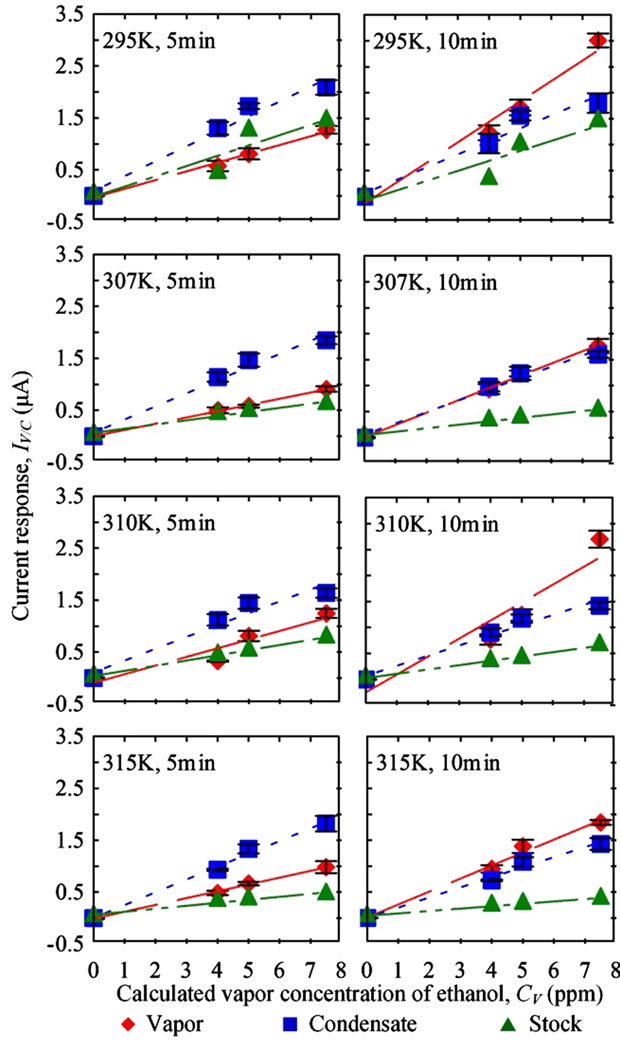
Figure 5. Current measurements due to the level of ethanol present in vapor, condensate, and stock solution samples were affected by sensing durations.
coating the sensor with the condensate sample. Hence, a shorter sensing duration was needed in condensate sensing.
The current responses for the stock solution were lower than those for vapor and condensate samples. Since the boiling point of ethanol is 78.4˚C, which is lower than the boiling point of water and water-based solvents (100˚C), ethanol readily evaporated in the bubbler than water and higher levels of ethanol were detected in both vapor and condensate samples.
3.2. Breath Rates ( )
)
The breath temperature in this test was set at 310 K and the condensing temperature was 274 K. Whether the sensing durations or flow rate changed, current responses presented comparable values in condensate samples. Although higher current responses were measured at the higher flow rate for vapor samples (Figure 6), but the responses were not statistically different (p5 min = 0.355, p10 min = 0.518).
3.3. Condensing Temperatures (TC)
The breath temperature in this test was set at 310 K and the flow rate in this test was set at 3.438 LPM (Reynolds number = 957). In condensate sensing, lower current responses were measured for samples collected from lower condensing temperature at TC = 256 K (−17˚C) (Figure 7). The melting point of ethanol is −114˚C which is much lower than 0˚C, the melting point of water. Therefore more water was condensed than ethanol and a diluted sample was collected. However, no statistically signifi-
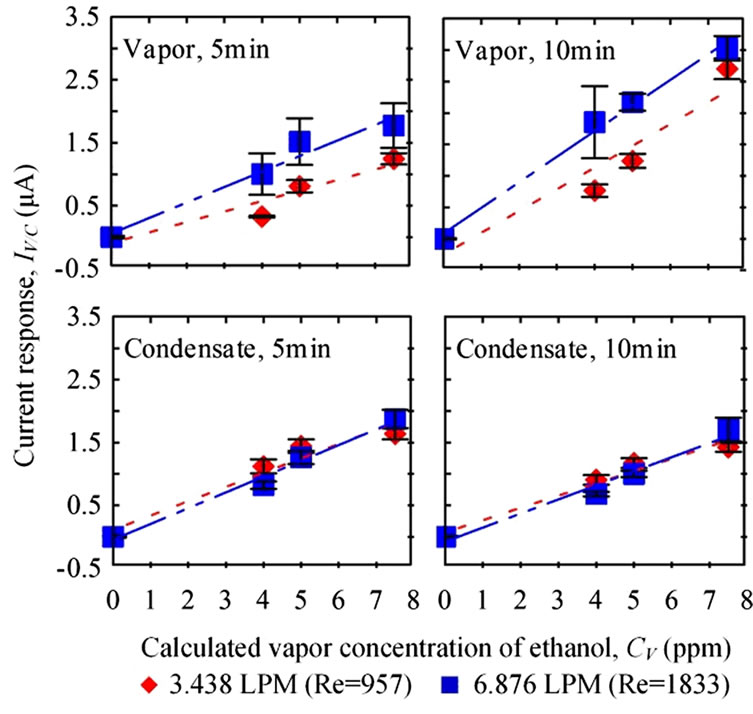
Figure 6. Current measurements due to the level of ethanol present in vapor and condensate samples were compared with changing flow rate in 5 min or 10 min sensing.
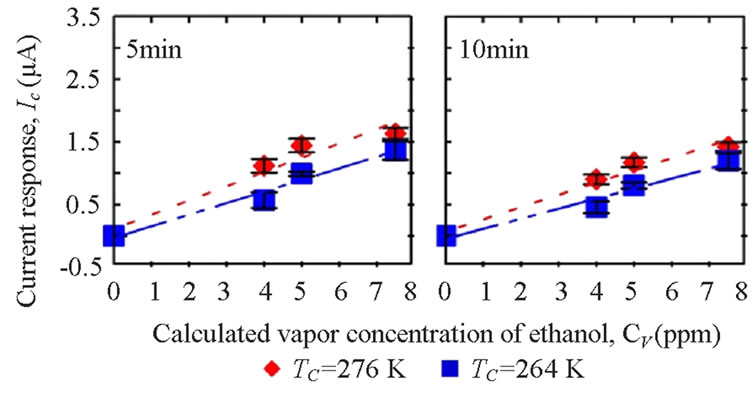
Figure 7. Condensate sampled from TC = 256 K had a lower current response than it sampled from TC = 274 K.
cant difference was found (p5 min = 0.522, p10 min = 0.540).
3.4. Predictive Model Development
Breath sampling and measurement could be viewed as a three-part process (Figure 8). First, the breath output simulator produced the selected concentrations of ethanol in the simulated breath, CV,source, that were estimated from Henry’s law. CV,source, could be expressed as a function of Henry’s law constant,  , and the partial pressure of the solute in the gas above the solution, P.
  is a function of
 ,
,  , and
, and  (Equation (3)). Since
  and
and  are empirical values from previous studies (Sandy, 1999),
  could be simplified to be the function of
  only while P is directly proportional to flow rate
 . Consequently, CV,source is expressed as
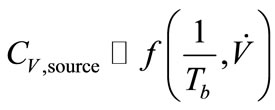 , (6)
, (6)
secondly, the sampling conditions, which are of great importance for solubility of biomarkers, were affected by the concentrations ( ) and the temperature (Tb) of samples from the source. Tb was found to have a negative correlation with sample concentration (CC,sample). Ahigher flow rate (
 ) resulted in a higher pressure that increased the solubility of the sample in general. A direct proportion was assumed between
  and CC,sample. The temperature drop (∆T) between the simulated breath and the vapor sensing chamber in vapor sampling, and the condensing temperature (TC) also contributed to
  by the varying condensing conditions. Large ∆T favored water vapor condensation and caused further dilution to
 . Hence, ∆T was inversely proportional to
 . Accordingly, the functions of CV/C,sample were derived as.
Vapor: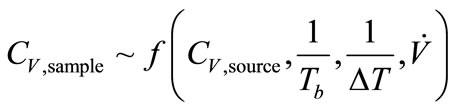 , (7)
, (7)
Condensate: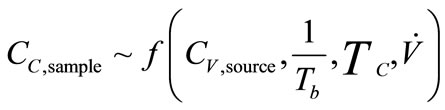 , (8)
, (8)
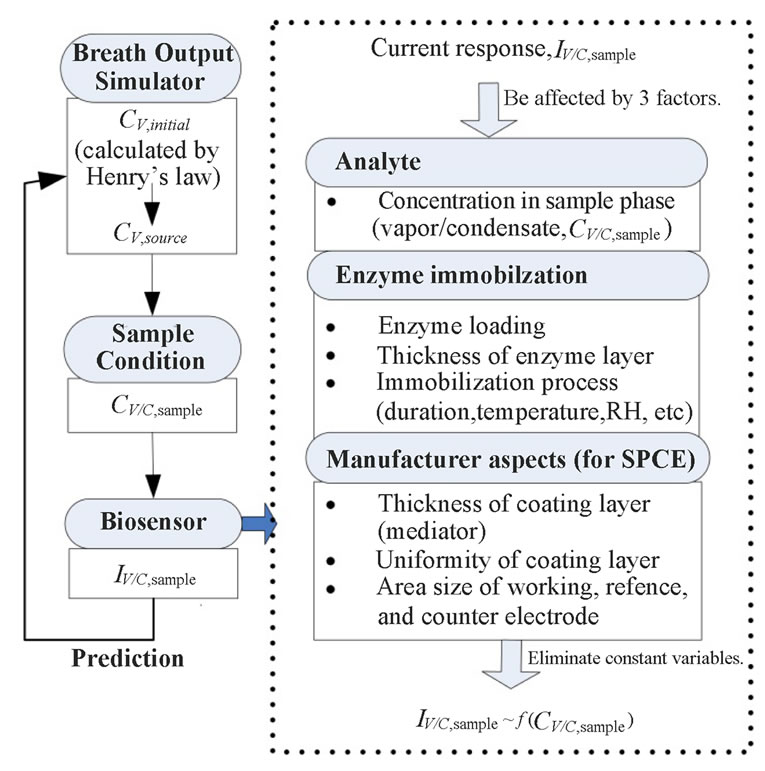
Figure 8. Concept diagram of predictive model development presents sampling and sensing system could be broken down into three subsystems.
Lastly, in consideration of sensing system (mainly biosensors), output signals were directly proportional to concentrations of the analyte. When an enzyme was involved in the reaction, it was necessary to control the effect of enzyme loading, enzyme kinetics, the thickness of enzyme layers (a key factor in the rate of mass transfer), and the conditions of enzyme immobilization processes that affect the retention of enzymatic activity. Furthermore, manufacturing errors—the uniformity of the sensor coating (e.g. the percentage of each reagent element in the paste), the thickness of the layer, and the size of reaction area were possible sources of signal noise and instability of the amperometric signals fromthe SPCEs. In this project, errors due to enzymeimmobilization and electrode were minimized by preparing all biosensors similarly. The SPCE from Metrohm USA Inc. (Riverview, FL) were assumed to hold a good uniformity. As a result, sensor responses which were current responses, IC,sample, were only affected by the concentrations of the collectedsamples CC,sample:
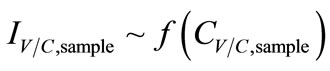 , (9)
, (9)
Final models (Table 1) were developed for specific sensing time in 5 min and the full sensing duration in 3 - 10 min. In specific sensing time (5 min), Ethanol concentrations in EB samples were only affected by the Tb negatively. For EBC samples, only TC had significantly positive influence on the concentrations and the changes of Tb and  were not made significant differences. For full time (3 - 10 min) models, additional parameters and interaction terms were included in the models to better
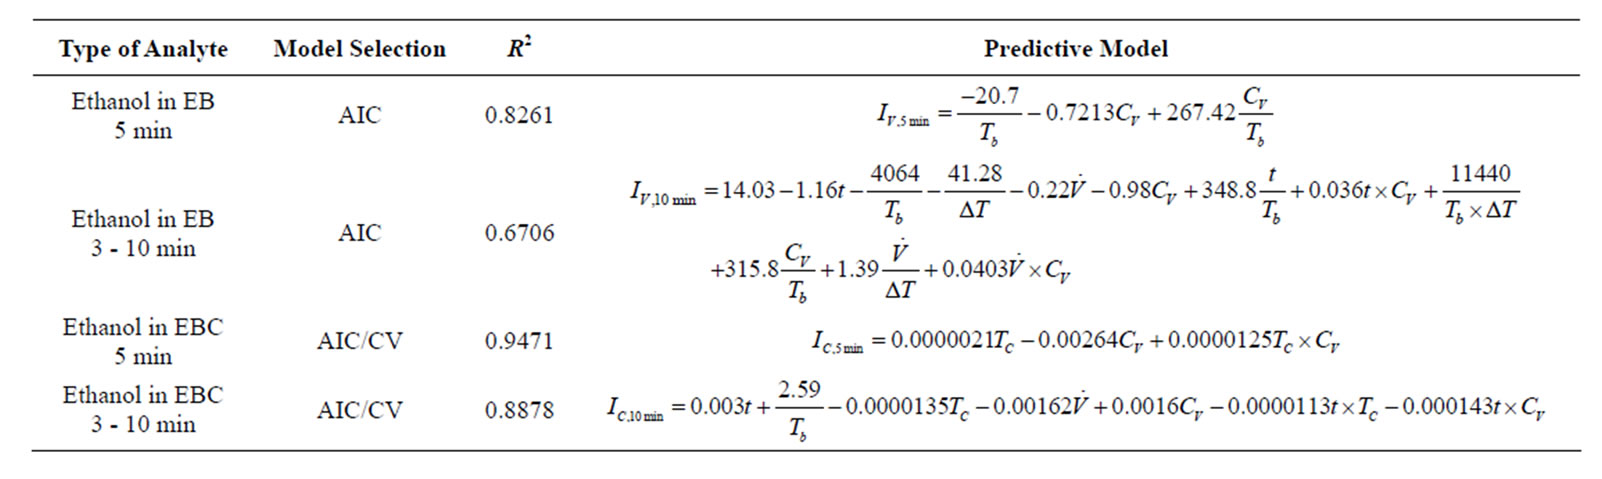
Table 1. Predictive models for EB and EBC.
explain the change of current response with different time period Higher complexities in full time models resulted in lower R2 values (R2 = 0.6706 in ethanol EB, 0.8878 in ethanol EBC) compared to models based on specific sensing times (R2= 0.8261 in ethanol EB, 0.9471 in ethanol EBC). In addition, EB models were less accurate than the EBC models, respectively. It also demonstrated that vapor sensing was more unstable and more challenging than condensate sensing.
4. CONCLUSION
Ethanol can be successfully detected by using a mediated SPCE and cooperating with immobilized alcohol oxidase in amperometric measurements. Three sampling conditions—breath temperatures, breath rates and condensing temperatures were tested. In both EB and EBC, the concentration of collected ethanol samples were more concentrated than the concentration from the source because the boiling point of ethanol was lower than that of water in the breather and was easier to vaporize. Higher Tb and lower TC had lower current responses, which indicated less concentration of ethanol was detected, due to the water vaporization and condensation. Increasing flow rate and sensing duration did not significantly affect the ethanol concentration in condensate, but increased the ethanol concentration in vapor sensing. Higher regression results were shown in EBC predictive models (R2 = 0.9471 in 5 min and R2 = 0.8878 in full time) than EB predictive models (R2 = 0.8261 in 5 min and R2 = 0.6706 in full time).
5. ACKNOWLEDGEMENTS
This work was supported by NIFA (HATCH) Project No. ILLU-741- 314 “Monitoring the health of livestock via breath analysis: development of sampling and sensor array technologies.”
REFERENCES
- Horváth, I., Hunt J. and Barnes, P.J. (2005) Exhaled breath condensate: Methodological recommendations and unresolved questions. European Respiratory Journal, 26, 523-548. doi:10.1183/09031936.05.00029705
- Grob, N.M., Aytekin M. and Dweik R.A. (2008) Biomarkers in exhaled breath condensate: A review of collection, processing and analysis. Journal of Breath Research, 2, 037004. doi:10.1088/1752-7155/2/3/037004
- Knutson, M.D. and Viteri F.E. (1996) Concentrating breath samples using liquid nitrogen: A reliable method for the simultaneous determination of ethane and pentane. Analytical Biochemistry, 242, 129-135. doi:10.1006/abio.1996.0438
- Grote, C. and Pawliszyn, J. (1997) Solid-phase microextraction for the analysis of human breath. Analytical Chemistry,69, 587-596. doi:10.1021/ac960749l
- Montusch, P. (2007) Analysis of exhaled breath condensate in respiratory medicine: Methodological aspects and potential clinical applications. Therapeutic Advances in Respiratory Disease, 1, 5-23. doi:10.1177/1753465807082373
- Chapman, E.A., Thomas, P.S. and Yates, D.H. (2010) Breath analysis in asbestos-related disorders: A review of the literature and potential future applications. Journal of Breath Research, 4, 034001. doi:10.1088/1752-7155/4/3/034001
- Hunt, J. (2007) Exhaled breath condensate pH assays. Immunology and Allergy Clinics of North America, 27, 597-606. doi:10.1016/j.iac.2007.09.006
- Bell, C.M. and Flack, H.J. (1995) Examining variables associated with sampling for breath alcohol analysis. http://www.druglibrary.org/schaffer/misc/driving/s5p3.htm
- Bell, C.M. and Flack, H.J. (1995) Development of a system for real-time breath alcohol analysis. http://www.druglibrary.org/schaffer/misc/driving/s30p16.htm
- Reinhold, P., Jaeger J. and Schroeder, C. (2006) Evaluation of methodological and biological influences on the collection and composition of exhaled breath condensate. Biomarkers, 11, 118-142. doi:10.1080/13547500600572764
- Schleiss, M.B., Holz, O., Behnke, M., Richter, K., Magnussen H. and Jörres, R.A. (2000) The concentration of hydrogen peroxide in exhaled air depends on expiratory flow rate. European Respiratory Journal, 16, 1115-1118. doi:10.1034/j.1399-3003.2000.16f16.x
- Huszár, É., et al. (2002) Adenosine in exhaled breath condensate in healthy volunteers and in patients with asthma. European Respiratory Journal, 20, 1393-1398. doi:10.1183/09031936.02.00005002
- Corradi, M., et al. (2003) Aldehydes and glutathione in exhaled breath condensate of children with asthma exacerbation. American Journal of Respiratory and Critical Care Medicine, 167, 395-399. doi:10.1164/rccm.200206-507OC
- Loyola, B.R., Bhushan, A., Schivo, M., Kenyon, N.J. and Davis, C.E. (2008) Temperature changes in exhaled breath condensate collection devices affect observed acetone concentrations. Journal of Breath Research, 2, 037005. doi:10.1088/1752-7155/2/3/037005
- Vaughan, J., et al. (2003) Exhaled breath condensate pH is a robust and reproducible assay of airway acidity. European Respiratory Journal, 22, 889-894. doi:10.1183/09031936.03.00038803
- Galassetti, P.R., et al. (2005) Breath ethanol and acetone as indicators of serum glucose levels: An initial report. Diabetes Technology & Therapeutics, 7, 115-123. doi:10.1089/dia.2005.7.115
- Risby, T.H. (2001) Chapter 3: Volatile organic compounds as markers in normal and diseases states. In: Marczin, N. and Yacoub, M.H., Eds., Disease Markers in Exhaled Breath: Basic Mechanisms and Clinical Applications, NATO ASI Series, IOS Press, Amsterdam, 113-122.
- Cope, K., Risby, T. and Diehl, A.M. (2000) Increased gastrointestinal ethanol production in obese mice: Implications for fatty liver disease pathogenesis. Gastroenterology, 119, 1340-1347. doi:10.1053/gast.2000.19267
- Chen, S.F. and Danao, M.C. (2010) Modeling the effects of exhaled breath condensate collection conditions on biomarker concentrations. 2010 American Society of Agricultural and Biological Engineers Annual International Meeting, Pittsburgh, 20-23 June 2010, 1009286.
- Chang, H.K. and Mortola, J.P. (1981) Fluid dynamic factors in tracheal pressure measurement. Journal of Applied Physiology, 51, 218-225.
- Ultman, J.S. (1985) Gas transport in the conducting airway. In: Engel, L.A. and Paiva, M., Eds., Gas Mixing and Distribution in the Lung. Marcel Dekker Inc., New York, 63-136.
- Begg, T.B., Hill, I.D. and Nickolls, L.C. (1964) Breathalyzer and Kitagawa-Wright methods of measuring breath alcohol. British Medical Journal, 1, 9-15. doi:10.1136/bmj.1.5374.9
- Jones, A.W. (1982) Effects of temperature and humidity of inhaled air on the concentration of ethanol in a man’s exhaled breath. Clinical Science, 63, 441-445.
- Yamamoto, K. and Ueda, M. (1972) Studies on breath alcohol analysis for the estimation of blood alcohol levels. Forensic science, 1, 207-224. doi:10.1016/0300-9432(72)90044-1
- Huang, D. and Chen, Z. (2010) Reinvestigation of the Henry’s law constant for hydrogen peroxide with temperature and acidity variation. Journal of Environmental Sciences, 22, 570-574. doi:10.1016/S1001-0742(09)60147-9
- Sander, R. (1999) Compilation of Henry’s law constants for inorganic and organic species of potential importance in environmental chemistry (Version 3). http://www.henrys-law.org
- Motulsky, H. and Christopoulos, A. (2004) Fitting models to biological data using linear and nonlinear regression: A practical guide to curve fitting. Oxford University Press, New York.
- Refaeilzadeh, P., Tang, L. and Liu, H. (2009) Cross-valid ation. In: Liu, L. and Ozsu, M., Eds., Encyclopedia of Database Systems. Springer, New York, 532-538. doi:10.1007/SpringerReference_63669