Journal of Biomedical Science and Engineering
Vol.6 No.5(2013), Article ID:31531,6 pages DOI:10.4236/jbise.2013.65067
Controlling the rate of penetration of a therapeutic drug into the wall of an artery by means of a pressurized balloon
![]()
1School of Engineering, University of St. Thomas, St. Paul, USA
2Department of Mechanical Engineering, University of Minnesota, Minneapolis, USA
3Cardiovascular Systems, Inc., St. Paul, USA
Email: *jpabraham@stthomas.edu
Copyright © 2013 John R. Stark et al. This is an open access article distributed under the Creative Commons Attribution License, which permits unrestricted use, distribution, and reproduction in any medium, provided the original work is properly cited.
Received 23 February 2013; revised 5 April 2013; accepted 6 May 2013
Keywords: Heart Disease; Plaque Treatment; Paclitaxel; Drug Delivery
ABSTRACT
The focus of this paper is to propose, model, and characterize a means of accelerating the rate of delivery of therapeutic drugs to human tissues. The investigated means is a pressurized, permeable-walled balloon filled with a homogeneous mixture of the drug and the carrier fluid. The fluid mixture, driven by pressure, traverses the thickness of the balloon wall through laser-drilled pores. The number and deployment of the pores can be controlled to a high degree of precision. As a consequence, the wall of the balloon can be regarded as a homogeneous porous medium, and the traversing fluid flow can be analyzed by means of porous media models. When the balloon is in intimate contact with the surface of a tissue bed, the therapeutic fluid flows in series as it passes through the balloon wall and penetrates the tissue. The flow rate can be controlled by proper selection of the balloon permeability, the viscosity of the flowing medium, and the pressure internal to the balloon. The delivered concentration of the drug was predicted by coupling the present balloon-focused theory with a previously developed tissue-bed model that includes both diffusion and advection processes. The tribologic interaction of the pressurized balloon with an artery wall was investigated experimentally to assess the possible formation of aneurysms.
1. INTRODUCTION
The use of drugs and other medications as a follow-on to cardiovascular or other medical interventions is a widely accepted methodology. For example, it is now common practice to employ drug-coated stents to slow restenosis following angioplasty [1-8]. The transport pathway of the medication first involves mass transfer in the polymerdrug compound that coats the stent and subsequent diffusion of the drug into the tissue. A possible downside of this approach is the “wash out” phenomenon whereby blood flowing in the lumen may entrain drug from the artery wall or the exposed struts.
A basic insufficiency of medication delivery either by stent coating or by direct application to the artery wall is the absence of a means of accelerating the passage of the medication into the tissue. This realization gives rise to the focus of the present investigation. In the present approach, the drug, appropriately mixed with a carrier liquid, is contained at elevated pressure in an inflated, permeable-walled balloon. By proper design of the balloon permeability along with a logic-based choice of pressure, the rate of drug penetration into the tissue can be controlled. The means of permeability attainment and the relationship between permeability and pressure will be set forth in this paper.
A schematic representation of the physical situation is conveyed in Figure 1. As depicted there, a permeable balloon is put in place at a lumen location where drug application is to be applied. When inflated with a suitable mixture of drug and carrier liquid, the balloon blocks the cross section of the lumen, thereby preventing the lumen blood flow from washing away the drug.
The pressure of the liquid mixture in the balloon can be varied over a suitable range, and this variation facilitates control of the rate at which the drug penetrates the adjacent tissue. The capability to control the rates of application and penetration of the drug is a unique feature of the device.
This paper presents the underlying theory of pressurized-balloon drug delivery and of the model by which the interacting diffusive and advective processes transport
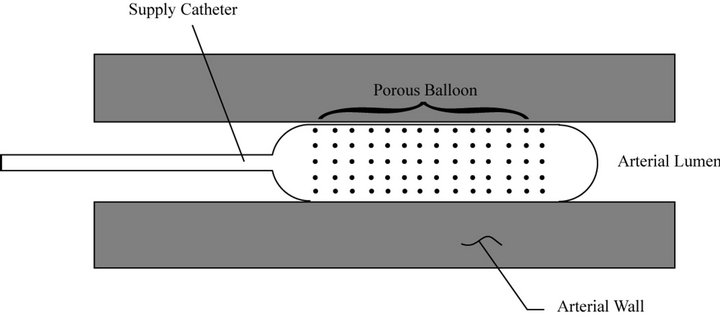
Figure 1. Schematic diagram of an inflated permeable balloon in place in a lumen.
the drug and the fluid carrier into the tissue.
2. MATHEMATICAL MODEL
2.1. Balloon Trans-Wall Fluid Flow
The rate at which liquid medication is transferred from the permeable-walled balloon to the surrounding tissue is controlled by the pressure in the balloon and by the fluid-flow resistances of the balloon wall and the tissue bed. It is convenient to deal separately with the flow characteristics of the respective regions and then to bring them together to form an integrated model.
The balloon trans-wall fluid flow is modeled as permeation through a porous medium. Analysis of the transwall flow is aided by referring to Figure 2 which shows the balloon wall as an annulus bounded by an inner radius Rbi and an outer radius Rbo. The radial coordinate is r.
If the viscosity of the flowing liquid is µ, and the permeability of the balloon wall is κb, the fluid flow in the wall of the balloon is governed by Darcy’s Law
 (1)
(1)
in which dp/dr is the radial pressure gradient, and V is the superficial velocity. That velocity is a fictive quantity related to the actual pore velocity v by the equation v = V/ε, where ε is the porosity. The volumetric flowrate Q that passes radially outward through an area 2πrL is
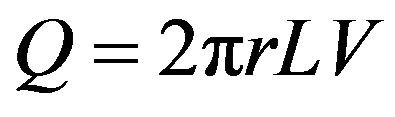 (2)
(2)
where Rbi ≤ r ≤ Rbo, and L is the axial length of the balloon. Elimination of V between Equations (1) and (2) leads to, after integration between r = Rbi and Rbo,
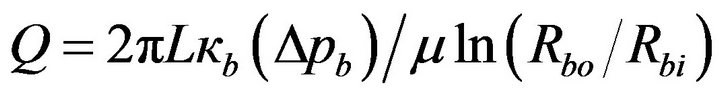 (3)
(3)
where Δpb is the pressure drop across the wall thickness of the balloon, This equation for Q corresponds to a
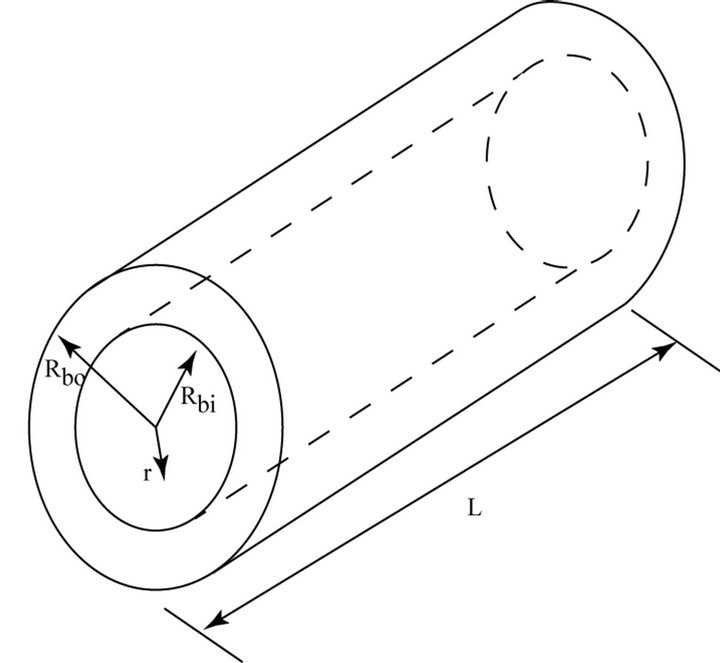
Figure 2. Schematic diagram for analysis of permeation through the wall of the balloon.
model which is focused on the entirety of the balloon wall, spanning its thickness and length.
Another approach, equally valid, is to focus attention on a single pore. In this approach, the balloon wall is regarded as a homogeneous assemblage of equally spaced circular pores having a common diameter D. This configuration is readily achieved by laser machining. The manufacturing method allows the creation of permeabilities of almost arbitrary value. Each pore diameter is very small compared with the balloon wall thickness. From this viewpoint, each pore may be regarded as a tube carrying a laminar flow. The volumetric flow for fully developed laminar flow in a tube is given by the Poiseuille formula
 (4)
(4)
where C is a constant. If Poiseuille’s law were precisely valid, the constant C would be known a priori. However, the pore length-to-diameter ratio is unknown, so that the Poiseuille-law value of C may not be strictly valid for the present situation. Its value will be determined shortly.
Since the pressure variation of the permeating flow is linear, it is permissible to approximate dp/dr as Δpb/t, where t represents the wall thickness (Rbo – Rbi). Then, the elimination of Δpb between Equations (3) and (4) leads to
 (5)
(5)
where N is the number of pores. The value of the constant C was extracted by comparing Equation (5) to data from Advanced Polymer, Inc. (Carlstadt, NJ). The data consisted of experiments with pressurized balloons and measured elution rates. From these, C values were obtained. The comparison yielded C = 0.03, consistent with an experimental uncertainly of 15% in the measured hole diameters. Had the Poiseuille law been strictly applicable, the value of C would have been 0.0245.
Equation (5) can be regarded as a design tool which facilitates self-consistent choices of the dimensions of the balloon, the number of pores N, and the permeability κb.
2.2. Fluid Flow in Tissue
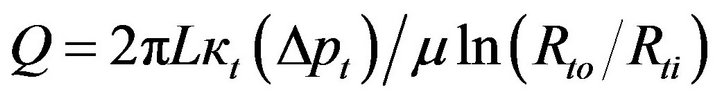
In contrast to the wall of the balloon, which is fabricated to accommodate specified dimensions and fluid flow characteristics, the tissue which receives the medication is characterized by natural properties. As a consequence, the analytical approach used in the foregoing is not fully applicable to fluid flow in the tissue. However, Equation (3) continues to apply with appropriate modifications. Because of mass conservation, the volumetric flow Q passing through the wall of the balloon is identical to that passing through the tissue under steady-state flow conditions. In order to make Equation (3) applicable to the tissue bed, it has to be rewritten as
 (6)
(6)
in which Δpt and κt are, respectively, the pressure drop across the tissue bed and the permeability of the tissue. In addition, Rto and Rti are the respective outer and inner radii of the tissue bed being considered, with Rti = Rbo. The permeability that appears in Equation (6) will be discussed later.
2.3. Continuity of Balloon and Tissue Fluid Flow
Since the fluid flows in series through the wall of the balloon and the tissue, it follows that
 (7)
(7)
The balloon-wall pressure drop Δpb follows from Equation (3) as
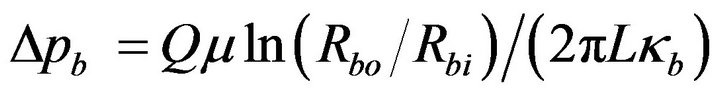 (8)
(8)
For the tissue-bed pressure drop, from Equation (6),
 (9)
(9)
when Δpb and Δpt are brought together in accordance with Equation (7), there follows
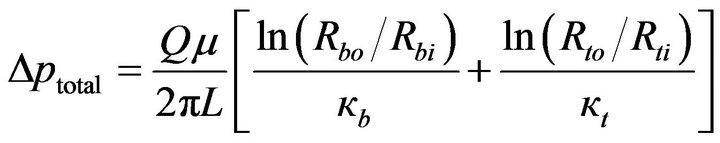 (10)
(10)
or
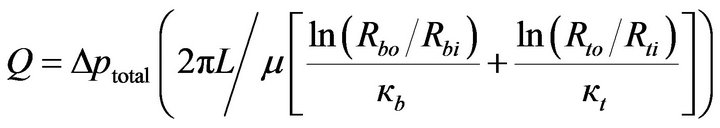 (11)
(11)
This equation can be interpreted as a fluid-flow Ohm’s law having the form
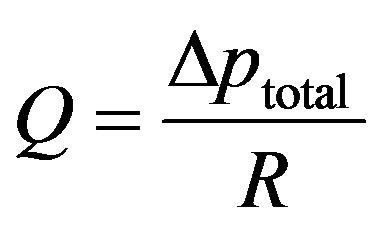 (12)
(12)
where
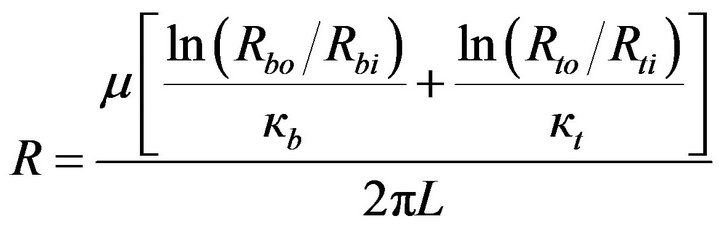 (13)
(13)
Inspection of Equation (13) indicates that the respecttive resistances of the balloon wall and of the tissue bed are inversely proportional to their permeabilities. Furthermore, the thicker the respective regions, the greater is their resistances. In what follows, a number of practical situations will be examined from the standpoint of which of the component resistances, balloon or tissue, dominates.
2.4. Impact of Balloon Permeability on Drug Delivery
To determine the in-artery-wall drug concentration distribution, models of drug diffusion plus carrier-fluid and drug advection in the artery wall are necessary. A number of models have appeared in the literature [9-16]. The individual models take account of different physical processes. The authors previous work [16] includes both advection and diffusion in the drug—carrier fluid mixture, diffusion of the drug in the arterial tissue, and binding of the drug to the tissue. It was found that the presence of an advecting flow significantly increased the deposition of medicine into the artery (by a factor of approximately 10).
The artery-wall calculations reported here were performed using the model of [16]. A key input for these calculations is the viscosity of the carrier fluid. For the sake of generality, two parametric viscosity values were considered, 0.0014 and 0.0047 kg/m·s, respectively designated as the low and high viscosities. On the basis of literature practice, the concentration of the drug at a depth of 0.5 mm beneath the lumen-tissue interface appears to be a critical benchmark location at which to assess therapeutic outcomes. Other conditions of the calculations are listed in Table 1. The outer radius was chosen to be large enough so that its presence did not impact the paclitaxel concentration near the artery [16].
The first set of results corresponds to a balloon pressure of three atmospheres relative to a datum pressure in the tissue at locations far removed from the lumen-tissue interface. For these results, the permeability Kb of the balloon is regarded as the independent variable. In considering these results, it is relevant to note that the higher the permeability of the balloon, the higher is its flow resistance and vice versa. The results exhibited in Table 2 correspond to the two viscosities identified in the foregoing and to two time durations of the therapeutic treatment (two and four minutes).
Inspection of the table shows that the balloon permeability is only moderately significant for the higher range of permeability values, 10–15 to 10–17 m2. For permeabilities lower then these values, the drug concentrations at the point of observation decrease markedly. It is interesting to observe that the impact of decreased permeabilities is considerably smaller in the case of the higher viscosity carrier fluid then for the lower viscosity fluid. This outcome can be attributed to the fact that the viscosity serves to control the resistance to fluid advection in the tissue bed. High viscosity corresponds to a high flow resistance, and conversely for low viscosity. Furthermore, the overall resistance to fluid flow is the sum of the resistances of the balloon wall and the tissue bed. The resistance associated with the higher viscosity tends to dominate the sum, thereby weakening the importance of the balloon wall permeability.
Further inspection of Table 2 shows that the combination of a low-viscosity carrier fluid and extended therapy duration gives rise to a significant increase of drug concentration compared to that which results from the use of
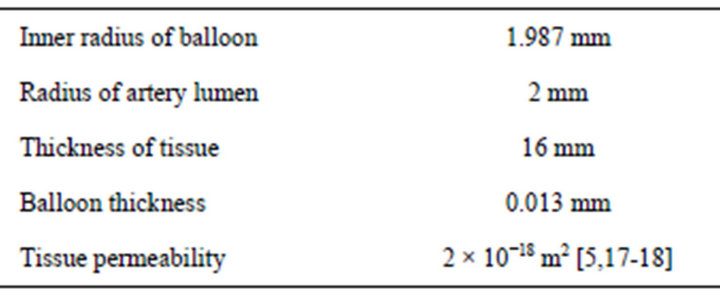
Table 1. Additional inputs for the solution of the drug concentration in the artery wall.
a high viscosity fluid and a shorter therapy duration.
Another facet of the analysis is the selection and/or prediction of rates of fluid flow and of the pressure that is imposed on the wall of the lumen. This capability is illustrated with reference to Table 3. The table shows that the flowrate is insensitive to the balloon permeability for the range of high permeability values. Since high permeability corresponds to low resistance to fluid flow, the flow rates are determined by other resistances in the flow path other than the resistance of the balloon wall. Those other resistances are situated in the tissue bed. As the permeability decreases the flow resistance of the balloon wall begins to assert itself and thereby diminishes the flowrate.
The table also lists the pressure exerted on the artery wall. The practical interest in the artery-wall surface pressure stems from the possible action of elevated pressure in creating an aneurysm. For all of that cases that are treated in Table 3, the pressure in the bore of the balloon was three atmospheres (303,975 Pa). For a single set of operating conditions, the pressure difference Δpb across the wall of the balloon is directly proportional to the flowrate. At higher flowrates, the probability of aneurysm formation is increased. Indeed, the information

Table 2. Dependence of drug concentration on the permeability of the balloon wall.

Table 3. Relationship between balloon permeability, flowrate, and artery wall pressure.
conveyed in Table 3 and that calculated from Equation (3) enables the balance between flowrate and artery wallsurface pressure to be determined.
To demonstrate the formation of an aneurysm, the experiment shown in Figure 3 was performed. It encompassed a segment of excised artery tissue which enveloped a pressurized balloon. The balloon pressurization was accomplished by means of a three-atmosphere saline solution. The aneurysm is believed to be caused by the elevated pressures exerted on the wall of the artery or by the high rates of flow through the porous balloon. It can be reasoned that to minimize the occurrence of an aneurysm it is appropriate to select the least permeable balloon which can still accomplish the therapy. It is noteworthy that smaller values of permeability decrease both the flowrate and the pressure which is exerted on the artery.
3. CONCLUDING REMARKS
A great many drug-delivery processes depend solely on concentration-gradient-driven diffusive mass transfer to accomplish the movement of the drug from the zone of application to the zone of need. However, the slow pace of this process may be insufficient to provide the requisite therapy. This realization provides the motivation for the present investigation.
The permeable-walled-balloon methodology has been shown to provide the means for obtaining the desired flow rate of the therapeutic medium. By the same token, the pressure needed to overcome the advective resistance of the tissue can also be obtained.
The analytical theory which supports the use of the pressurized balloon methodology is based on a porousmedium model which is readily implemented in practice by use of established laser machining techniques. These techniques, when applied to the balloon wall, create
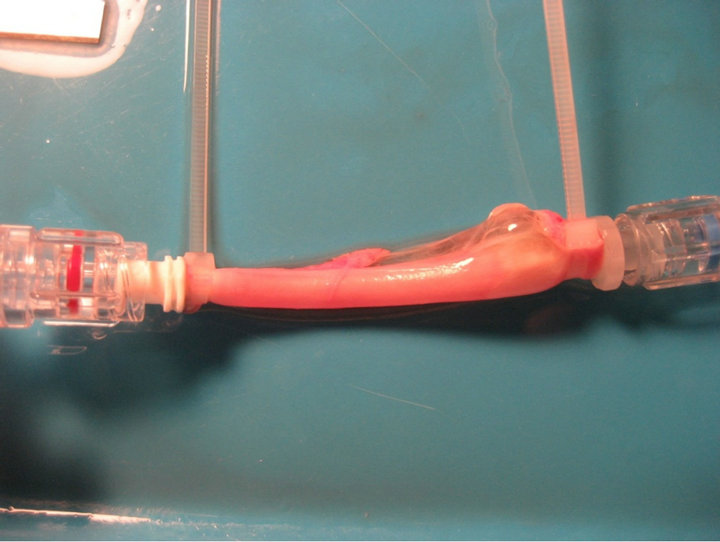
Figure 3. Experiment demonstrating the formation of an aneurysm.
an assemblage of uniformly distributed cylindrical holes of identical diameter. The number of holes and their diameter enable the permeability to be selected. In turn, the permeability controls the pressure drop across the thickness of the wall of the balloon and may play a major role in setting the flow rate of the therapeutic medium. The conditions which define the role of the permeability in the determination of the rate of fluid flow are detailed in paper.
The possibility that an elevated pressure applied to the surface of an artery wall might give rise to an aneurysm was investigated experimentally. To minimize the occurrence of an aneurysm, it is appropriate to select the least permeable balloon which can still accomplish the therapeutic goal.
4. ACKNOWLEDGEMENTS
J. Stark, J. Gorman, and J. Abraham gratefully acknowledge support from Cardiovascular Systems, Inc. for this research.
REFERENCES
- Hwang, C.W., Wu, D. and Edelman, E.R. (2001) Physiological transport forces govern drug distribution for stentbased delivery. Circulation, 104, 600-605. doi:10.1161/hc3101.092214
- Mongrain, R., Leask, R., Brunette, J., Faik, I., BulmanFeleming, N. and Nguyen, T. (2005) Numerical modeling of coronary stents. In: Suri, J.S., et al., Eds., Plaque Imaging: Pixel to Molecular Level, IOS Press, Amsterdam, 443-459.
- Yang, C. and Burt, H.M. (2006) Drug-eluting stents: Factors governing local pharmacokinetics. Advanced Drug Delivery Reviews, 58, 402-411. doi:10.1016/j.addr.2006.01.017
- Mongrain, R., Faik, I., Leask, R.L., Cabau, J.R., Larose, E. and Bertrand, O.F. (2007) Effects of diffusion coefficients and struts apposition using numerical simulations for drug eluting coronary stents. Journal of Biomechanical Engineering, 129, 733-742. doi:10.1115/1.2768381
- Migliavacca, F., Gervaso, F., Prosi, M., Zunino, P., Minisini, S., Formaggia, L. and Dubini, G. (2007) Expansion and drug elution model of a coronary stent. Computer Methods in Biomechanics and Biomedical Engineering, 10, 63-73. doi:10.1080/10255840601071087
- Ferdous, J. and Chong, C.K. (2009) Effect of atherosclerotic plaque on drug delivery from drug-eluting stent. ICBME 2008 Proceedings, 23, 1519-1522.
- Horner, M., Joshi, S., Dhruva, V. and Stewart, S.F.C. (2010) A two-species drug delivery model is required to predict deposition from drug-eluting stents. Cardiovascular Engineering and Technology, 1, 225-234. doi:10.1007/s13239-010-0016-4
- McGinty, S. and McKee, S. (2011) Modeling drug-eluting stents. Mathematical Medicine and Biology, 28, 1-29. doi:10.1093/imammb/dqq003
- Lovich, M.A. and Edelman, E.R. (1995) Mechanisms of transmural heparin transport in the rat abdominal aorta after local vascular delivery. Circulation Research, 77, 1143-1150. doi:10.1161/01.RES.77.6.1143
- Creel, C., Lovich, M.A. and Edelman, E.R. (2000) Arterial paclitaxel distribution and deposition. Circulation Research, 86, 879-884. doi:10.1161/01.RES.86.8.879
- Tzafriri, A.R., Lerner, E.I., Flashner-Barak, M., Hinchcliffe, M., Ratner, E. and Parnas, H. (2005) Mathematical modeling and optimization of drug delivery from interturmurally injected microspheres. Clinical Cancer Research, 11, 826-834.
- Klyushin, D.A., Lyashko, N.I. and Onopchuck, Y.N. (2007) Mathematical modeling and optimization of intratumor drug transport. Cybernetics and Systems Analysis, 43, 886-892. doi:10.1007/s10559-007-0113-z
- Khakpour, M. and Vafai, K. (2008) Critical assessment of arterial transport models. International Journal of Heat and Mass Transfer, 51, 807-822. doi:10.1016/j.ijheatmasstransfer.2007.04.021
- Khakpour, M. and Vafai, K. (2008) A comprehensive analytical solution of macromolecular transport within an artery. International Journal of Heat and Mass Transfer, 51, 2905-2913. doi:10.1016/j.ijheatmasstransfer.2007.09.019
- Tzafriri, A.R., Levin, A.D. and Edelman, E.R. (2009) Diffusion-limited binding explains binary dose response for local arterial and tumor drug delivery. Cell Proliferation, 42, 348-363. doi:10.1111/j.1365-2184.2009.00602.x
- Abraham, J.P., Gorman, J.M., Sparrow, E.M., Stark, J.R. and Kohler, R.E. (2013) A mass transfer model of temporal drug deposition in artery walls. International Journal of Heat and Mass Transfer, 58, 632-638. doi:10.1016/j.ijheatmasstransfer.2012.11.053
- Zunino, P. (2004) Multidimensional pharmacokinetic models applied to the design of drug eluting stents. Cardiovascular Engineering: An International Journal, 4, 181- 191.
- Stangeby, K. and Ethier, R. (2002) Computational analysis of coupled blood-wall arterial LDL transport. Journal of Biomechanical Engineering, 123, 1-8. doi:10.1115/1.1427041
NOTES
*Corresponding author.