Journal of Biomedical Science and Engineering
Vol.5 No.9(2012), Article ID:22425,9 pages DOI:10.4236/jbise.2012.59063
About the structure of posturography: Sampling duration, parametrization, focus of attention (part II)
![]()
1Institute of Sport Sciences, Johann Wolfgang Goethe University, Frankfurt am Main, Germany
2Faculty of Health, Hochschule Fresenius, University of Applied Sciences, Idstein, Germany
Email: *p.schubert@sport.uni-frankfurt.de
Received 20 June 2012; revised 18 July 2012; accepted 30 July 2012
Keywords: Center of Pressure; Sample Duration; Posturographic Parameters; Exploratory Factor Analysis; Nonlinear Methods; Dual-Task; Focus of Attention
ABSTRACT
There exists a great variety of posturographic parameters which complicates the evaluation of center of pressure (COP) data. Hence, recommendations were given to use a set of complementary parameters to explain most of the variance. However, it is unknown whether a dual task paradigm leads to different parametrization sets. On account of this problem an exploratory factor analysis approach was conducted in a dual task experiment. 16 healthy subjects stood on a force plate performing a posture-cognition dual task (DT, focus of attention on a secondary task) with respect to different sampling durations. The subjects were not aware of being measured in contrast to a baseline task condition (BT, internal focus of attention) in the previously published part I. In compareson to BT a different factor loading pattern appears. In addition, factor loadings are strongly affected by different sampling durations. DT reveals a change of factor loading structure with longer sampling durations compared to BT. Specific recommendations concerning a framework of posturographic parametrization are given.
1. INTRODUCTION
The first part of the study has shown that in a typical baseline task situation (focus of attention on the postural control process) factor structure was unaffected with respect to different sampling durations. However, there are multiple articles which prove evidence that a secondary task modality exert influence on postural control characteristics [1]. A plurality of research articles concerning COP fluctuations in static stance conditions has emerged in the recent years. However, little success has been achieved in discriminating populations and diverging results are reported [1,2]. For instance, there exists a long debate on the effect of a cognitive secondary task1 on postural control and stability [1]. As far as higher brain areas are involved, one may conjecture the influence of cognitive sensory information on internal processing of postural equilibrium [3]. Postural control cannot be regarded merely as an automatic reflex controlled process but is in fact strongly dependent on attentional resources [4]. A theoretical approach to this phenomenon is based on the activity of competitive neural structures and the limitation of processing resources in higher brain areas. Nonetheless, researchers report on increased, decreased, and no changes of postural displacements when using a dual-task paradigm [1]. One reason for these discrepancies may arise from a lack of standardization in experimental procedures [5]. Especially, the usage and the different applications of a variety of stabilographic parameters which were educed from COP excursions consequently disallow comparisons between studies despite similar experimental designs. Different COP parameters account for different specific characteristics of the dataset and henceforth a concise analysis of COP displacements necessitates a mixed summing-up of various non-redundant parameters [6-8]. Furthermore, there is no agreement how the different measures relate to each other in the context of cognitive dual task performance. In part I of this study, we have shown that even with different sampling durations comprehensive parametrization of COP is not affected in a typical quiet stance condition. We recommended the choice of one posturographic parameter in each case from 11 groups of variables which delivers an immediate benefit for clinical and research analysis of postural control. In a further step one may speculate whether a different pattern in the factor structure of descriptive posturographic parameter setting occurs while performing a secondary task compared to a quiet stance task. In the present part we investigate the influence of a dual-task on parameter selection in posturography. On this purpose we choose a dual-task paradigm with respect to three different sampling durations. We discuss the results with those obtained from part I which is referred to the typical BT condition at this juncture. In everyday life situations postural control seems to interfere with secondary or even more tasks and therefore investigations concerning BT pose an artificial concept [9,10]. Especially in rehabilitation where single task procedures are typically applied to evaluate postural performance, dual task paradigms have to be integrated. Moreover, postural control is often analyzed by only one parameter and thus, results have limited significance. Joining both aspects, the present study could potentially advance the practical rehabilitation field by featuring a paramtrization set under dual task methods.
2. METHODS
2.1. Experimental Procedure
As explained by the first part, sixteen healthy students (9 males and 7 females, age: 26.1 ± 6.7 years; height: 173.45 ± 11.14 cm; weight: 72.36 ± 13.04 kg) without musculoskeletal or neurological dysfunctions participated voluntarily in this study. The experimental set-up comprised two consecutive parts: subjects were instructed to stand with both feet parallel and upright while simultaneously accomplishing a cognitive task (dual task: DT) and quietly while fixing a point on the wall in front (baseline task: BT, compare part I). Both conditions consisted of three trials with different sampling durations (35 s, 65 s, 305 s) for each subject. At least 60 s is seen to be appropriate for time domain parameters, whereas the description of other parameters need 300 s of duration [5]. First, the DT subjects performed a visual short-term-memory task. A group of icons (workaday objects, e.g. chair, car, ball, etc) which were projected for 10 s on a wall had to be memorized. Subsequently the subjects denominated the missing icon of that group in a 10 s lasting verbal-response phase (Figure 1). Both sequences were executed recurrently. To get familiar to the memory task a 30 s practice run was completed prior to the actual measurement trials. During DT the subjects could choose their own comfortable position ad libitum (unconstrained standing) with the only instruction not to leave the platform of the force plate to adopt their natural standing pattern (e.g. [11,12]). The subjects were not aware of being measured. They were simply advised to stand on the rectangular platform of the force plate and told not to leave it while solving the dual task. The number of correct answers to the task was not of in-
 (a) (b)
Figure 1. Example for the dual task operation (DT). (a) A group of icons had to be memorized for 10 s; (b) A missing icon indicated by the question mark had to be denominated subsequently.
terest, as it had the only function to distract the subjects from their internally induced focus of attention [1,13]. All subjects solved the identical cognitive sequences to gain ceteris paribus validity. In BT condition the subjects were simply asked to stand as still as possible in hip width stance with arms relaxed at both sides and to stare at a point on the wall in front. This condition is referred to the typical laboratory condition and still in practice, for example, to discriminate between different populations (e.g. [14]). Due to the fact that distance between the eyes and the visual field affects postural performance it was left unchanged during the whole measurement (about 2 m) [15].
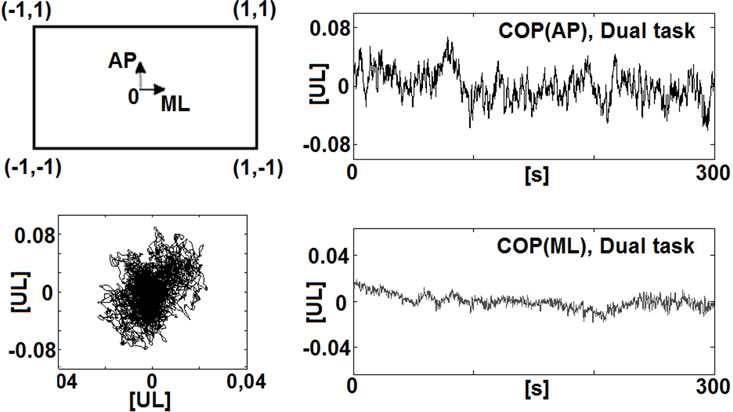
A 4th order low-pass Butterworth filter with a cut-off frequency of 10 Hz was applied to eliminate measurement noise [1,16]. Time series were downsampled to 100 Hz (for calculation of entropy values to 20 Hz) and detrended by the mean of the time series. Impact effects were eliminated by cutting the first 5 s from the time series (Figure 2). The person’s task temporally exceeded the measured samples so that no end effects were detectable.
2.2. COP Parameters and Data Analysis
We selected the identical parameters for COP analysis as in part I of this study. Briefly, the different variables comprised the most common traditional and nonlinear parameters derived from anterior-posterior and mediallateral direction, and from 2-dimensional COP trace [17- 21]. With regard to the nonlinear parameters we involved a complementary set of comprehensive tools (i.e. entropy values, DFA, and wavelet transform), which is recently proposed by [22].
Data analysis was achieved—identical to part I—by an exploratory factor analysis approach (EFA). Concerning the quantity of computed parameters the values were divided into five parameter blocks (1-dimensional ML, 1- dimensional AP, 2-dimensional, nonlinear ML, nonlinear AP, Figure 2) which subsequently allowed the calculation of 15 EFAs (5 blocks × 3 sampling durations). The sampling durations were separated into 30 s, 60 s, and 300 s. We faced the problem of having a small subject
 (a)
(a)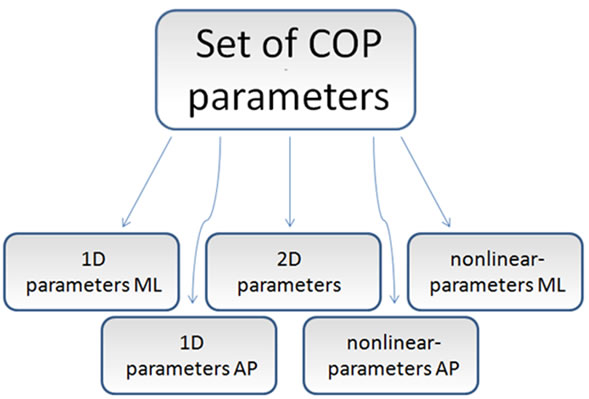 (b)
(b)
Figure 2. (a) Force plate and measurement directions. The COP position is expressed as a fraction of deviation from the midpoint of the force plate (values in units of length [UL]). Exemplary COP recording and resultant AP and ML time series (values in units of length [UL]); (b) Classification of COP parameters into five groups.
cohort [23]. For a more detailed description of parameter calculation and EFA procedure we refer to the methods section of part I of this study.
3. RESULTS
3.1. Sampling Adequacy
Due to KMO and AIC values we excluded in 2 cases of 15 EFA’s particular parameters to improve the sampling adequacy of the parameter sets. Those were SaEnML (30 s, DT, nonlinear ML-block) and std r (300 s, DT, 2D block). The exclusion process showed no influence on the remaining parameter loadings. After this procedure the sampling adequacy values matched the requirements (mean KMO = 0.69, KMOmin = 0.61, KMOmax = 0.87). Item communality values were consistently over 0.83 which match the specifications of [23] and [24]. This can be explained by high correlations between the stabilometric parameters. As a result, the proband cohort which is smaller than traditionally recommended is likely sufficient for adequate application of EFA [23]. Bartlett’s test of sphericity always rejects the null hypothesis that the correlation matrix is equal to anidentity matrix [p < 0.001].
3.2. Traditional Parameters 1D ML
Overall a consistent pattern of the EFA’s is observable (Table 1). Regardless of sampling duration two principal components with approximately equal loadings in variance (appr. 40% to 40%) are extracted. Each EFA explain at about 90% of variance on average. The interpretation of components is analogous to their mathematical description. The first component comprises parameters from the time domain (pathML, velML, rangeML, stdML and RmsML) and the second component is clustered of parameters from the frequency domain (fmeanML, f50ML, f80ML, f95ML and f99ML). Within the frequency parameters three values can be stressed (fmeanML, f80ML and f95ML). In the time domain component StdML and RmsML show on average higher loadings than the other parameters.
3.3. Traditional Parameters 1D AP
In anterior posterior direction (Table 2) a similar output as in ML direction can be noticed. Two components were extracted except of the 30 s trial. Comparable to the ML direction time domain and frequency domain values are separated (with marginal exceptions: VelAP 30 s, f99AP 30 s, PathAP 60 s, VelAP 300 s, and RangeAP 300 s). The distribution of variances is equally and alike to the ML configuration. The total explained variance approximates 85% - 90%. Again, higher loadings in the frequency domain are observed with fmean, f80 and f95.
3.4. Traditional Parameters 2D
The 2-dimensional parameters display three components in the 30 s and 300 s trial and two components in the 60 s trial (Table 3). Interpretation of these components proves to be difficult. Factor loadings were rather similar in the 30 s and the 60 s run, neglecting the third component in 30 s. One component is associated with Beta and std Beta with ~16% of explained variance. This component may be interpreted as the global alignment of the COP trace. The residual values load on the first component, which forms the greatest deal of explained variance. This component is explained principally by area values. Length and Turns show no consistent factor loading according to different sampling durations. The 300 s measurement deserves particular attention. Interestingly, different variables describing COP area load to different components. Furthermore Ae and Ac is not immediately associated with Ae sec, std Ae sec and Ac sec, std Ac sec. Apparently, the pattern of the shorter sampling durations changes to a more complex construct in longer sampling durations. The first and second component is associated with COP variables describing the elongation and area covered of the data. Beside this description of the general pattern, a closer glance on the factor loadings reveals
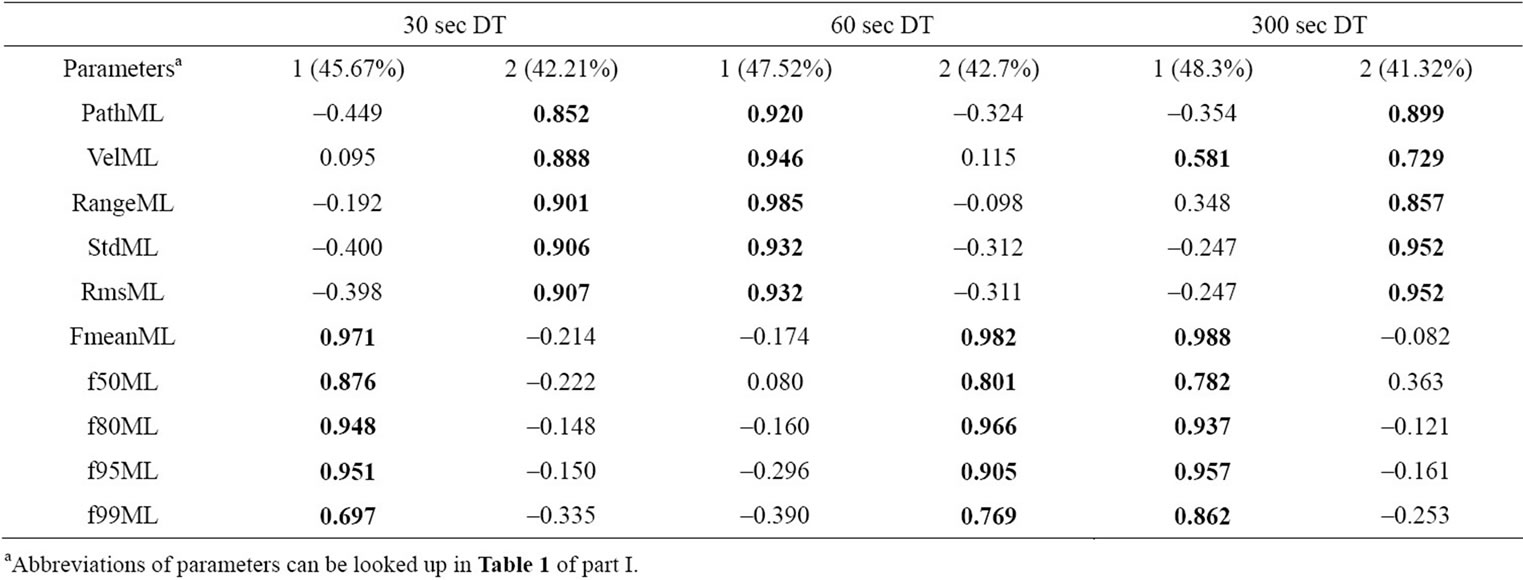
Table 1. Factor loadings for 1-D parameters ML (rotated, >0.5 in bold letters). Components and explained variances.
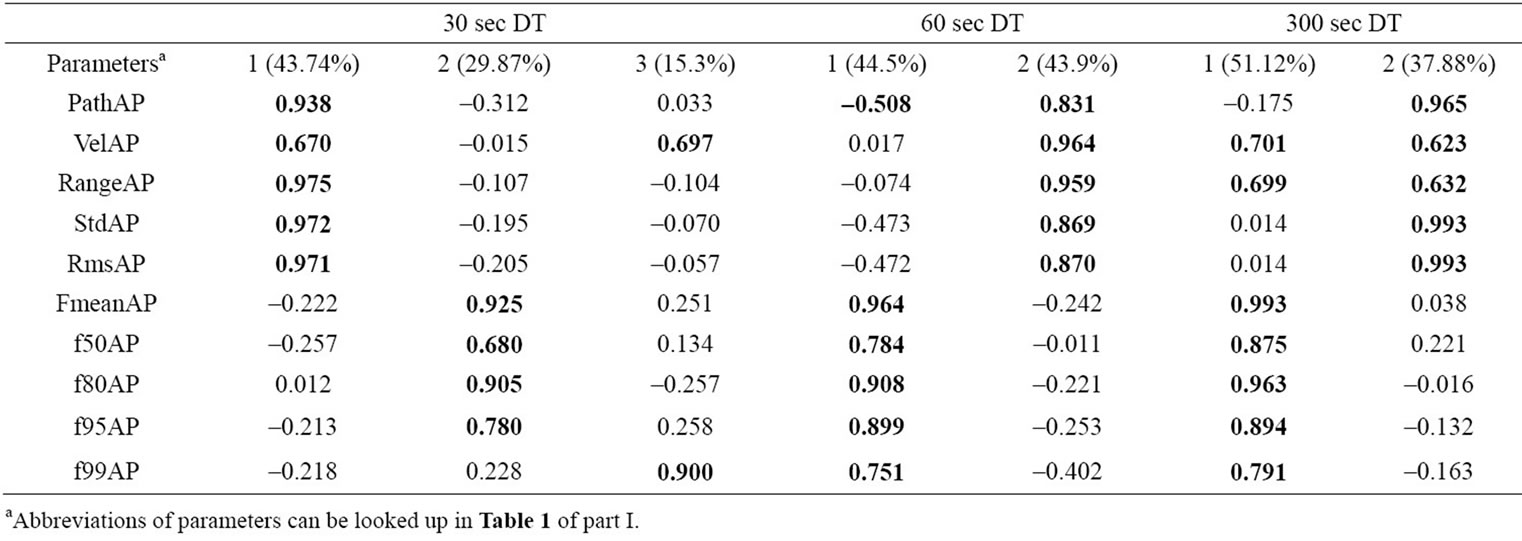
Table 2. Factor loadings for 1-D parameters AP (rotated, >0.5 in bold letters). Components and explained variances.
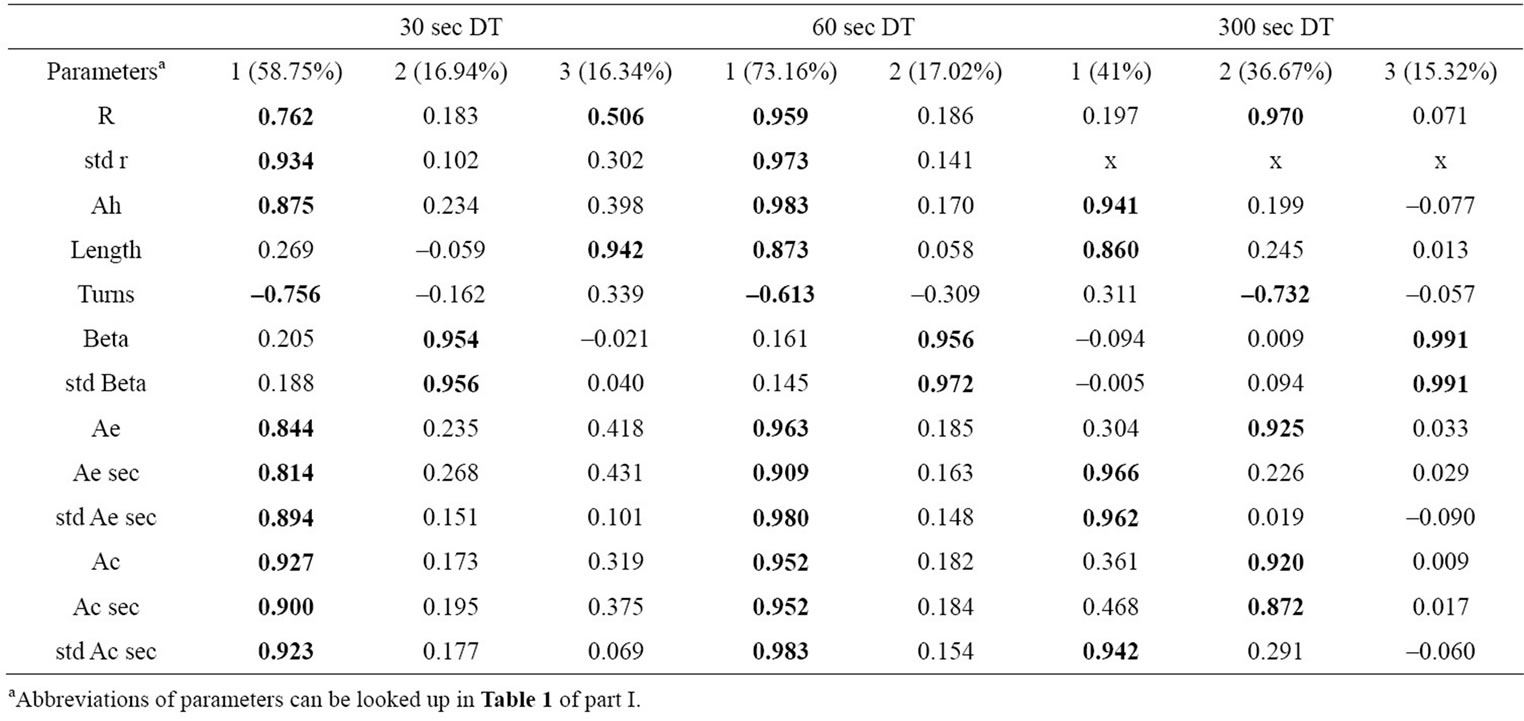
Table 3. Factor loadings for 2-D parameters (rotated, >0.5 in bold letters). Components and explained variances.
within some parameters dependencies on the respective sampling durations.
3.5. Nonlinear Parameters ML
Pattern of nonlinear values display a complex irregular factor loading behavior (Table 4). Differences occur within the three sampling durations. The 30 s trial discloses two components at which the first component is assembled by entropy parameters and the second component is composed of hML and cumWTML. A slight difference is arising in the 60 s run. Entropy values go along with the Hurst coefficient, whereas cumWTML is accompanied by SaEnvelML. This pattern breaks down within the longest sampling duration. Three components account for the variance in the ML nonlinear data. The first component is built up of SaEnML and hML, which could be interpreted as a component generally declaring irregularity in a particular time scale of the time series. The second component comprises of MseML and cumWTML, which is a global indicator concerning different time scales. The last component refers to SaEnvelML which is the entropy value of the increment time series.
3.6. Nonlinear Parameters AP
Nonlinear variables in AP direction highlight a similar behavior of factor structure compared to ML (two components in 30 s and 60 s and one component in 300 s; (Table 5). Within the 30 s run one could discriminate any kind of entropy values from hAP and cumWTAP. Short sample durations do not stand for high time scale resolution, for which this result could be challenged. This may also explain the discrepancies in loading pattern to the 60 s run. The 300 s trial shows an allocation of values describing irregularity of the time series and the split-up of the two multi time-scale parameters MseAP and cumWTAP as these values imply the highest factor loadings in the principal components.
4. DISCUSSION
With respect to the factorial structures thorough COP description obviously necessitates various values out of different parameter classes [6]. The choice of a set of parameters including these characteristics implies a critical position opposite to studies using a few parameters for COP analysis. Lack of standardization in parametrization may be one reason for contradictory results in literature [1,2]. The great variety of postural measures can complicate posturographic data interpretation. For instance, within the dual task controversy Huxhold et al. (2006) highlight increased COP parameter values (hull area, elliptic area and root mean square ML) with different dual task conditions compared to the baseline task [9]. However, Hunter and Hoffmann (2001) demonstrate greater COP variability (higher values for COP-velocity and standard deviation in AP and ML) in subjects with no additional cognitive load [25].

Table 4. Factor loadings for nonlinear parameters ML (rotated, >0.5 in bold letters). Components and explained variances.
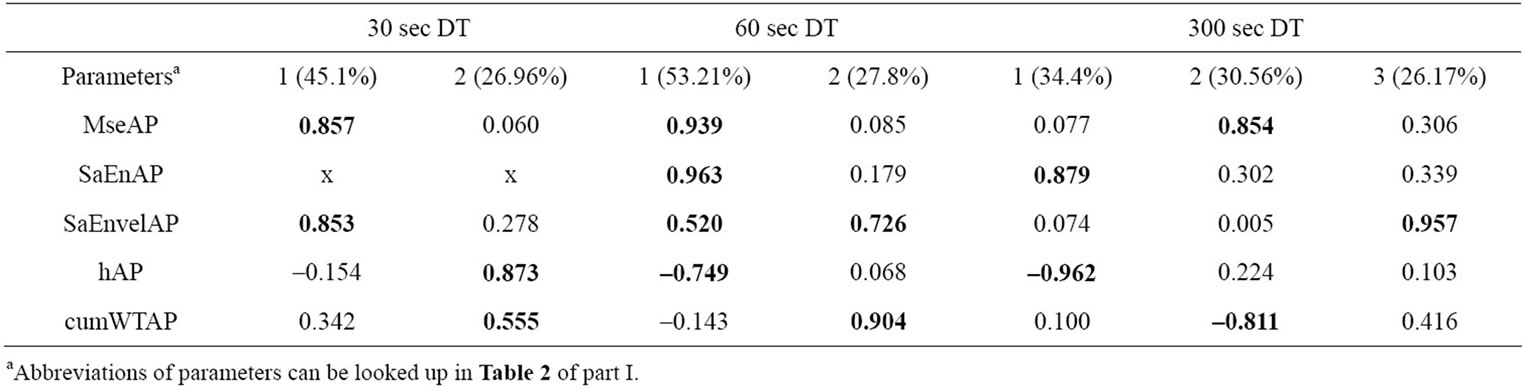
Table 5. Factor loadings for nonlinear parameters ML (rotated, >0.5 in bold letters). Components and explained variances.
4.1. Effect of Sampling Duration on COP Parametrization in DT
With respect to different sampling durations, an effect on COP parametrization is observable. Pattern of principal component loadings in 2-dimensional and nonlinear ML variable blocks break down within the alteration from shorter sampling durations to the longest one. In this process, it becomes noticeable that measures describing the global extent of COP migration divide into two different components wherein the description of area parameters diverges. Sway area is normally defined as the elliptic approximation of the COP excursions [26], however several articles deal with different algorithms [27, 28]. The present analysis confirms that applying area parameters in a dual task experiment motivates the usage of different values in longer sampling durations. The longer the sampling duration the more probable transient and particular events due to postural changes will occur [11,29], and therefore deteriorates an adequate estimation of area by Ae or Ac and is differently detected by Ah.
Nonlinear descriptors in ML direction exhibit a similar behavior. Again, a breakdown of loading pattern within the longest recording time is recognizable. Durations of 300s enables a distinction between SaEn and SaEnvel. Differentiated time series allow a reduction in nonstationarity [30,31]. This effect may be more accurate for longer sampling durations [22]. A very complex structure manifests in the nonlinear measures, whereas some difference grow comparing both directions. In general, one may speculate that the longer the sampling duration the higher the time scales, which alters information content of the parameters.
It seems to be obvious, that longer sampling times lead to more consistent datasets whereas no comparable examinations can be found with respect to posture-cognition dual task methodology. In simple quiet stance investigations, increases in the reliability with increased sample duration have been reported [32-34]. However, these results were obtained with measurement durations of less than 120 s. Recent recommendations extend the duration up to 300 s [5]. Concerning nonlinear measures, definite recommendations are not generally available in literature. Longer time series imply better resolution of frequencies and more samples can be obtained on account of explicit time scales. For instance, Cannon et al. (1997) propose to investigate longer time series in order to generate more reliability in calculation of the Hurst coefficient in DFA [35]. Sample entropy measures require an adequate number of data points of the underlying time series [36]. These observations hint the utility of longer time series to generate reliable data sets. In other studies, the number of data points has been artificially increased by means of an increase of the sample frequency. As this study proposes that the postural control system and its dynamics may generate a change of loading pattern and hence enter into a different state with longer stance durations in DT, this procedure could miss the target.
Including our results of EFA, inconsistency of the posturographic 2-dimensional and nonlinear parameters over different sampling durations reveal that within a dualtask methodology accurate assessment of COP displacements has to be accomplished with caution. Especially, nonlinear values show fine sensitivity to different measurement times.
4.2. Comparison of BT to DT
In part I of this study we dealt with a quiet stance methodology concerning equal sampling durations (30 s, 60s and 300 s) which in comparison to the present part serves as the typical baseline condition (BT) under laboratory conditions. In general, we can contrast the diverse posturographic parameter loadings and pattern, generated by both conceptual study designs. We found that within BT consistent factor loadings occurred despite different measurement times. In the present DT condition dependencies to sampling durations can be recognized in 2- dimensional and nonlinear variable blocks. This phenomenon which does not appear in BT could be argued by a breakdown of certain loading pattern. Apparently, distraction from posture which conforms to an automatization mechanism [37] evokes COP dynamics to change into a new state with longer sampling durations. In consideration to factor loadings we can depict the following aspects. One-dimensional traditional parameters allocate consistently to either time domain or frequency domain components which are equal in DT and BT. This invariance confirms the relative robustness of these parameters describing COP excursions despite different experimental conditions. Peculiarities are unfolded among the other variable blocks. Conspicuously, the indices length and turns (which is the normalized length) point out to create different meanings in DT and BT. Whereas in quiet stance both variables generate complementary information and build a separate component, they tend to act independently in DT and group with different parameters. Again, robust measures are associated with beta and std beta, which are invariant towards DT and BT. Baseline conditions in dual task experiments cannot be created without complications [1]. COP parameters are strongly dependant on initial conditions, e.g. instructions given to the subjects leading to different foci of attention [37]. The experimental design of the present study challenges this problem. Within the DT runs subjects were naïve on the experimental purpose. Hence, they were oblivious of being measured, so that an automatization of postural control mechanisms during solving of the test can be assumed as attention was distracted. This approach is therefore useful for proper standardization of posturecognition dual task conditions.
4.3. Classification of Parameters
Classifying posturographic variables by means of data reduction methods has been shown by others yet [6-8,21]. The present study differs from the aforementioned investigations with respect to the application of a dual task design under different recording times. There exists agreement on that different posture-cognition dual task methodologies could lead to different postural performances. The theory is based on the limitation of processing capacity and the influence of conflicting sensory inputs. It is widely accepted that a certain amount of attention is required to maintain a stable upright posture [4]. Hence, the creation of an additional attentional focus generates an interference of processing orders and could constrain postural control resources. Evidence has risen from different points of view. First, reaction time to sensory stimuli seems to be dependent on the difficulty of the postural task and proofs therefore indirectly the impact of attentional influences on postural processing resources [38, 39]. Second, it is demonstrated by some authors that sway dynamics are affected by additional cognitive tasks in healthy adults, whereas there is some debate whether more difficult tasks lead to more altered COP excursions (e.g. [9,13,40]). The present study confirms these findings as a different loading pattern in DT in opposition to BT of a variety of posturographic parameters appears. Furthermore, we point out that pattern is inconsistent within the 2-dimensional and nonlinear measures and that a change of loading structure with longer sampling durations is observable. Longer recording times obviously have better discriminative power in DT than shorter ones especially concerning nonlinear parameters [22]. Hence we recommend the usage of longer sampling durations (300 s) and refer to these parametrization sets and therein 13 descriptors as a framework for further research. At this juncture, pattern generated by nonlinear variable groups proves to be complex. To create a trustful set cumWT and an entropy value should be included [22]. Here, we could not find a consistent pattern for nonlinear parameters which may be interpreted as a highly sensitive pattern depending on specific postural tasks and recording times.
5. CONCLUSIONS
5.1. Dual Task Paradigm
Equal to the BT condition (part I) four 1-dimensional parameters explaining time domain and frequency domain in AP and ML should be chosen: 1) time domain AP; 2) time domain ML; 3) frequency domain AP; 4) frequency domain ML. In the 2-dimensional group we suggest three parameters. Variables of COP elongation and area are split into two components. We suggest to take either both COP length and the normalized length (turns) or to implement two different area values: 5) global alignment of the COP; 6) and 7) length or area measures. Nonlinear values should comprise; 8) irregularity parameter ML; 9) irregularity parameter ML of the increment time series; 10) nonlinear multitimescale parameter ML; 11) irregularity parameter AP; 12) irregularity parameter AP of the increment time series; 13) and a nonlinear multi-time scale parameter AP. Concerning these outcomes a caveat has to be made. As secondary tasks comprise a manifold field, different secondary tasks, which should distract the subject’s attention from postural control, could lead to different parametrization pattern.
5.2. Further Aspects
Beside other studies implementing data reduction methods [6,8], both parts of this study constitute a first step to evaluate the structure of parametrization in posturography. Evidence is provided that performance in postural control cannot be accomplished by a single parameter, however, a set of parameters is needed. This finding illustrates the complex sensorimotor function of stance control. We depicted which parameters could deliver different insights into this process. Furthermore, we demonstrated that different foci of attention (BT and DT) lead to different sensitivities of the parameters. As a conesquence the question arises as to which extent the parameter sets could be transferred to other experimental conditions or different cohorts (e.g. patients). Concerning the utility of longer sampling durations some conflicting aspects have to be discussed. The longer COP motion is recorded the more specific information content can be readout (especially when nonlinear or frequency analysis are conducted) [22]. However, within longer sampling duration physiological processes like adaptation, habituation and fatigue carry more weight [e.g. 41]. Hence, there exists an optimum for postural control mapping. Moreover, this optimal trend would be different within subjects whose tolerance to e.g. fatigue is altered. Parametrization in posturography could deal nevertheless, as a multivariate fingerprint of postural control. This would render the application of various stabilometric univariate tests unnecessary. However, dynamic postural control conditions, which are often used in e.g. clinical tests, differ from static quiet stance situations [42] and hence configurations of parameter sets could be modified. As within additive secondary tasks, an unstable support surface demands more processing from the subject which could lead to capacity problems [43]. Just in subjects with limited information capacity (e.g. Parkinson disease patients), a change in parameter loading pattern could be observed within even shorter sampling durations.
As in the present study parameters were previously classified, we do not account for the interaction between the variable groups. This has to be elucidated in further investigations.
6. ACKNOWLEDGEMENTS
This research was supported by the LOEWE focus “PreBionics”.
![]()
![]()
REFERENCES
- Fraizer, E. and Mitra, S. (2008) Methodological and interpretive issues in posture-cognition dual-tasking in upright stance. Gait Posture, 27, 271-279. doi:10.1016/j.gaitpost.2007.04.002
- Visser, J.E., Carpenter, M.G., van der Kooij, H. and Bloem, B.R. (2008) The clinical utility of posturography. Clinical Neurophysiology, 119, 2424-2436. doi:10.1016/j.clinph.2008.07.220
- Lacour, M., Bernard-Demanze, L. and Dumitrescu, M. (2008) Posture control, aging, and attention resources: Models and posture-analysis methods. Clinical Neurophysiology, 38, 411-421. doi:10.1016/j.neucli.2008.09.005
- Woollacott, M. and Shumway-Cook, A. (2002) Attention and the control of posture and gait: A review of an emerging area of research. Gait and Posture, 16, 1-14. doi:10.1016/S0966-6362(01)00156-4
- van der Kooij, H., Campbell, A.D. and Carpenter, M.G. (2011). Sampling duration effects on centre of pressure descriptive measures. Gait & Posture, 34, 19-24. doi:10.1016/j.gaitpost.2011.02.025
- Rocchi, L., Chiari, L. and Capello, A. (2004) Feature selection of stabilometric parameters based on principal component analysis. Medical & Biological Engineering & Computing, 42, 71-79. doi:10.1007/BF02351013
- Rocchi, L., Chiari, L., Capello, A. and Horak, F.B. (2006) Identification of distinct characteristics of postural sway in Parkinson’s disease: A feature selection procedure based on principal component analysis. Neuroscience Letters, 394, 140-145. doi:10.1016/j.neulet.2005.10.020
- Kitibayashi, T., Demura, S. and Noda, M. (2003) Examination of the factor structure of center of foot pressure movement and cross-validity. Journal of Physiological Anthropology and Applied Human Science, 22, 265-272. doi:10.2114/jpa.22.265
- Huxhold, O., Li, S.-C., Schmiedek, F and Lindenberger, U. (2006) Dual-tasking postural control: Aging and the effects of cognitive demand in conjunction with focus of attention. Brain Research Bulletin, 69, 294-305. doi:10.1016/j.brainresbull.2006.01.002
- Kapoula, Z., Matheron, E., Demule, E., Fauvel, C. and Bucci, M. (2011) Postural control during the Stroop Test in dyslexic and non dyslexic teenagers. PLoS ONE, 6, e19272. doi:10.1371/journal.pone.0019272
- Duarte, M. and Zatsiorsky, V.M. (1999) Patterns of center of pressure migration during prolonged unconstrained standing. Motor Control, 3, 12-27.
- Duarte, M., Harvey, W. and Zatsiorsky, V.M. (2000) Stabilographic analysis of unconstrained standing. Ergonomics, 43, 1824-1839. doi:10.1080/00140130050174491
- Pellecchia, G.L. (2003) Postural sway increases with attentional demands of concurrent cognitive task. Gait & Posture, 18, 29-34. doi:10.1016/S0966-6362(02)00138-8
- Bolbecker, A.R., Hong, S.L., Kent, J.S., Klaunig, M.J., O’Donnell, B.F. and Hetrick, W.P. (2011) Postural control in bipolar disorder: Increased sway area and decreased dynamical complexity. PLoS ONE, 6, e19824. doi:10.1371/journal.pone.0019824
- Prado, J., Stoffregen, T. and Duarte, M. (2007) Postural sway during dual tasks in young and elderly adults. Gerontology, 53, 274-281. doi:10.1159/000102938
- Ruhe, A., Fejer, R. and Walker, B. (2010) The test-retest reliability of centre of pressure measures in bipedal static task conditions—A systematic review of the literature. Gait & Posture, 32, 436-445. doi:10.1016/j.gaitpost.2010.09.012
- Maurer, C. and Peterka, R. (2005) A new interpretation of spontaneous sway measures based on a simple model of human postural control. Journal of Neurophysiology, 93, 189-200. doi:10.1152/jn.00221.2004
- Duarte, M. and Freitas, S. (2010) Revision of posturography based on force plate for balance evaluation. Revista Brasileira de Fisioterapia, 14, 183-192. doi:10.1590/S1413-35552010000300003
- Duarte, M., Freitas, S.M.S.F. and Zatsiorsky, V. (2011) Control of equilibrium in humans—Sway over sway. In: Latash, M. and Danion, F., Eds., Motor Control, Oxford University Press, Oxford, 219-242.
- Prieto, T., Myklebust, J., Hoffmann, R., Lovett, E. and Myklebust, B. (1996) Measures of postural steadiness: Differences between healthy young and elderly adults. IEEE Transactions on Biomedical Engineering, 43, 956- 966. doi:10.1109/10.532130
- Raymakers, J.A., Samson, M.M. and Verhaar, H.J.J. (2005) The assessment of body sway and the choice of the stability parameter(s). Gait and Posture, 21, 48-58. doi:10.1016/j.gaitpost.2003.11.006
- Kirchner, M., Schubert, P., Schmidtbleicher, D. and Haas, C.T. (2012) Evaluation of the temporal structure of postural sway fluctuations based on a comprehensive set of analysis tools. Physica A, 391, 4692-4703. doi:10.1016/j.physa.2012.05.034
- MacCallum, R. C., Widaman, K. F., Zhang, S. and Hong, S. (1999) Sample size in factor analysis. Psychological Methods, 4, 84-99. doi:10.1037/1082-989X.4.1.84
- Costello, A.B. and Osborne, J.W. (2005) Best practices in exploratory factor analysis: Four recommendations for getting the most from your analysis. Practical Assessment, Research & Evaluation, 10, 1-9.
- Hunter, M.C. and Hoffman, M.A. (2001) Postural control: Visual and cognitive manipulations. Gait and Posture, 13, 41-48. doi:10.1016/S0966-6362(00)00089-8
- Oliviera, L.F., Simpson, D.M. and Nadal, J. (1996) Calculation of area of stabilometric signals using principal component analysis. Physiological Measurement, 17, 305- 312. doi:10.1088/0967-3334/17/4/008
- Kim, G.T., Ferdjallah, M. and Harris, G.F. (2009) Fast computational analysis of sway area using center of pressure data in normal children and children with cerebral palsy. American Journal of Biomedical Sciences, 1, 364- 372. doi:10.5099/aj090400364
- Sevsek, F. (2006) Determination of sway area by Fourier analysis of its contour. Proceedings of the 6th WSEAS International Conference on Applied Computer Science (ASC’06), Tenerife, 16-18 December 2006, 514-518.
- Carroll, J.P. and Freedman, W. (1993) Nonstationary properties of postural sway. Journal of Biomechanics, 26, 409-416. doi:10.1016/0021-9290(93)90004-X
- Ramdani, S., Seigle, B., Lagarde, J., Bouchara, F. and Bernard, P.L. (2009) On the use of sample entropy to analyze human postural sway data. Medical Engineering & Physics, 31, 1023-1031. doi:10.1016/j.medengphy.2009.06.004
- Kantz, H., and Schreiber, T. (2004) Nonlinear time series analysis. 2nd Edition, Cambridge University Press, Cambridge.
- Doyle, R.J., Ragan, B.G., Rajendran, K., Rosengren, K., S. and Hsiao-Wecksler, E.T. (2008) Generalizability of stabilogram diffusion analysis of center of pressure measures. Gait & Posture, 27, 223-230. doi:10.1016/j.gaitpost.2007.03.013
- Carpenter, M.G., Frank, J.S., Winter, D.A. and Peysar, G. W. (2001) Sampling duration effects on centre of pressure summary measures. Gait & Posture, 13, 35-40. doi:10.1016/S0966-6362(00)00093-X
- Le Clair, K. and Riach, C. (1993) Postural stability measures: What to measure and for how long. Clinical Biomechanics, 11, 176-178. doi:10.1016/0268-0033(95)00027-5
- Cannon, M., Percival, D., Caccia, D., Raymond, G. and Bassingthwaighte, J. (1997) Evaluation scaled windowed variance methods for estimating the hurst coefficient of time series. Physica A, 241, 606-626. doi:10.1016/S0378-4371(97)00252-5
- Rhea, C.K., Silver, T.A., Hong, S.L., Ryu, J.H., Studenka, B.E., Hughes, C.M.L. and Haddad, J.M. (2011) Noise and complexity in human postural control: Interpreting the different estimations of entropy. PLoS ONE, 6, 1-9. doi:10.1371/journal.pone.0017696
- Vuillerme, N. and Nafati, G. (2007) How attentional focus on body sway affects postural control during quiet standing. Psychological Research, 71, 192-200. doi:10.1007/s00426-005-0018-2
- Vuillerme, N. and Nougier, V. (2004) Attentional demand for regulating postural sway: The effect of expertise in gymnastics. Brain Research Bulletin, 63, 161-165. doi:10.1016/j.brainresbull.2004.02.006
- Lajoie, Y., Teadale, N., Bard, C. and Fleury, M. (1993) Attentional demands for static and dynamic equilibrium. Experimental Brain Research, 97, 139-144. doi:10.1007/BF00228824
- Dault, M.C., Frank, J.S. and Allard, F. (2001) Influence of a visuo-spatial, verbal and central executive working memory task on postural control. Gait & Posture, 14, 110-116. doi:10.1016/S0966-6362(01)00113-8
- Wojcik, L.A., Nussbaum, M.A., Lin, D., Shibata, P.A., Madigan, M.L. (2011) Age and gender moderate the effects of localized muscle fatigue on lower extremity joint torques used during quiet stance. Human Movement Science, 30, 574-583. doi:10.1016/j.humov.2010.03.008
- Moya, G.B.L., Siqueira, C.M., Caffaro, R.R., Fu, C. and Tanaka, C. (2009) Can quiet standing posture predict compensatory postural adjustment? Clinics (Sao Paulo), 64, 791-796. doi:10.1590/S1807-59322009000800014
- Halford, G.S., Baker, R., McCredden, J.E. and Bain, J.D. (2005) How many variables can humans process? Psychological Science, 16, 70-76. doi:10.1111/j.0956-7976.2005.00782.x
NOTES
*Corresponding author.
1Definitions of dual-task and secondary task terminologies diverge slightly. Concerning the present investigation we determine both as similar.