Journal of Cancer Therapy
Vol.4 No.4A(2013), Article ID:30487,16 pages DOI:10.4236/jct.2013.44A003
Gene Expression Profiles Predict Sensitivity of Prostate Cancer to Radiotherapy

1Department of Immunology, Weizmann Institute of Science, Rehovot, Israel; 2Department of Radiation Oncology, The Sheba Medical Center, Ramat Gan, Israel; 3Genetic Institute, Tel Aviv Sourasky Medical Center, Tel-Aviv University, Tel-Aviv, Israel; 4Physics of Complex Systems, Weizmann Institute of Science, Rehovot, Israel.
Email: *zelig.eshhar@weizmann.ac.il
Copyright © 2013 Lilach Agemy et al. This is an open access article distributed under the Creative Commons Attribution License, which permits unrestricted use, distribution, and reproduction in any medium, provided the original work is properly cited.
Received January 7th, 2013; revised February 9th, 2013; accepted February 17th, 2013
Keywords: Prostate Cancer; Ionizing Radiation; Radioresistance; Radiosensitive; Gene Microarray; Transcription Profiles
ABSTRACT
Ionizing radiation (IR) is the most common treatment used to control localized primary prostate cancer (PC). However, for a significant number of patients, radiotherapy fails to adequately control the tumor. Thus, a main clinical problem today is the lack of a specific marker that may be used to predict the treatment outcome and to identify prostate cancer patients who are unlikely to respond to radiation therapy. In this study, we used human PC xenografts with predetermined radioresistant/sensitive phenotypes, and gene expression microarrays, correlated their specific transcriptional profiles with response to radiation. Employing unsupervised two-way hierarchical clustering, we identified four gene clusters displaying different expression patterns. Two clusters showed higher expression levels in the resistant xenografts and the other two clusters showed higher expression levels in the sensitive xenografts. Expression levels of 113 genes differed by at least 3 fold between sensitive and resistant xenografts. These genes represent members of several cellular pathways, some of which are known to be associated with response to radiation. All or several of these genes could serve as predictive tools to determine at biopsy the expected response of a particular tumor to radiotherapy. Indeed, the profiles we identified enabled us to predict the degree of radiosensitivity of a panel of established PC cell lines. Importantly, irradiation of the PC xenografts did not induce any significant changes in gene expression, regardless of their susceptibility phenotype. These data strongly support the first of two models: a: a random effect of irradiation on a homogeneous population of cells, rather than b: of a tumor comprised of a mixture of radioresistant and radiosensitive cell subpopulations. Our findings imply that each of the radio-phenotypes represents different intrinsic characteristics that affect the ability of a tumor to survive radiotherapy.
1. Introduction
Surgery and radiotherapy are the mainstays of treatments for localized primary prostate cancer (PC). Direct comparisons between patients treated with ionizing radiation (IR) and prostatectomy are lacking, and there is no consensus regarding the relative effectiveness of these two therapies [1]. The goal of radiation therapy is to provide the highest dose to the tumor, while at the same time minimizing radiation injury to surrounding healthy tissue. One of the main problems with radiotherapy of PC is the high rate of radio-resistance amongst treated tumors. The lack of a predictive measure to determine the outcome of radiotherapy results in administration of excessive irradiation to a large proportion of patients, or ineffective treatment of patients with radioresistant tumors. Radiation therapy is delivered by either the external or internal (brachytherapy) approach. Today, external radiation therapy is given over a 7 to 8 week period with a total of 65 - 78 Gray (Gy) delivered in 1.8 - 2 Gy fractions to the prostate. Patients can receive low doses (<72 Gy) or high-doses (>/=72 Gy) of external-beam radiotherapy depending on disease severity [1]. Results from randomized clinical trials showed a 45% reduction in disease recurrence among patients assigned to high dose (78 Gy) radiotherapy, compared with those assigned to the standard dose (70 Gy) [2]. Brachytherapy is appropriate for patients with low risk disease, and may be also added to moderate dose (45 Gy) external beam radiotherapy for patients with intermediate-risk disease.
In general, the intracellular cascade of responses to IR occurs through two pathways: 1) Radiation-induced DNA damage inducing conformational alterations and leading to recruitment of DNA repair enzymes, followed by restoration of the higher-order DNA structure. 2) Indirect effects initiating signaling cascades of various receptors (such as EGFR, IGF1R) that stimulate translocation of various proteins from the cytoplasm to the nucleus. The outcome of this dynamic combination is arrest of the cell cycle followed by DNA repair leading to cell survival, apoptotic cell death or senescence [3,4]. In human prostate cancer, the mechanism determining relative sensitivity to irradiation has been related to modifications of a few genes: e.g. mutations in p53 [5,6] and ATM [7], and loss of PTEN [8]. However, these genotypes are found frequently in prostate cancer and do not accurately predict which individual tumor will eventually fail definitive radiation therapy.
Given the complexity of radiation-induced responses, microarray analysis [9] enables to identify a wider range of genes and signaling pathways involved in the response to radiation. While many studies have analyzed the immediate gene-expression response to IR, only a few investigated the long-term response [3]. As expected, it became apparent from these studies that there is no single response to radiation. Genetic background, cell type, IR dose, dose rate and time after IR all influence the transcriptional profile seen after exposure to irradiation [3].
To study the radioresistant/radiosensitive phenotype of adenocarcinoma of the prostate and to identify those patients at risk of relapse after radiation therapy, we defined the effect of irradiation of a group of human PC xenografts grown using the SCID mouse model. Analysis of gene expression profile of these radioresistant and radiosensitive PC xenografts revealed four clusters of expressed genes that could differentiate between radiation resistant and sensitive phenotype. Selected genes from this cluster may be useful markers to enable prediction of the response patients to radiotherapy.
2. Materials and Methods
PC Cell lines and xenografts: Prostate cancer cell lines LNCaP1740, LNCaP10995, PC-3, DU-145, and 22Rv1, were purchased from American Type Culture Collection (Manassas, VA); LAPC4 was obtained from Dr. Charles L Sawyers (University of California, Los Angeles, CA, [10]); CL-1 was obtained from Dr. A. S. Belldegrun (University of California at Los Angeles, Los Angeles, CA, [11]). Cells were grown in RPMI 1640 media supplemented with 2 mM glutamine, 100 u/mL penicillin, 100 mg/mL streptomycin, and 10% FCS. Some cell lines were grown with additional supplements, as follows: LNCaP1740, LNCaP10995 and LAPC4 were grown with 10–9 M testosterone and 5 µg/ml insulin (Sigma-Aldrich Co. St. Louis, MO). DU-145 was grown with 5 µg/ml insulin (Sigma). Cells were incubated in a humidified 37˚C incubator in a 5% CO2 atmosphere.
The LuCaP35 human PC adenocarcinoma xenograft was provided by Dr. R. L. Vessella (University of Washington School of Medicine, Seattle, Washington, USA) [12]. LAPC9 was provided by Dr. C. L. Sawyers (University of California, Los Angeles, USA) [10,13]. CWR22 was established at the Case Western Reserve University and provided by Dr. Tom Pretlow (University of North Carolina-Chapel Hill [14]. WISH-PC14 was established in our laboratory from a patient whose PC relapsed following radiotherapy, as described in detail elsewhere [15]. WISH-PC23 was also established by our group from prostatic adenocarcinoma harvested during palliative trans urethral resection of the prostate performed in a patient with local progression of adenocarcinoma of the prostate, Gleason score 6 (3 + 3). The patient was previously treated with external beam radiotherapy and total androgen blockade. At the time of tumor progression, there were symptoms of bladder outlet, urethral obstruction, and a PSA rise to 18. All xenografts were maintained by serial transfers in 4 - 10-week-old SCID mice (c.b-17/Icr Beige). Mice were grown in the pathogen-free facilities of the Weizmann Institute of Science. All of the surgical procedures were performed under ketamin + xylazine anesthesia (127.5 and 4.5 mg/kg respectively) according to the IACUC regulations.
Single dose irradiation in vitro: Single-cell suspensions were made by dissociating xenograft fragments by mincing them through a stainless still mesh and separation over Ficoll-Paque 400. The cell suspensions were irradiated by a Cobalt 60 source, emitting 65 cGy/min (Gammabeam-150, MDS Nordion). After irradiation, cells or tissue in HBSS medium were mixed with Matrigel (Becton Dickinson, Bedford, MA), and were implanted (5 × 10⁶ cells or small pieces of tumor (80 - 100 mg/mouse) subcutaneously (s.c.) in male SCID mice. Tumor growth was followed for up to a year after irradiation.
PC cell lines cultured in 6-well culture plates at 60% to 70% confluence were irradiated at a rate of 65 cGy/ min. The cells were irradiated at 5, 10, 40, 80 or 160 Gy and incubated until colonies appeared.
Fractionated irradiation: Male SCID mice were inoculated with tumor cells (5 × 10⁶ cells in 0.1 ml of HBSS and 0.1 ml Matrigel) into the right hind thigh of the animal. When tumor volumes reached approximately 150 - 200 mm3, mice were anesthetized (under ketamin + xylazine 127.5 and 4.5 mg/kg, respectively), shielded, allowing only the right hind leg to be exposed, and received fractionated radiation using a Caesium 137 source (at dose rate of 100 cGy/min (Gammacell 40 Exactor, MDS Nordion)). Irradiation was given daily for 5 consecutive days, followed by a two day break, for the total number of fraction as indicated. Tumor growth was followed for up to 1 year after irradiation.
Measurement of tumor growth and sample collection: Local tumor size was determined at weekly intervals by caliper measurements of length, width, and depth, and the tumor volume (mm3) was approximated using the formula: length × width × depth × 0.5236 [16].
Samples were collected from 12 tumors; either un-irradiated or from xenografts that relapsed (2 - 6 months) after irradiation using the highest tolerated dose. Samples analyzed include CWR22 (un-irradiated and survivors of 20 Gy), WISH PC-23 (un-irradiated and survivors of 40 Gy), LuCAP35 (un-irradiated and survivors of 20 Gy and 60 Gy), LAPC9 (un-irradiated and survivors of 80 Gy and 160 Gy) and WISH PC-14 (un-irradiated and survivors of 120 Gy). Samples were kept frozen in liquid nitrogen until their processing for gene array.
Microarray experiments: Total RNA was isolated from frozen tissues using the TRI Reagent (Sigma), according to the manufacturer’s instructions and purified using RNEasy Mini kit (Qiagen, Hilden, Germany), according to the manufacturer’s instructions.
Gene expression was measured using Human Genome U133 plus 2.0 GeneChips (Affymetrix, Santa Clara, CA). Gene Chips were prepared, hybridized, and scanned according to the manufacturer’s instructions. Briefly, 10 µg total RNA was reverse transcribed with a poly-(T) primer containing a T7 promoter. The cDNA obtained was transcribed to produce biotinylated cRNA, which was then hybridized to the GeneChips. The chips were washed and stained with streptavidin phycoerythrin using an Affymetrix FS-450 fluidics station, and data were collected with Affymetrix GeneChip Scanner 3000.
Clustering analysis: Clustering analysis of the gene array data was performed by first selecting probe sets that were present at least in one out of the tested samples (P
1) Identify probe sets whose expression levels increased more than three fold in the irradiated samples (over their matched non-irradiated samples); 967 probesets passed this filter.
2) Select the 2000 most variable probe-sets measured in the tested samples.
3) Mark the 1650 probe-sets that best distinguished the sensitive from the resistant xenografts (non-parametric Wilcoxon Rank Sum test, P < 0.05, FDR 5%). For this process, we grouped the LuCAP35 line (which demonstrated intermediate radioresistant phenotype) with the resistant xenografts (LAPC9, WISH-PC14); when LuCAP35 was grouped with the sensitive xenografts (CWR22 and WISH PC-23), the RankSum test yielded only 593 significant genes (P < 0.05, FDR 5%).
The clustering analysis was based on the 3730 probe sets that fulfilled at least one of the three aforementioned filtering criteria.
The gene clustering operation was done using the Super-Paramagnetic Clustering algorithm [17-20]. The samples and the genes of each cluster were sorted, using the SPIN algorithm [18].
Statistical analysis: Statistical analysis was performed using JMP statistical software (SAS Institute, Inc., Cary, NC). Tumor volume data were analyzed by the Fit model, to test the effect of different doses of irradiation during the experimental period.
Realtime PCR: RNA was reverse transcribed to cDNA from 1 µg of total RNA by using the Reverse Transcription System kit (Promega Corporation, Madison, WI, USA), which was then subjected to quantitative real-time RT-PCR using LightCycler (Roche, Mannheim, Germany) performed according to the manufacturer’s instructions. Specific primer pairs were designed using LightCycler probe design software (Roche Diagnostics, Indianapolis, IN); amplification (in duplicate/triplicate) of selected genes was performed using the LightCycler HotStart DNA SYBR Green I mix (Roche) according to the manufacturer’s instructions. PCR amplification was preceded by incubation of the mixture for 10 min at 95˚C, and the amplification step consisted of 35 - 45 cycles. Denaturation was performed for 10 s at 95˚C, annealing was performed at 60˚C for 10 s, and the extension was performed at 72˚C for 14 s, with fluorescence detection at 72˚C after each cycle. After the final cycle, melting point analysis of all samples was performed within the range of 70˚C - 99˚C with continuous fluorescence detection. A standard curve was generated from one sample in each run. Expression levels of TPT1 (5 prime: 5’- GCACATCCTTGCTAATTTCA-3’ and 3 prime: 5’- CAAGCAGAAGCCAGTTAT-3’, 207 bp) were used for sample normalization. Results for each gene are presented relative to the expression levels in the LAPC9 xenograft. The primers used in these studies were as follows: human RAB26 (5’: 5’-AGTGGACAGACTTTGCC- 3’ and 3’: 5’-GCACGATGTGATTAGCCAG-3’; 193 bp), human H2A variant 2 (5’: 5’-TGTTGGAGTACCTTACGG-3’ and 3’: 5’-GCGTCAGGGTCATTTG-3’; 236 bp), human PTEN (5’: 5’-AGTGGCTAAAGAGCTTTG-3’ and 3’: 5’-ATGGTATATGGTCCAGAGT- 5’, 196 bp), human UCP2 (5’: 5’-GATACCAAAGCACCGTC-3’ and 3’ 5’-GAAGTGAAGAAGTGGCAAGG- 3’, 196 bp).
3. Results
3.1. Radiosensitivity of Prostate Cancer Xenografts and Cell Lines
To determine the gene expression profile of the various human prostate cancer adenocarcinoma xenografts and cell lines, we first evaluated their ability to grow under the skin of SCID mice following either a single in vitro irradiation dose or fractionated irradiation in SCID mice. The range chosen for irradiation, between 4 to 160 Gy, relied on the maximal level of radiation employed in clinical practice (using bracytherapy), which is higher than 140 Gy [19]. Table 1 summarizes the highest dose of IR beyond which no tumor grew. Figure 1 describes the growth curves of representative xenografts. The tested PC xenografts and cell lines exhibited variability in their resistance to radiation, manifesting two phenoltypes: IR sensitive phenotype, exemplified by the CWR22 xenograft, which grew in mice following to a single ex-vivo dose of 20 but did not develop into a tumor for a year following their irradiation with >20 Gy (Figure 1(a)). The IR resistant phenotype is exemplified by LAPC9 (Figure 1(b)), which formed tumors even following to a dose of 160 Gy.
In both of the phenotypes, no change in the growth rate, before or after IR, was observed. Nevertheless, increased doses of irradiation resulted in an increase of the lag time before tumor growth was observed in vivo. The lag time increment, as well as the fraction of mice that developed tumors following IR, are a function of the number of cells that survived IR. The delay in tumor appearance reflects a decline in the viable cell number resulting from the IR.
Determining the sensitivity range for a single IR dose ex-vivo, we next tested whether a similar phenotypic distribution holds for fractionated irradiation, as is actually administered clinically. Hence, we treated the mice using a protocol similar to that applied to prostate caner patients, including a total of 65 - 78 Gy delivered in 1.8 - 2 Gy doses over a 7 to 8 week period. The human PC xenografts were injected into the hind limb of SCID mice and when tumor volume reached the volume of 150-200 mm3, mice were shielded and the exposed tumor bearing limb was irradiated using the Caesium 137 source at the indicated doses (Figure 1). In view of the fact that fractionated radiation is more effective than a single dose, the total dose administered was close to the maximal dose obtained by single dose irradiation. For example, 80% of CWR22, a xenograft that is sensitive to a single dose of radiation (20 Gy), relapsed after fractionated irradiation of total dose of 14 Gy (2Gy × 7) but no relapses were observed with total doses of 20 Gy (2Gy × 10) and 26 Gy (2Gy × 13) (Figure 1(c)). Fractionated irradiation of LAPC9, the most radiation resistant xenograft, showed that following to total dose of 60 Gy (2.5 Gy × 24) tumors relapsed in four out of five mice, but no relapses were observed with a total dose of 75 Gy (2.5 Gy × 30) (Figure 1(d)). These data support the phenotypic classification that was determined based on a single dose of irradiation.
Table 1. Effect of irradiationon the growth of prostate cancer xenografts and cell lines.
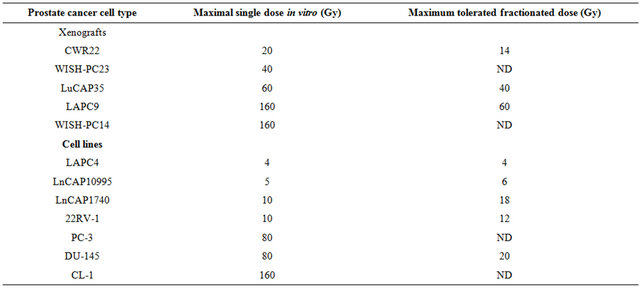
PC cells or pieces (80 - 100 mg) of xenografts were put in dishes and irradiated at 5, 10, 40, 80 or 160 Gy. The cells or xenograft beads were then injected/implanted s.c. to SCID mice. For fractionated irradiation in vivo, cells derived from xenografts or small pieces were implanted into the right hind thigh of SCID mice. After reaching a size of around 200 mm3, mice were shielded except for their tumor bearing leg and were sub-lethally irradiated by daily doses (five sessions per week) for the total dose as indicated. The values shown represent maximal irradiation dose in which PC xenografts or in-vivo cells grew. Samples were taken from all xenografts before and after irradiation.
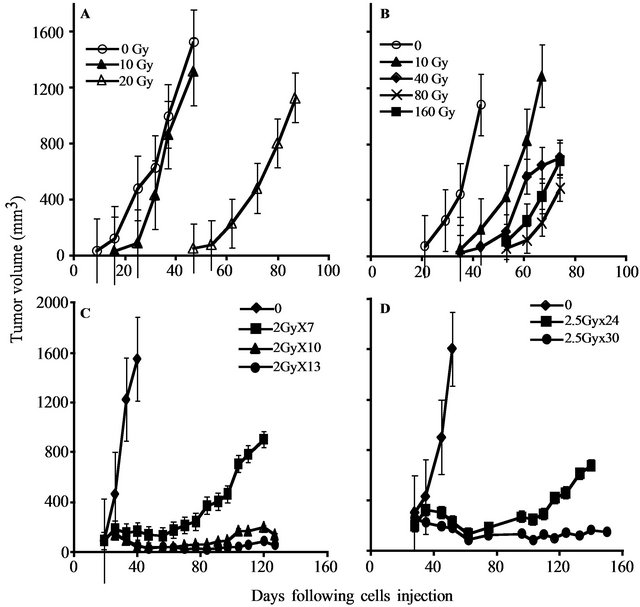
Figure 1. PC xenograft growth in SCID mice following irradiation: The figure depicts the growth in SCID mice of representative PC xenografts (shown in Table 1) with or without irradiation. (A, C) CWR22, (represents the radiosensitive and LAPC9 (B, D) represents the radioresistant xenografts. Xenografts were either irradiated ex-vivo by the indicated single dose (A, B) before their transplantation or by fractionated irradiation (C, D) in vivo. The tumor volume shown represents an average of five mice/group. Kinetics of tumor growth were measured until >50% of the mice died (the values shown represent averages of mice that developed tumor).
3.2. Comparison of the Gene Transcription Profiles between the Two IR Phenotypes
To describe and compare the transcription patterns between IR resistant and sensitive xenografts, we hybridized cRNA from non-irradiated and irradiated xenografts to an oligonucleotide microarray (Affymetrix, U133P2), containing probes corresponding to 54,613 human transcripts. Gene expression profiling of 12 experimental samples was performed, four of which were derived from radiation-sensitive xenografts: CWR22 (un-irradiated and cells surviving 20 Gy) and WISH PC-23 (un-irradiated cells, and those surviving 40 Gy), and five samples were processed from radiation-resistant xenografts: LAPC9 (un-irradiated and cells surviving of 80 Gy and 160 Gy) and WISH PC-14 (un-irradiated and cells surviving of 120 Gy). Another xenograft sample was LuCAP35 (un-irradiated and surviving of 20 Gy and 60 Gy) that represented an intermediate level of IR sensitivity (Table 1).
Unsupervised analysis of the data was conducted to search for clusters shared by either IR resistant or sensitive PC xenografts. We used 3730 probe-sets that passed the filtering process, as described in the Materials and Methods, and performed a clustering analysis employing the Super-Paramagnetic Clustering algorithm (SPC) [17,20]. Additionally, we performed PCA (Principal Component Analysis) that shows the ability of the genes that comprise the identified clusters to differentiate between resistant and sensitive samples. The 3730 probe sets yielded six stable clusters (Supplementary Figure 1). Because the expression profiles have been obtained for non-irradiated and irradiated cells of the same origin (see comparison below), for all the analyses we used data from both samples. Next, we further clustered the samples, one at a time, based on each stable gene cluster that was described above [21]. We identified four clusters displaying different behavior between the resistant versus the sensitive xenografts in non-irradiated samples (Figure 2). Two clusters (Clusters 2 and 3) showed higher expression levels in the resistant xenografts (WISHPC14 and LAPC9, while the other two clusters (Clusters 5 and 6) were more highly expressed in the IR sensitive xenografts (CWR22 and WISH-PC23). The LuCAP35 cell line displayed a non-uniform behavior; for some groups of genes it clustered with the IR resistant samples (clusters 2 and 6) while for others it clustered with the sensitive samples (clusters 3 and 5). Cluster 2 consisted
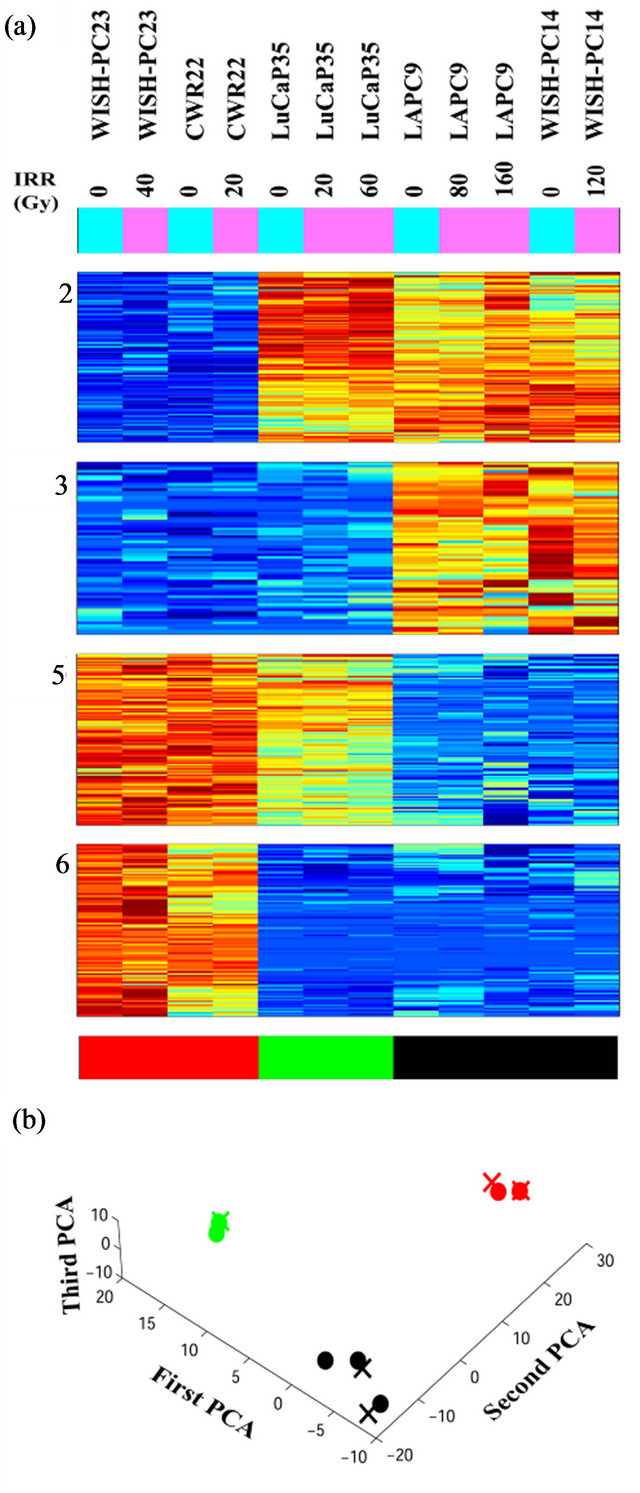
Figure 2. Clusters that separate the radio-sensitive from the radio-resistant PC phenotypes; (a) Expression matrix of 4 clusters consisting 456 probesets (corresponding to 113 genes (rows) and 12 PC xenograft samples (columns). The genes are centered and normalized, and ordered according to the sorter algorithm. The color represents increase (red) or decrease (blue) in gene expression. PC xenografts are ordered according to their sensitivity to IR (see color bar in the bottom of the expression matrix); red represents the Sensitive xenografts (WISH-PC23 in columns 1 and 2 and CWR22 in columns 3 and 4), green represents the Semiresistant xenograft (LuCap35 in columns 5-7), and black represents the Resistant xenografts (LAPC9 in columns 8 and 9 and WISH-PC14 in columns 11 and 12). The upper color bar indicates the non-irradiated (light blue) versus the irradiated (pink) cells, and the maximal irradiation dose used. (b) Representation of the distance relationship between the 12 samples by PCA analysis. The Sensitive, Resistant and Semi-resistant samples are marked by red, black and green dots, respectively. X, Y and Z-axis represents the first, second and third principal components, respectively.
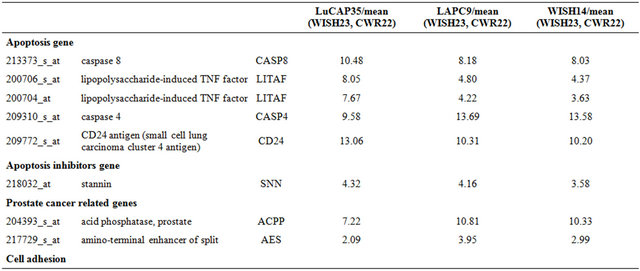
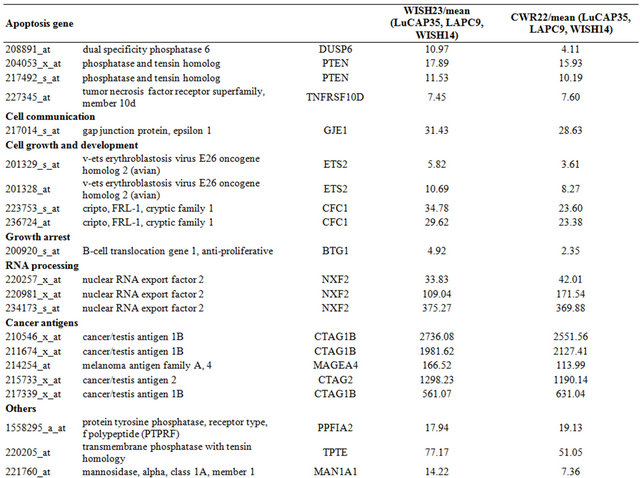
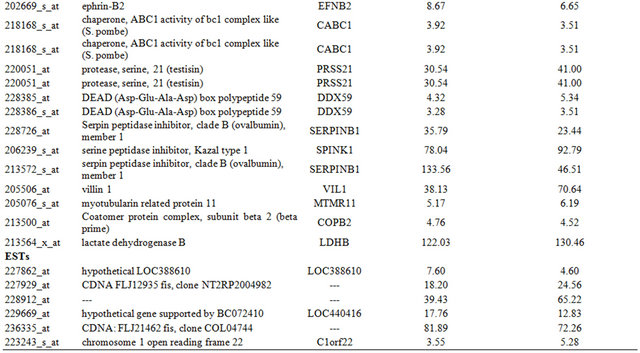
of 157 probe-sets and cluster 3 consisted of 66 probe-sets that were highly expressed in the resistant samples. We focused on a set of 87 (including 7 ESTs) probe sets (out of the 223 probe sets contained in clusters 2 and 3) that displayed at least 3-fold up-regulation in the resistant samples, compared to the average expression levels of the sensitive samples. The up-regulated genes that were highly expressed in the IR resistant samples (Supplementary Tables 1 and 2) included a number of genes involved in cell survival and death such as: Cell growth genes: SNN, KLK2, ACPP; angiogenesic factors AGTR1, IL1R1, ZNF323, FMNL2, KLF13 and PTK7, DNA repair genes, e.g. H2AFJ, HIST1H2BK, HIST1H2BD and SMARA1, Cell death genes: CASP8 and 4, LITAF, GULP and UCP2 and an inhibition of cell growth gene: IFITM3.
The opposite picture was seen in clusters 5 and 6, which consisted of 117 and 116 probe-sets, respectively, which were highly expressed in the IR sensitive cells relative to the resistant lines. We focused on a set of 71 (including 7 ESTs; (Supplementary Tables 3 and 4) that displayed up-regulation of at least 3-fold in the sensitive compared to the average expression levels of the resistant samples. These include a number of genes that are involved in cell death and survival, e.g.: Cell death and apoptosis genes such as TP53, PTEN, DUSP6. Interestingly, this group included also increased expression of genes involving in Growth and survival promotion, including ETS2, CFC1, RAB26, and ATF7.
PCA clearly shows the same differences that have been seen in the clustering analysis (Figure 2(b)). It demonstrates that the groups representing the resistant xenografts (WISH-PC14 and LAPC9), the sensitive ones (CWR22 and WISH-PC23) and LuCAP35 each differ in their gene expression profiles. This observation may reflect the inherent properties of the response to irradiation. Altogether, the data presented so far identify 456 probesets (113 genes) that differentiate between the IR resistant and IR sensitive phenotypes. Table 2 summarizes the ratio of expression between several genes in these two IR phenotypes according to their functional affiliation.
To confirm the microarray data and to establish its reproducibility, we selected candidate genes and tested their expression using quantitative RT-PCR. We selected one gene per cluster, based on the gene expression analysis described above (cluster 2- H2AFJ, cluster 3-UCP2, cluster 5-RAB26, cluster 6-PTEN). The expression of these genes, when measured by Q-PCR, confirmed the Gene Chip analysis (data not shown).
3.3. Microarray Data of Radioresistant/Sensitive PC Cell Lines Shortens the List of Phenotype-Predictive Genes
To confirm the data obtained from the PC xenograft
Table 2. Summary of gene expression in the radio-resistant and radio-sensitive cells.
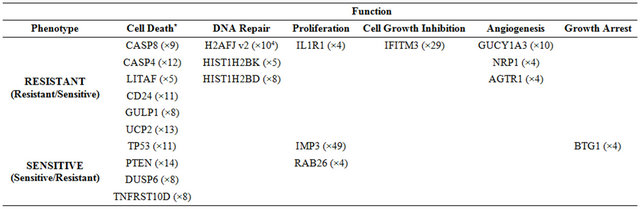
*Numbers in parenthesis represent the fold expression.
analysis and to identify a more limited list of genes that are significantly able to differentiate between sensitive and resistant samples, we used an additional and independent set of 7 PC cell lines; four of them were shown to be radiation sensitive and three resistant (Table 1). RNA isolated from these cells was subjected to gene array on the same array used for above. The expression profile of the 456 probesets that differentiated between the IR resistant and sensitive xenografts (Figure 3) were tested on the cell-line data. Using this approach, we identified 46 probe sets (corresponding to 41 genes) that best distinguished between the radioresistant/sensitive phenotypes (using t-test, p < 0.01, FDR 10%, Figure 3). The pattern of expression of this set of 41 genes may provide a transcriptional signature to predict the response of a prostate tumor to radiotherapy, an option that should be further validated.
3.4. Irradiation Does Not Impact the Long-Time Pattern of Gene Expression.
To explore whether irradiation affects the gene expression profile of the surviving PC cells, we compared the gene expression data obtained from the xenografts before and several months after their irradiation and growth in mice. We applied two supervised approaches, both of them based on the 10,000 genes with the highest standard deviation across the 12 samples. First, we performed a RankSum test in attempt to identify genes that can distinguish between non-irradiated and irradiated samples from radiation sensitive cell lines. In the second approach we carried out a Two Way ANOVA test to determine the relationships between the irradiation effects and radiation resistant/sensitive phenotype. Our analysis showed no statistically significant probe-sets, and we concluded that irradiation of the PC xenografts did not induce any significant changes in gene expression, regardless of their susceptibility phenotype (data not shown).
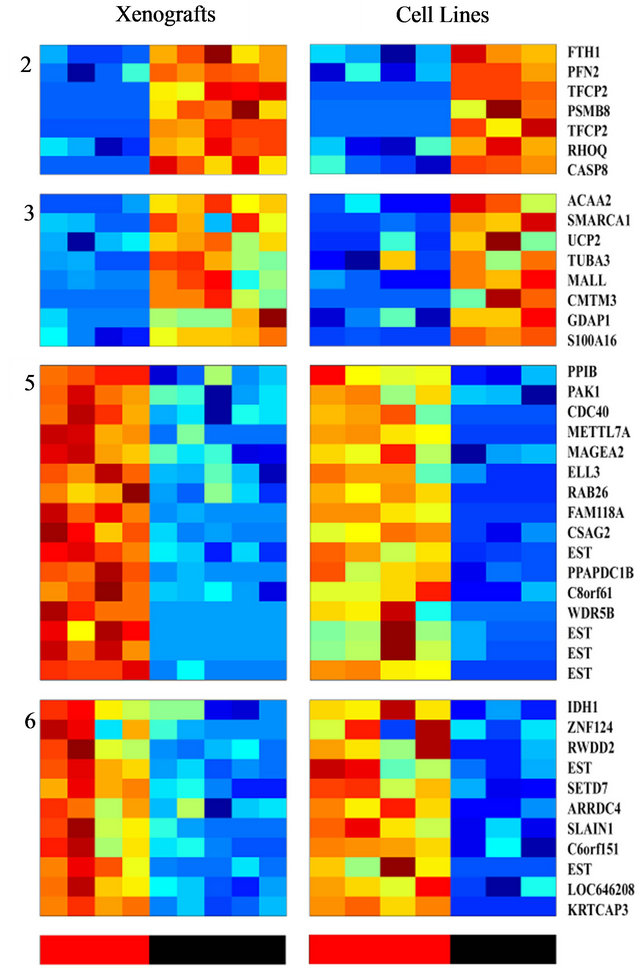
Figure 3. Clustering of genes whose expression differentiates between the radio-sensitive and the radio-resistant pheotypes, and are shared by both PC xenografts and cell lines; The expression matrix contains 46 probe sets (corresponding to 41 genes) out of the 456 previously identified probesets that best distinguish between the radioresistant/sensitive phenotypes (using t-test, FDR 10%) in the xenogratfs and in the cell line data. The color bars at the bottom mark the Sensitive (red) and the Resistant (black) samples.
3.5. Models for Radioresistant/Sensitivity of Prostate Cancer
We considered two possible models for the different responses seen following irradiation can be considered:
Model a (Figure 4(a)): Existence of two distinct subpopulations within a given xenograft. According to this model, the cell population within each xenograft consists of a mixture of two typesIR sensitive (S) and IR resistant (R) cells. Most of the sensitive cells die a short time after IR (some sensitive cells survive because of the stochastic effects of IR), while most of the resistant cells survive (though a small fraction will also die).
According to this model, in a sensitive xenograft, most of the population before IR consists of sensitive cells and only a small fraction contains resistant cells. A few months after exposure to IR, the ensemble of the cell population changes and the resistant population dominates. In the resistant xenografts, the majority of the cells resist IR. After a few months, there is a reduction in the sensitive population, but since it was small to begin with, the composition of the population before and after the IR
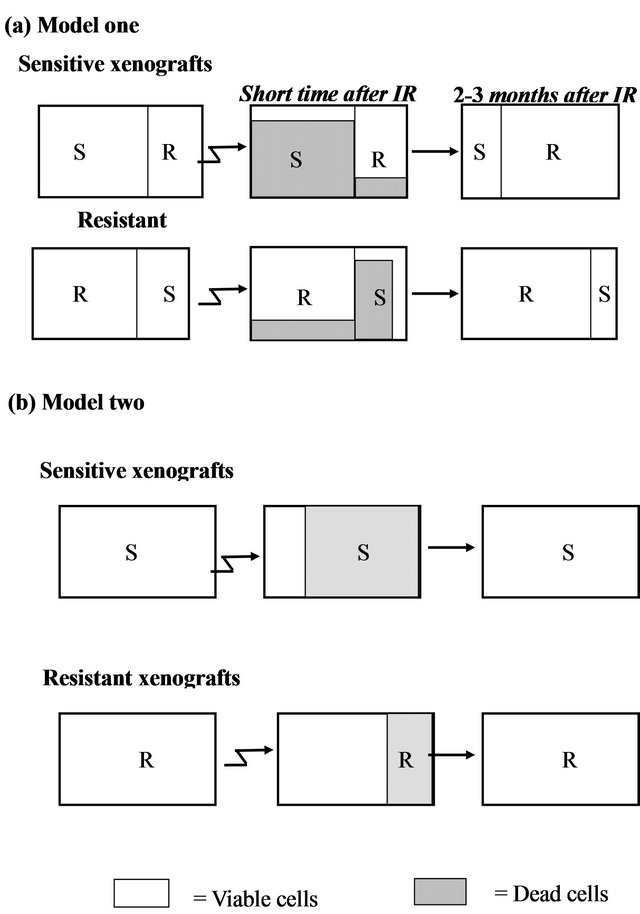
Figure 4. Two hypothetical models for radioresistance/sensitivity of prostate cancer xenografts: (a) Model a: two distinct subpopulations within a given xenograft; (b) Model b: each xenograft contains a homogeneous population of cells that have equal chance to survive/die after irradiation.
does not change significantly. Thus, if this model is correct, we predict that following irradiation, sensitive xenografts will convert from dominantly sensitive (S) to dominantly resistant (R) sub-populations. This would be expected to cause a change in the gene expression profile before versus after IR. For the resistant xenografts, no significant change is expected to occur within the subpopulations after irradiation and therefore no change in gene expression is expected.
Model b (Figure 4(b)): Each xenograft is homogeneous, and all cells within a xenograft have about the same chance to survive/die after irradiation. According to this model, each tumor contains a cell population that responds uniformly to radiation. Thus, every cell in a given xenograft has nearly the same probability of dying from IR. The probability of dying is greater for a sensitive cell, than for a resistant one. Thus, a short time after radiation, most of the cells in the sensitive xenograft die, but only a small fraction of those in the resistant xenograft die. In this case, a few months after IR we expect the population ensemble of each phenotype to remain unchanged. According to this model, no significant gene expression changes are expected in the tumors on a population level, in either the sensitive or in the resistant xenografts.
The similarity in the gene expression patterns between the non-irradiated and irradiated xenografts support Model b (Figure 4(b)) which asserts a random effect of the irradiation on a homogeneous population of cells. Each xenograft has a different intrinsic phenotype that influences its capability to survive the IR. Model a, which suggests mixtures of resistant and sensitive cells, apparently does not accurately describe this system.
4. Discussion
In this study we have established the gene expression profile that distinguishes between radiation resistant and radiation sensitive human prostate cancer. For decades, IR has been used therapeutically to treat primary prostate tumors and its bone metastases. Because of the high failure rate (5-year biochemical failure rate of 10% - 40%) after external-beam radiation therapy [22] we expect our data to help in the selection of patients who can benefit from this therapeutic approach. We hope that the genetic profile described here will provide specific parameters that can predict the long term treatment outcome, or identify prostate cancer patients who are not expected to respond to radiotherapy. Such patients could be offered alternative treatment modalities (e.g. surgery).
To prevent artifacts corresponding to the immediate effects of IR on gene expression, our experimental system was based on human PC xenografts whose radioresistant/sensitive phenotype was previously determined (Table 1). In general, tumor xenografts are better representative of the patient’s than cell lines and therefore the core of our findings is based on a cohort of xenorafts. By analysis of the gene array data (Supplementary Figure 1) employing unsupervised two-way hierarchical clustering, we identified four gene clusters displaying different expression behavior across the resistant and the sensitive xenografts (Figure 2). Two clusters showed higher expression levels in the resistant xenografts and the other two clusters showed higher expression levels in the sensitive xenografts. The expression of 113 genes was significantly changed (p < 0.01 and at least 3 fold) in sensitive compared to resistant xenografts. By comparing this list of genes derived from the PC xenografts to the data obtained using PC cell lines 41 genes shared a similar pattern in distinguishing between the irradiation sensitive and resistant phenotypes (Figure 3). These genes represent a primary list of genes whose expression may represent a genetic signature to predict the outcome of a given prostate tumor to radiotherapy. Nonetheless, further validation using clinical material is required to translate these data for patients’ diagnosis.
The genes in the list represent several cellular mechanisms (such as DNA repair, cell death (apoptosis, oncosis), angiogenesis and cell growth (Supplementary Tables 1-4). As such, they embody the complexity of the molecular processes involved in radioresistance/sensitivity. The genes whose transcription differentiates between the radioresistant and radiosensitive PC xenografts do not necessarily reflect the immediate mechanisms that either doom or rescue a given cell from a given dose of irradiation. Nevertheless, considering these limitations, it is of interest to point out and describe several of the genes whose transcription pattern differentiates between the radioresistant and radiosensitve phenotypes in the context of their cellular function (summarized in Table 2). Several of these genes, such as TP53 and PTEN were previously reported to be related to radioresistance (5 - 8). These two tumor suppressor and pro-apoptotic genes are up regulated after radiotherpy, and it was found that deregulation (or deletion in of these genes) contributes to the radiation resistance of some cancers (e.g. prostate, glioma) [23]. In our study, these two genes were downregulated or not-expressed in the radioresistant xenografts.
Comparing the data obtained in this study concerning the effect of IR on PC xenografts, with data obtained from other types of human cancers could identify a common set of genes related to the radiorestant/sensitive phenotypes. Several groups investigated the long-term transcriptional response to irradiation. Kitahara et al. examined the molecular profiles of radioresistant cervical squamous cell carcinoma versus sensitive cancers and showed that the expression of 62 genes could predict IR resistant versus sensitive tumors [24]. Vellant et al. compared the gene expression of B-cell chronic lympocytic leukemia (B-CLL) cells that were either sensitive or resistant to radiation. Sixteen genes were differentially regulated by at least 2 fold in the resistant cells [25]. Fukuda et al. studied six esophageal cancer cell lines that were treated with continuous fractionated irradiation and compared expression profiles of each parent to its radioresistant clones using a cDNA microarray. Nineteen up-regulated and 28 down-regulated genes were common to radioresistant cell lines [26]. The study of the cervical cancer [24] response to IR, suggested that radioresistance is maintained via increased expression of a DNA repair component (XRCC5/Ku80), while in leukemia it is potentially mediated by up regulation of anti-apoptotic (e.g. c-IAP1, c-rel) and growth control (c-myc) gene [25]. Radiosensitivity in these studies was associated with an increased expression of MAP kinase signaling genes (24, 25) In oesophageal carcinoma cells [26], IR resistance was shown to be related to upregulation of anti-apoptotic (BIRC2 related to IAP family) and growth control (COX and CD73). Interestingly, none of these gene products were included in the short list in our screen. Since our study is based only on transcriptional analysis, it can only provide a superficial indication to the complex mechanisms that are involved in the radiorsistance/sensitivity of PC. Our gene expression list show an increased expression of DNA repair associated genes such as H2AFJ, HIST1H2BK, HIST1H2BD and loss of the two tumor suppressor genes (PTEN and p53) in the radioresistant samples. In our radiosensitive PC xenografts an increase in growth factors related to the EGF gene family (CFC1), RAS oncogene family (RAB26) and IGF-2 binding protein 3 (Supplementary Table 2). Taken together, and with the reservations mentioned above, our studies indicate that several key functional pathways to be associated with the cell fate following irradiation. Resistant prostate cancer samples displayed an increase in DNA repair components and decrease in apoptotic components, both are the hallmarks of the radioresistant phenotype. Similarly, in IR-sensitive tumors, a common feature is the elevation of growth factor gene expression. Apparently, such an increase is associated with enhanced cell division, thereby rendering the cell more sensitive to IR. It is likely that the end phenotype is determined by equilibrium between these gene products. Nevertheless, the exact role of these genes in the acquisition of tumor resistance to radiation still remains to be elucidated.
Finally, comparing the gene expression profiles of the various xenografts before and several months after irradiation, revealed that practically all the transcriptional profiles remained unchanged regardless of the response of the PC xenografts to IR. This result may suggest that out of the two models suggested to account for the nature of the cell composing the radiosensitive and radioresistat prostate tumors (Figure 4), the second model which suggests the random effect of irradiation on a homogeneous population of cells, more accurately reflects the response of these cells. Each xenograft has a different intrinsic character that influences its capability to survive IR. Model 1, which suggests that different subpopulations with different sensitivities to irradiation exist within the tumor, is apparently not operative in this system. In a similar protocol to ours, yet using other systems, two groups studied the profile of gene expression between irradiated and non-irradiated normal lymphocytes and kidney, long after irradiation. However, unlike our studies, these analyses showed differences in gene expression before versus after irradiation. Flats et al. [27] reported that the number of genes that were differentially expressed between irradiated and non irradiated human lymphocytes was increased with time following IR. Kruse et al. [28]) who studied the effect of IR on normal murine kidneys, found that with time following IR, the expression of genes that underwent down-regulation was increased and the number of genes that underwent upregulation was decreased. A possible explanation to the discrepancy between these studies using normal tissues and ours, using malignant tissues, is that normal tissues are most likely heterogeneous in nature, while the prostate cancer xenografts consisted of a more homogeneous population.
Overall, the transcriptional patterns that distinguish between radioresistant and radiosensitive prostate cancer xenografts hold promise, after their further validation, to serve as a predictive tool, to determine right at early diagnosis, which PC patient will benefit from irradiation or resort to other treatment. Our finding suggests that both radioresistant and radiosensitive tumors are composed from homogeneous population in term of their response to irradiation, implies that with a proper design of the irradiation dose and schedule of its administration to the radiosensitive tumors, a complete cure of localized primary tumors with less side effects is feasible.
5. Acknowledgements
We are grateful to Dr. J. Pinthus for his outstanding assistance in the characterization of the PC xenografts generated at the Weizmann Institute of Science, Dr. Shirly Horn Saban for conducting the gene array analysis, Dr. Shelley Schwarzbaum for manuscript editing, and Dr. Tatyana Rabin for her helpful advice.
This study was supported in part by the Prostate Cancer Foundation, the Wolfson Foundation, the Ridgefield Foundation, by research grants from Ms Marion Achtentuch and from the Kuhn Family. We dedicate this article to the memory of Mr. Michael Dobrin.
REFERENCES
- T. M. Pisansky, “External-Beam Radiotherapy for Localized Prostate Cancer,” The New England Journal of Medicine, Vol. 355, No. 15, 2006, pp. 1583-1591. doi:10.1056/NEJMct055263
- A. Pollack, G. K. Zagars, G. Starkschall, J. A. Antolak, J. J. Lee, E. Huang, A. C. von Eschenbach, D. A. Kuban and I. Rosen, “Prostate Cancer Radiation Dose Response: Results of the M. D. Anderson Phase III Randomized Trial,” International Journal of Radiation Oncology*Biology*Physics, Vol. 53, No. 5, 2002, pp. 1097-1105. doi:10.1016/S0360-3016(02)02829-8
- A. R. Snyder and W. F. Morgan, “Gene Expression Profiling after Irradiation: Clues to Understanding Acute and Persistent Responses?” Cancer and Metastasis Reviews, Vol. 23, No. 3-4, 2004, pp. 259-268. doi:10.1023/B:CANC.0000031765.17886.fa
- M. H. Bourguignon, P. A. Gisone, M. R. Perez, S. Michelin, D. Dubner, M. D. Giorgio and E. D. Carosella, “Genetic and Epigenetic Features in Radiation Sensitivity Part I: Cell Signalling in Radiation Response,” European Journal of Nuclear Medicine and Molecular Imaging, Vol. 32, No. 2, 2005, pp. 229-246. doi:10.1007/s00259-004-1730-7
- P. J. Colletier, F. Ashoori, D. Cowen, R. E. Meyn, P. Tofilon, M. E. Meistrich and A. Pollack, “AdenoviralMediated p53 Transgene Expression Sensitizes Both WildType and Null p53 Prostate Cancer Cells in Vitro to Radiation,” International Journal of Radiation Oncology* Biology*Physics, Vol. 48, No. 5, 2000, pp. 1507-1512. doi:10.1016/S0360-3016(00)01409-7
- J. M. Lee and A. Bernstein, “p53 Mutations Increase Resistance to Ionizing Radiation,” Proceedings of the National Academy of Sciences of the United States, Vol. 90, No. 12, 1993, pp. 5742-5746. doi:10.1073/pnas.90.12.5742
- Z. Fan, P. Chakravarty, A. Alfieri, T. K. Pandita, B. Vikram and C. Guha, “Adenovirus-Mediated Antisense ATM Gene Transfer Sensitizes Prostate Cancer Cells to Radiation,” Cancer Gene Therapy, 7, No. 10, 2000, pp. 1307- 1314. doi:10.1038/sj.cgt.0243
- C. J. Rosser, M. Tanaka, L. L. Pisters, N. Tanaka, L. B. Levy, D. C. Hoover, H. B. Grossman, T. J. McDonnell, D. A. Kuban and R. E. Meyn, “Adenoviral-Mediated PTEN Transgene Expression Sensitizes Bcl-2-Expressing Prostate Cancer Cells to Radiation,” Cancer Gene Therapy, Vol. 11, No. 4, 2004, pp. 273-279. doi:10.1038/sj.cgt.7700673
- G. Bucca, G. Carruba, A. Saetta, P. Muti, L. Castagnetta and C. P. Smith, “Gene Expression Profiling of Human Cancers,” Annals of the New York Academy of Sciences, Vol. 1028, 2004, pp. 28-37. doi:10.1196/annals.1322.003
- K. A. Klein, R. E. Reiter, J. Redula, H. Moradi, X. L. Zhu, A. R. Brothman, D. J. Lamb, M. Marcelli, A. Belldegrun, O. N. Witte and C. L. Sawyers, “Progression of Metastatic Human Prostate Cancer to Androgen Independence in Immunodeficient SCID Mice,” Nature Medicine, Vol. 3, No. 4, 1997, pp. 402-408. doi:10.1038/nm0497-402
- C. L. Tso, W. H. McBride, J. Sun, B. Patel, K. H. Tsui, S. H. Paik, B. Gitlitz, R. Caliliw, A. van Ophoven, L. Wu, J. deKernion and A. Belldegrun, “Androgen Deprivation Induces Selective Outgrowth of Aggressive Hormone-Refractory Prostate Cancer Clones Expressing Distinct Cellular and Molecular Properties Not Present in Parental Androgen-Dependent Cancer Cells,” The Cancer Journal, Vol. 6, No. 4, 2000, pp. 220-233.
- E. Corey, J. E. Quinn, K. R. Buhler, P. S. Nelson, J. A. Macoska, L. D. True and R. L. Vessella, “LuCaP 35: A New Model of Prostate Cancer Progression to Androgen Independence,” Prostate, Vol. 55, No. 4, 2003, pp. 239- 246. doi:10.1002/pros.10198
- N. Craft, C. Chhor, C. Tran, A. Belldegrun, J. DeKernion, O. N. Witte, J. Said, R. E. Reiter and C. L. Sawyers, “Evidence for Clonal Outgrowth of Androgen-Independent Prostate Cancer Cells from Androgen-Dependent Tumors through a Two-Step Process,” Cancer Research, Vol. 59, No. 19, 1999, pp. 5030-5036.
- M. A. Wainstein, F. He, D. Robinson, H. J. Kung, S. Schwartz, J. M. Giaconia, N. L. Edgehouse, T. P. Pretlow, D. R. Bodner, E. D. Kursh, et al., “CWR22: Androgen-Dependent Xenograft Model Derived from a Primary Human Prostatic Carcinoma,” Cancer Research, Vol. 54, No. 23, 1994, pp. 6049-6052.
- A. Bar-Shira, J. H. Pinthus, U. Rozovsky, M. Goldstein, W. R. Sellers, Y. Yaron, Z. Eshhar and A. Orr-Urtreger, “Multiple Genes in Human 20q13 Chromosomal Region Are Involved in an Advanced Prostate Cancer Xenograft,” Cancer Research, Vol. 62, No. 23, 2002, pp. 6803- 6807.
- M. E. Gleave, J. T. Hsieh, H. C. Wu, A. C. von Eschenbach and L. W. Chung, “Serum Prostate Specific Antigen Levels in Mice Bearing Human Prostate LNCaP Tumors Are Determined by Tumor Volume and Endocrine and Growth Factors,” Cancer Research, Vol. 52, No. 6, 1992, pp. 1598-1605.
- M. Blatt, S. Wiseman and E. Domany, “Superparamagnetic Clustering of Data,” Physical Review Letters, Vol. 76, No. 18, 1996, pp. 3251-3254.
- D. Tsafrir, I. Tsafrir, L. Ein-Dor, O. Zuk, D. A. Notterman and E. Domany, “Sorting Points into Neighborhoods (SPIN): Data Analysis and Visualization by Ordering Distance Matrices,” Bioinformatics, Vol. 21, No. 10, 2005, pp. 2301-2308.
- S. E. Langley and R. Laing, “Prostate Brachytherapy Has Come of Age: A Review of the Technique and Results,” BJU International, Vol. 89, No. 3, 2002, pp. 241-249. doi:10.1046/j.1464-4096.2001.01610.x
- K. Kannan, N. Amariglio, G. Rechavi, J. Jakob-Hirsch, I. Kela, N. Kaminski, G. Getz, E. Domany and D. Givol, “DNA Microarrays Identification of Primary and Secondary Target Genes Regulated by p53,” Oncogene, Vol. 20, No. 18, 2001, pp. 2225-2234. doi:10.1038/sj.onc.1204319
- G. Getz, E. Levine and E. Domany, “Coupled Two-Way Clustering Analysis of Gene Microarray Data,” Proceedings of the National Academy of Sciences of the United States, Vol. 97, No. 22, 2000, pp. 12079-12084. doi:10.1073/pnas.210134797
- S. L. Scott, P. H. Gumerlock, L. Beckett, Y. Li and Z. Goldberg, “Survival and Cell Cycle Kinetics of Human Prostate Cancer Cell Lines after Singleand Multifraction Exposures to Ionizing Radiation,” International Journal of Radiation Oncology*Biology*Physics, Vol. 59, No. 1, 2004, pp. 219-227. doi:10.1016/j.ijrobp.2004.01.027
- E. H. Chang, K. F. Pirollo and K. B. Bouker, “Tp53 Gene Therapy: A Key to Modulating Resistance to Anticancer Therapies?” Molecular Medicine Today, Vol. 6, No. 9, 2000, pp. 358-364. doi:10.1016/S1357-4310(00)01767-6
- O. Kitahara, T. Katagiri, T. Tsunoda, Y. Harima and Y. Nakamura, “Classification of Sensitivity or Resistance of Cervical Cancers to Ionizing Radiation According to Expression Profiles of 62 Genes Selected by cDNA Microarray Analysis,” Neoplasia, Vol. 4, No. 4, 2002, pp. 295-303. doi:10.1038/sj.neo.7900251
- L. Vallat, H. Magdelenat, H. Merle-Beral, P. Masdehors, G. P. de Montalk, F. Davi, M. Kruhoffer, L. Sabatier, T. F. Orntoft and J. Delic, “The Resistance of B-CLL Cells to DNA Damage-Induced Apoptosis Defined by DNA Microarrays,” Blood, Vol. 101, No. 11, 2003, pp. 4598-4606. doi:10.1182/blood-2002-06-1743
- K. Fukuda, C. Sakakura, K. Miyagawa, Y. Kuriu, S. Kin, Y. Nakase, A. Hagiwara, S. Mitsufuji, Y. Okazaki, Y. Hayashizaki and H. Yamagishi, “Differential Gene Expression Profiles of Radioresistant Oesophageal Cancer Cell Lines Established by Continuous Fractionated Irradiation,” British Journal of Cancer, Vol. 91, No. 8, 2004, pp. 1543-1550. doi:10.1038/sj.bjc.6602187
- S. Falt, K. Holmberg, B. Lambert and A. Wennborg, “Long-Term Global Gene Expression Patterns in Irradiated Human Lymphocytes,” Carcinogenesis, Vol. 24, No. 11, 2003, pp. 1837-1845. doi:10.1093/carcin/bgg134
- J. J. Kruse, J. A. te Poele, A. Velds, R. M. Kerkhoven, L. J. Boersma, N. S. Russell and F. A. Stewart, “Identification of Differentially Expressed Genes in Mouse Kidney after Irradiation Using Microarray Analysis,” Radiation Research, Vol. 161, No. 1, 2004, pp. 28-38. doi:10.1667/RR3097
Abbreviations
IR, ionizing radiation; PC, prostate cancer; PSA, prostate specific antigen; PCA, principal component analysis.
Supplementary
 (a) (b)
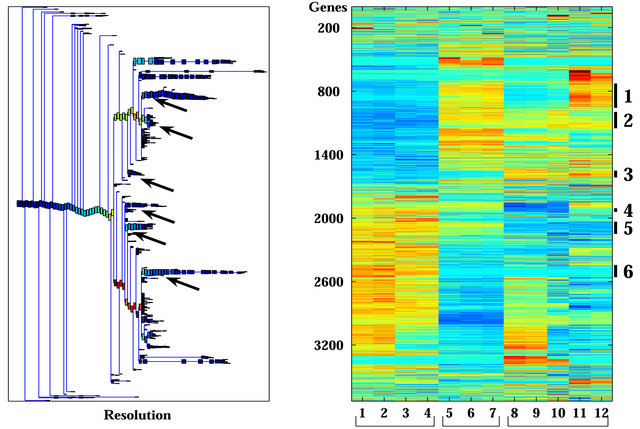
Figure 1. Clustering results using super-paramagnetic clustering for the 3730 probe sets that passed through one of three filters. (a) Dendrogram of the genes that includes clusters (each box represent a cluster) of size 3 and larger. The red arrows mark the six clusters analyzed; (b) Expression matrix of the 12 samples. The genes (row) are normalized and ordered according to the dendrogram on the left. The color represents induction (red) or repression (blue). The six clusters are marked by black lines at the right hand side of the matrix. The samples are divided according to their sensitivity to the IR (see bottom of the matrix). The “Sens” (sensitive samples) group includes the WISH-PC23 (columns 1 and 2) and CWR22 (columns 3 and 4) xenografts, the “Semi-Res” (Semi-resistant samples) group includes the Lucap35 (columns 5-7) xenograft, and the “Res” (Resistant samples) group includes the LAPC9 (columns 8-10) and WISH-PC14 (columns 11 and 12) xenografts.
Table 1. Probe sets of the genes in Custer 2 that are up-regulated in IR-resistant xenografts: the probe sets in the table manifest > 3 fold change in their expression compared to IR-sensitive samples.
Continued
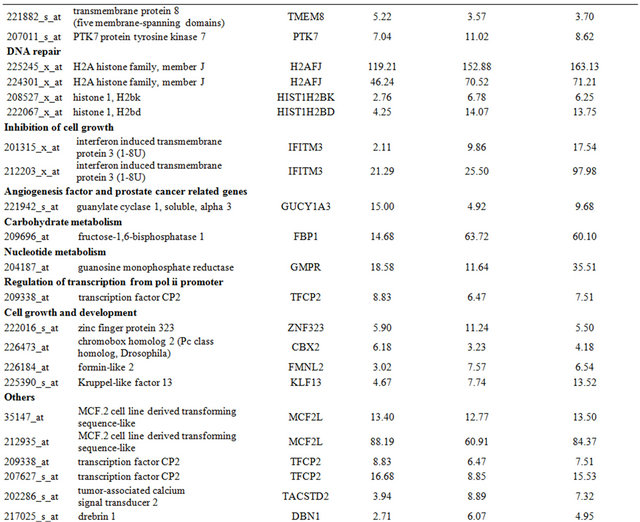
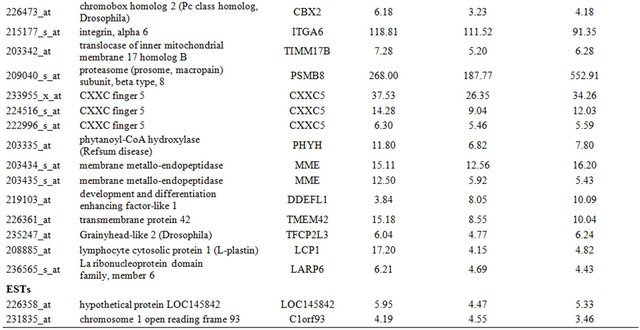
Table 2. Probe sets of the genes in Custer 3 that are up-regulated in IR-resistant xenografts: the probe sets in the table manifest > 3 fold change in their expression compared to IR-sensitive samples.
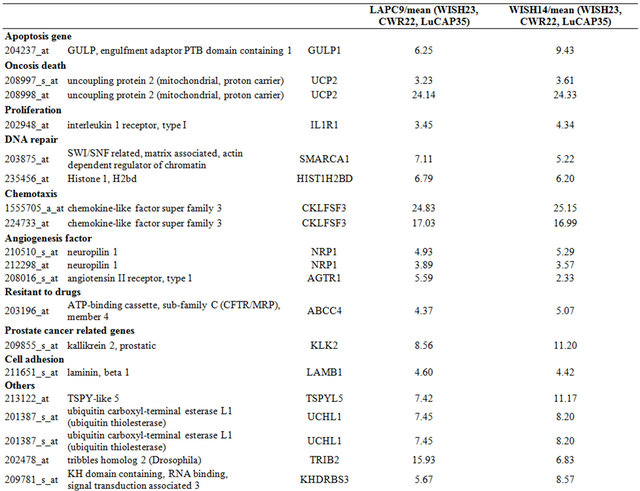
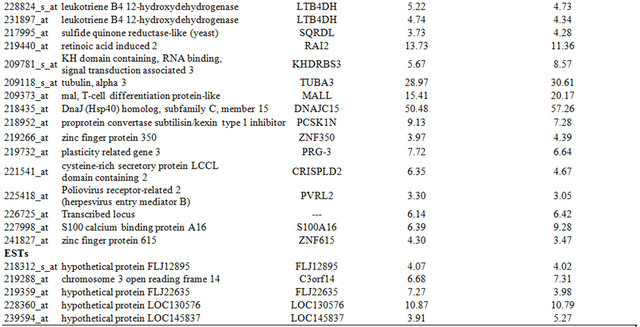
Table 3. Probe sets of the genes in Custer 5 that are up-regulated in IR-sensitive xenografts: the probe sets in the table manifest > 3 fold change in their expression compared to IR-resistance samples.
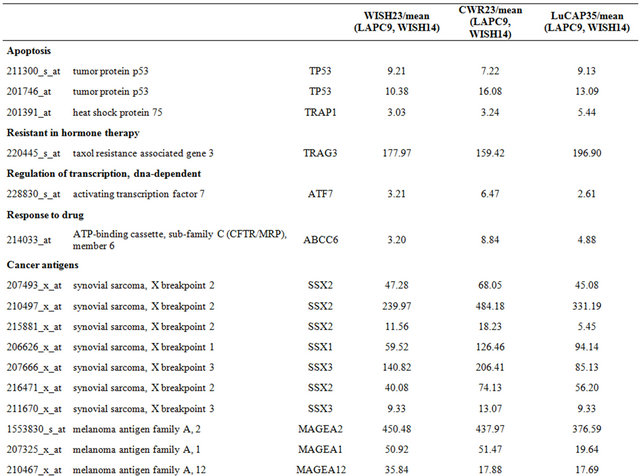
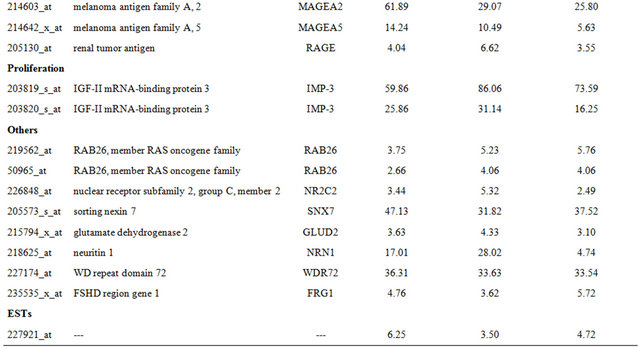
Table 4. Probe sets of the genes in Custer 6 that are up-regulated in IR-sensitive xenografts: the probe sets in the table manifest > 3 fold change in their expression compared to IR-resistance samples.
NOTES
*Corresponding author.