iBusiness
Vol.4 No.1(2012), Article ID:18366,11 pages DOI:10.4236/ib.2012.41003
Linking Consumer Perception of Store Image Using FANP
![]()
Department of Marketing Management, Shih Chien University Kaohsiung Campus, Taiwan, Chinese Taipei.
Email: ling@mail.kh.usc.edu.tw
Received October 6th, 2011; revised December 1st, 2011; accepted December 11th, 2011
Keywords: Consumer Perception; FANP; Store Image
ABSTRACT
Both theoretical and practical efforts in store image often neglect the characteristics that have interactions and mutual influence among attributes or criteria, even in the stages of different brand life cycles. This study aims at creating a hierarchical framework for the store image managements. The analytical network process and fuzzy sets theory have been applied to both share of mind in store image and inherent interaction/inter-dependencies among diverse information resources. A real empirical application has been demonstrated for retailers. Both the theoretical and practical background of this paper have shown that fuzzy analytical network process can capture consumer’s perception existing incomplete and vague information for the mutual influence on attribute and criteria of the store image attributes.
1. Introduction
The extant literature on the attractiveness of retail stores has focused predominantly on the critical influence of store image. Store images have been increasingly considered on primary topics for many marketing businesses [1]. Utilizing the ideal store image is not only assisting enterprises to establish market positions, but also protect brands avoiding threats from other competitors [2]. An area that has generated a great deal of interest among researchers is consumers’ emotive response to store image.
Here, the conceptualization of consumers’ retail behavior is based on a stream of information about store image that enters their cognition and affects their perception [3-5]. In the store image researches, the development of marketing strategies exist a significant status as well as being activities. The study of the attributes representative of a store’s image that influence its patronage has evolved to reflect the tangible and intangible aspects of consumer perception [6,7]. While the determinants of store image have been extensively covered in the literature [8,9], most of the analyses are largely based on relationship among the variables.
The majority ignore the inter-dependent on interactive characteristics among the dimensions, attributes of store images, even though the feedback between the store images and different store life cycles, which cause the weakness of the hierarchical frameworks in store images. Furthermore, the consumers exists the difference of perception on the unique posture of brand images in their psychological position subjectively. This unique posture is as the same concept as the “share of mind” cited by Temporal [10] and there is fuzzy and vague cognition in consumers’ mind. Erdem, Swait & Louviere [11] classify the uncertain information into three parts: 1) The unquantified information; 2) The incomplete information; 3) The unobtained information. This uncertain information will appear on the dimensions, attributes of store images. It will transmit to consumers and influence consumers’ preference on choosing store s on buying the products.
While solving the problem of uncertain source, the traditional multiple attribute decision-making (MADM) cannot deal with the fuzzy characteristics efficiently for consumers’ subjective perceptions [12]. Traditional MADM assumed that the information sources involved on noninteractive/independent. However, the store images which the enterprise established full of some inherent interaction/inter-dependencies among diverse information in many real problems. Instead of the traditional MADM method, this study adopts the fuzzy analytical network process (FANP) to deal with the qualitative characteristics that consumers own their vague preference structures on store images. On the other hand, the grade of importance on interdependencies among the dimensions, attributes of store image can be obtained, and then establish the difference of indexes of the store image in the retail company.
The rest of this paper is structured as follows: in the next section, the proposed store image valuation procedure is presented and an overview of the techniques used in our model is given. Section 3 will discuss the procedure and results of an empirical study. In Section 4, we present our conclusions on the results reported in this paper.
2. Proposed Model
Store image evaluations generally involve the questions of three aspects: 1) The unique status of store images emerging in the consumers psychological position through linguistics have subjective fuzzy cognitions; 2) The multicriteria levels in the dimensions of store images and marketing communication tools; 3) The feedback effect between different store life cycles and store image dimensions. This study addresses the issue of combining both store image dimensions and attributes using FANP along with the interaction in the store life cycles.
2.1. The Hierarchy Construction of Store Image
This study establishes network hierarchical process of store image by the factor analysis with consumers to collect relational variables. The purpose is to understand the consumers’ cognitions, the share of mind in store image with fuzzy sets concepts, among the inter-depend characteristics of store life cycles. Therefore, the whole goal of store image can be decomposed by store image dimensions and its attributes, in which the interrelationships in different store life cycles and the feedback effects with store image dimensions.
2.2. Determining the Fuzzy Linguistic Degree of Store Image
Throughout the fuzzy concept, it is assumed that consumers use the linguistic weighting set Nk, Nk = {medium, a little important, important, very important, extremely important} (k = 1, 2, , 5), to evaluate the relative importance among the inner-dimensions, inner-attributes of store images in the brand life cycles. The fuzzy linguistic scales are illustrated in Figure 1.
2.3. Fuzzy Pairwise Comparisons Matrices between Dimensions and Attributes of Store Image
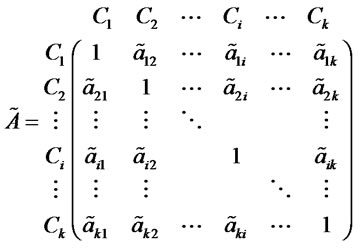
In this step, consumers are asked to respond to a series of fuzzy pairwise comparisons where two attributes at a time will be compared with respect to an upper level dimension of store images. For example, the question asked of the consumers is, “What is the relative impact on attribute Ci (i = 1, 2, , k) when compared to attribute Cj (j = 1, 2,
 , k) in specific dimension of store images?” Thus, we can use triangular fuzzy numbers
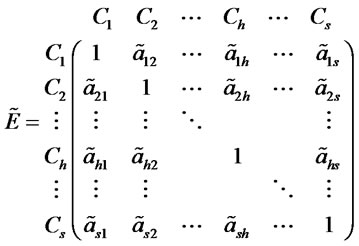
  to construct fuzzy comparisons matrices of store image on matrix
 .
.
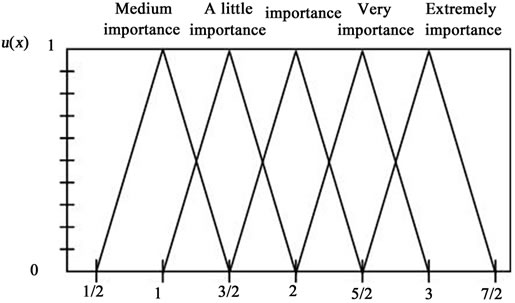
Figure 1. Fuzzy linguistic scales for the importance of store images.
where, .
.
2.4. Fuzzy Pairwise Comparison Matrices of the Interdependence in Inner-Dimensions and Inner-Attributes
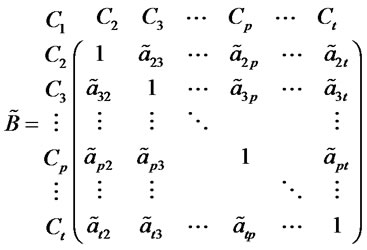
In order to reflect the interrelationship of store images, the pairs-comparative matrix should be constructed separately for inner-dimensions and inner-attributes. Matrix
 is the fuzzy pairs-comparative matrix of interdependence of inner-dimensions between Cp and Cq (p, q = 12,
 , t; p ≠ q). In addition, Matrix
  is the fuzzy pairs-comparative matrix of interdependence of innerattributes between Ci and Cj (i, j = 1, 2,
 , k; i ≠ j). For instance, the store dimension of within-category assortment, attached its attributes for “the functional characteristics”, “the symbolized characteristics” and “the pricing characteristics”, exists a certain degree of fuzzy relations. Then, the fuzzy assessment matrix based on some specific store attribute should consider the positive on negative effect from other store attributes.
where, .
.

where, .
.
2.5. Fuzzy Pairwise Comparison Matrices of the Feedback between Store Dimensions and Store Life Cycles
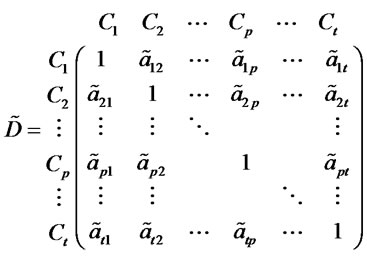
The feedback effect between store dimensions and store life cycles should consider two aspects. The first is based on different store life cycles which consumers evaluate the relative importance of store dimensions. The other is as the foundation with varies store dimensions which consumers evaluate the relative importance of different store life cycles. Matrix  is the fuzzy pairs-comparative matrix of feedback based on the different store life cycles to evaluate the relative importance between store dimensions Cp and Cq (p, q = 1, 2,
 , t; p ≠ q). Matrix
  is another fuzzy pairs-comparative matrix of feedback based on the diverse store dimensions to evaluate the relative importance between store life cycles Ch and Cl (h, l = 1, 2,
  , s; h ≠ l).
where, .
.
where, .
.
2.6. Calculating the Weighting Vector by Extent Analysis
This study adopts modified extent analysis and the principle of fuzzy pairs-comparative matrix to evaluate different weight vectors in the hierarchical network framework of store images. The reason to utilize the modified extent analysis is that the extent analysis method cannot estimate the true weights from a fuzzy comparison matrix. The extent analysis methods do not represent the relative importance of store image criteria and cannot be used as their priorities. Wang et al. [13] demonstrate that the misapplication of the extent analysis method to fuzzy problems may result in wrong decisions to be made and some fuzzy comparison matrices information to be wasted.
This problem can be well resolved by well resolved by using the modified fuzzy LLSM developed in Wang et al. [14], which derives the priorities of the triangular fuzzy comparison matrix through the solution of the following constrained nonlinear optimization model.
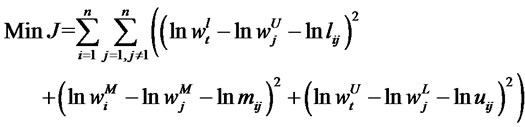
 (1)
(1)
The optimum solution to the above model forms normalized triangular fuzzy weights , i = 1, 2,
 n. Global fuzzy weights can be obtained by solving the following two linear programming models and an equation for each store image alternative Ak (k = 1, 2,
  K):
K):
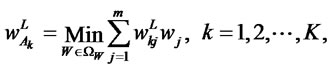 (2)
(2)
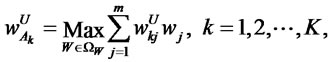 (3)
(3)
 (4)
(4)
where

is the space of weights,  is the normalized triangular fuzzy weight of criterion j = 1, 2,
 m, and
 is the normalized triangular fuzzy weight of store image alternative Ak with respect to the criterion
 .
.
2.7. Supermatix Formation and Analysis
The FANP supermatrix allows for a resolution of the effect of interdependence that exists among the store life cycles, store dimensions and attributes. The supermatrix is a partitioned matrix, where each submatrix is composed of a set of relationships between and within levels as represented by the consumers’ graphic model. The unweighted supermatrix mutation for brand images used in this study as maxtrix M:
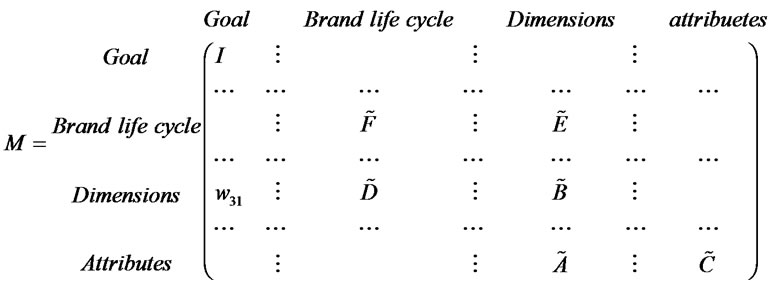
where I is the identity matrix, w31 is a vector that represents the impact of the goal on the store dimensions. ,
,  and
and  represent the inner relation ships among store life cycles, store dimensions and store attributes separately. Matrix
  and
and  represent the feedback effects between store life cycles and store dimensions.
In the unweighted supermatrix the columns may not be column-stochastic (i.e. do not sum to one). A transformation is required for the columns to become columnstochastic (this transformation forms a weighted supermatrix) and thus minimized the possibility for divergence to infinity on convergence to zero. On transformation process proposed by Saaty [15,16] to make the supermatrix column-stochastic is to weight the components according to their impact on the column of blocks. The row components of the non-zero column blocks within the supermatrix are compared according to that column block. We shall assume each column block weighting to be a 0.5. The component block weights are then multiplied to each of the respective column elements. Finally, raising the supermatrix M to the power 2k + 1 and 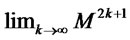 where k is an arbitrarily large number, allows convergence of the interdependent relationships among store life cycles, store dimensions and attributes.
3. Application
An empirical study was conducted in one major Taiwan city with oral interviews based on standardized questionnaires and 560 respondents. To ensure the sample was representative of food store shoppers, quota sampling was undertaken, taking into consideration the age and gender distribution of grocery shoppers in Taiwan.
Each respondent was asked about one specific retail store in the city. Seven different stores were chosen as stimuli (the seven stores most often mentioned in pre-tests as places where respondents did their grocery shopping), i.e., 80 questionnaires were completed for each retail store. The seven stores represent different store formats: superstores/hypermarkets (Dollars, Taisuco), Discounters (Lidl, Wepay, Plus), Supermarkets (Matsusei), and the grocery department of a large department store (Miramar). It was also ensured that each respondent did grocery shopping at least occasionally in this city, so that the respondent was able to evaluate the local shopping situation.
3.1. The Dimensions and Attributes of Store Image
The first objective of the research was to derive basic dimensions of store images in retailing. As mentioned, the retail companies were evaluating an item battery of different store images and the respondents were asked to indicate to what degree they strive for superiority in that specific area.
The ten items that were included in the survey were analyzed by factor analysis. Since independence of the basic dimensions was not theoretically argued, nonorthogonal factor rotation was used (PCA, oblimin rotation, Kaiser normalisation), which allows for correlation of the factors. The Kaiser-Meyer-Olkin (KMO) measure of sampling adequacy was 0.655 and the  of Bartelett’s test of sphericity was 265.2 (sign. = 0.000), so that factor analysis of the sample data seems suitable. The results of the factor analysis are given in Table 1.

Table 1. The relevant sentence and category of brand images.
Through the classification process of factor analysis, this study obtains the store image of retailing and constructs the 5 dimensions and 22 items of attribute index. While “the location convenience” includes four items of attribute index, “the atmosphere of the shop” includes five kinds of attribute index, “the price” includes four items of attribute index, “the variety of merchandize” includes four items of attribute index and “the sales and services” includes five items of attribute index. The structure of the brand image index in the whole department store is shown in Figure 2.
3.2. The Assessment of the Store Image Index in the Retail Store
3.2.1. FANP Model Construction
The fuzzy analytical network process framework of store image has been established through the questionnaire survey and code result by factor analysis. This part focuses on the interaction of store image life cycles and the interdependence how to influence the store image dimensions for overall image index. For example, the “store image fortification” stage of the department store would be
Figure 2. The FANP decision structure of retail store image index.
interference at certain degree from different stage of the “store image introduction” and the “store image elaboration”, which influence the image impression in consumers’ cognitions. Under this situation, the importance degree of image dimensions in each retail store would also have the difference with the whole image index. The following will present the analysis result.
3.2.2. The Evaluation Result of Fuzzy Pairwise Comparisons Matrices
The FANP questionnaire investigation puts emphasis on the establishment and calculation of fuzzy pairwise comparison matrices. The assessment result was explained as follows:
1) Fuzzy pairwise comparisons matrices between dimensions and attributes.
The consumers were asked to evaluate the relative importance degree between store image dimensions and attributes by linguistic scales. The linguistic scales and variables were shown in Figure 1. Through the fuzzy arithmetic operation, the fuzzy pairwise comparisons matrices from consumers can be synthesized. Furthermore, the importance degree of image attributes under different dimension can be obtained by the procedure of modified fuzzy LLSM approach.
2) The feedback effect between the store image life cycles and image dimensions.
This part takes the importance degree of image dimensions under different image store life cycles into consideration. In addition, the feedback effect of image dimensions comes from three stags at image life cycles. In order to fully describe such two-way relationship, the eight fuzzy comparisons matrices should be established. The questionnaire focus on how to draw the positive and feedback effects of comparisons matrices out. For example, “in the introduction stage of the image life cycle, how more important is ‘the atmosphere of shop’ than ‘the location convenience’ among image dimensions?” And “in the atmosphere of shop, how more important is ‘the introduction stage’ than ‘the elaboration stage’ of the image life cycle?” The consumers are asked to compare the image dimensions at a given level on a pairwise basis to estimate relative importance in relation to the image life cycles at the proceeding level. In this study, modified fuzzy LLSM approach is used to represent subjective pairwise comparisons of feedback relations in order to capture the vagueness. The analysis result can be shown in Table 2.
From Table 2, in the introduction stage of store image, the most importance degree is “the location convenience” among image dimensions in the retail store. As to newly department store, facing the saturation in the urban area, will select the second best location for the established site. In addition, in order to meet the modern novelty consumers’ requirements, the business will create the comfortable space for parking and traffic cozy. In Table 2, the feedback effect of “the location convenience” has more important influence on the introduction stage of store image in the retail store. So the result of two-way relation appears to the consistent characteristics.
3) Fuzzy pairwise comparisons matrices of interdependencies.
According to the analytical network process structure of the store image index, the interdependence of different store image life cycles, the interrelationship of store dimensions and store attributes should be furthermore explained as follows. Firstly, it is necessary to control a certain stage of the store image life cycle for the reciprocation relations in the structure of network. Table 3 shows the relative importance degree of different brand life cycles controlled with the fortification stage.
Secondly, the store image of retail business among image dimensions exist the relation with reciprocation. The certain dimension should be controlled and then analyses the relative importance degree of other image dimensions which influence the controlled dimension. Through synthesizing the consumers’ subjective preference judgments, the analysis result of “the location convenience” as the controlled factor can be shown in Table 4.

Table 2. The fuzzy comparisons matrix of store image life cycles under “the location convenience”.

Table 3. Fuzzy importance assessment controlled with the “fortification stage”.
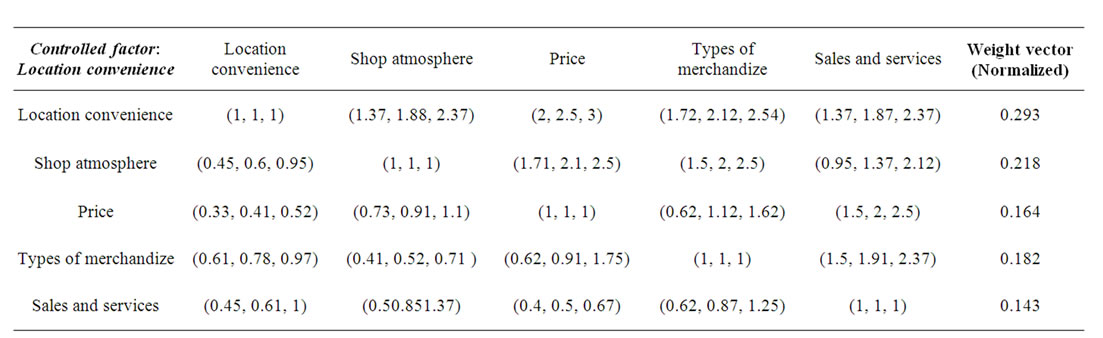
Table 4. Fuzzy importance assessment controlled with “the location convenience”.
Finally, the store attributes which were attached to each dimension of store images exist the inner relationship. A certain image attribute should be controlled under every dimension of store image, and then analyses the relative importance degree of other attributes to influence the certain image attribute. According to Figure 3, it is necessary to build up four fuzzy pairwise comparison matrices for the attributes and the normalized weighted matrix has been shown in Table 5. The assessment values of the interdependency among the store attributes would be combined into the supermatrix for synthesis operations.
4) Supermatrix Analysis.
The supermatrix is decomposed matrix aimed to solve the interactions between various kinds of the critical elements in the structure of FANP.
For convergence to occur, i.e. a lone-term stable set of normalized weights, the resulting supermatrix needs to be “column stochastic”. MATLAB package are used to calculate convergence values, from which the importance weights of individual store image dimensions and attributes can be obtained. Raising the supermatrix to the power (2k + 1) where k is on arbitrarily large number, allows convergence of the interdependent relationships. In this study, convergence is reach at . The “loneterm” stable normalized weighted values to be used in the analysis as shown in Figure 3, the converged supermatrix.
5) The assessment of the store image dimensions.
The difference of membership degree value of store image dimensions can be evaluated. Furthermore, the store image indices of the seven retailing stores need to be compared for understanding their shortcomings and inadequacy. The comparative difference of the image dimensions among
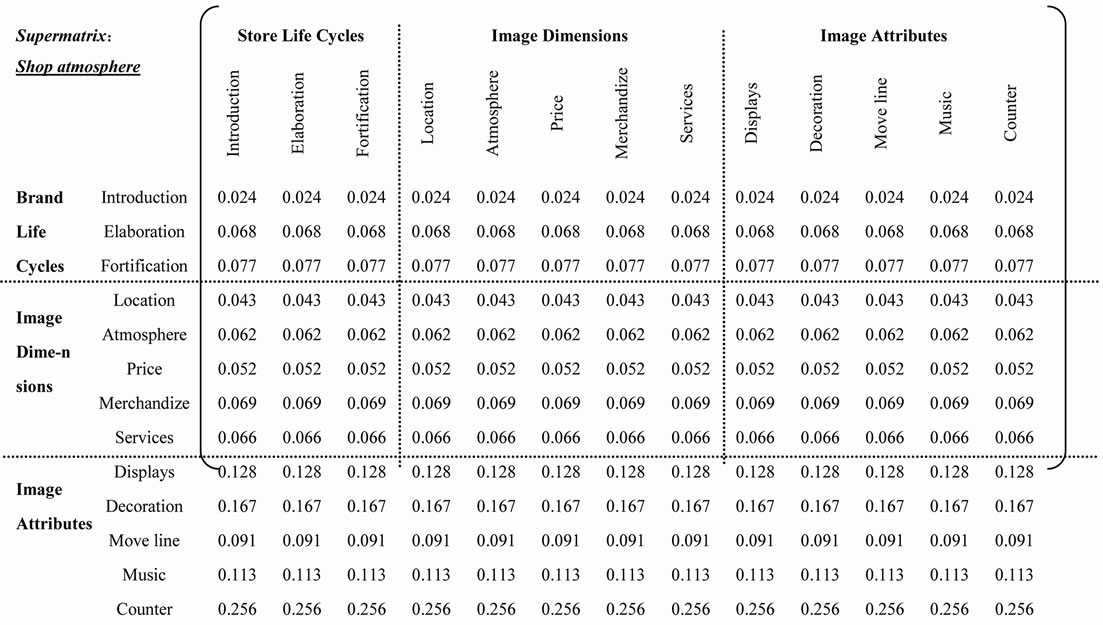
Figure 3. Supermatrix for the store image life cycles’ interdependencies resulting in convergence (M42).
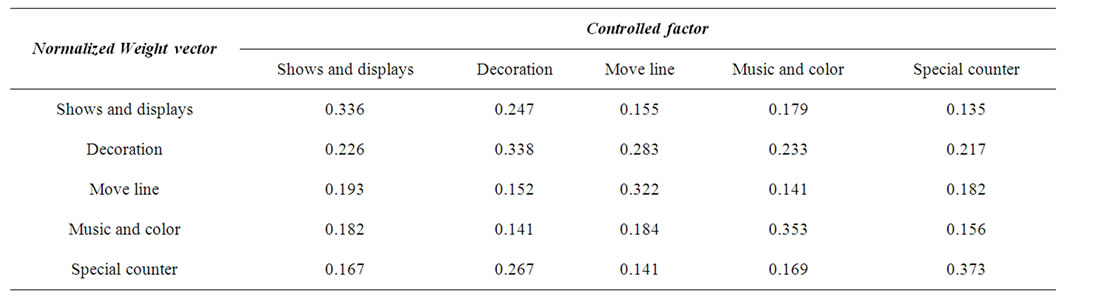
Table 5. Fuzzy importance assessment of interdependency among image attributes.
the retailing stores are shown as in Figure 4.
Figure 4 shows the image values of “price” and “types of merchandize” obviously more important than each retailing store. Especially, Plus retailing store has the least image degree in the image dimensions of “sales and services”. The reason may be occurred from the establishment stage of the retailing store positioned at the cross-periods with the declining period of the city and the developing period of the border area in the center of Taiwan. In addition, the retailing store lies in the adjacent place of commercial circles of Taichung, the biggest city in the center of Taiwan with the most intensive and crowded area. Therefore, the overall image of “sales and services” is not fit with consumers’ expectations. This is the inferior position of Plus retailing store and also a challenge needing to make a breakthrough.
The image dimension of “the types of merchandize” is obviously insufficient in the Tasico retailing store. This result maybe comes from the position of diversification in this company and the general merchandise department only accounts for 50% of all floors (relatively smaller than Dollars and Miramar). The floors distributions focus on the large-scale film city, electricity playing games area, the health club and network coffee shops. Thus, the variety of merchandize with the dress department of the general merchandise appear the weaker impression to consumers’ cognitions.
In sum, the image index of “the location convenience” and “shop atmosphere” present less important degree show from Figure 4. At the same time, Lidle retailing store also has the lowest image index for these two indices. It is necessary to improve the image of this part which aided from the other dimension support of “the sales and service”. Through the connection and link relationships among image dimensions, the overall image of the retailing store would be promoted to superior.
4. The Ranking of Fuzzy Numbers
This study adopts modified LLSM approach with the concept of the possibility degree to compare the ranking of fuzzy numbers. Two reasons of the method have been adopted as follows. It can avoid the overlay conflict with the ranking state of uncertainty. Besides, the ranking inconsistency from the sets of threshold value subjectively can be reduced. For the sake comparison, we have used Buckley [17] and Zhu & Lee [18] method to treat the same problem. The resulting comparisons for images attributes with respect to each importance degree were obtained individually as follows:
4.1. The Ranking of Fuzzy Numbers with Buckley [17]
Take the image of “the sales and services” for example, the fuzzy numbers of attached image attributes with its normalized fuzzy numbers adopting Buckley’s method have been shown in Table 6.
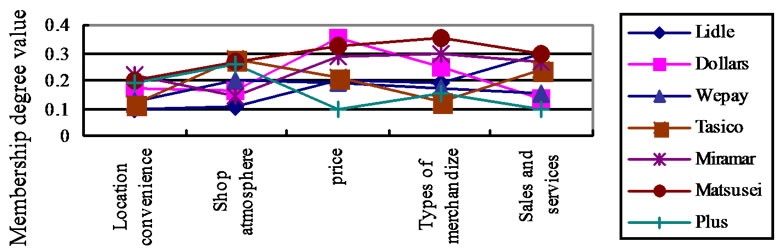
Figure 4. The comparison between the whole image dimensions in every retail store.

Table 6. The analysis result of the ranking of fuzzy numbers.
According to Buckley’s fuzzy ranking method, the importance degree of images attributes can be distinguished as follows:
{Personels’ etiquette and attitude} > {the professional knowledge} > {exchange a purchase and goods} > {After-sale services} > {service mechanics}
From above-mentioned results, the importance degree of “the after-sale service” and “service mechanics” is belonged into the same class and unable to explicit the impression degree each other.
4.2. The Ranking of Fuzzy Numbers with Zhu & Lee [18]
We utilize Zhu & Lee’s method to rank the fuzzy numbers, through the change of the threshold value Q, conducting the sensitive analysis of alternatives. Take the same example for the image dimension of “the sales and services”, the attributes of importance degree attached to the image dimension were compared in Figure 5. The threshold value is assumed by Q = 9 and compare the spread of fuzzy number among the image attributes.
The importance degree of image attributes belonged to the image dimension with “the sales and services” has been shown in Table 7.
From Table 7, the importance degree difference of “the after-sale service” and “the service mechanics” is still unable to present the ranking difference. In addition, the importance degree of image attributes would produce the different sequencing results by the adjustment of the threshold vale.
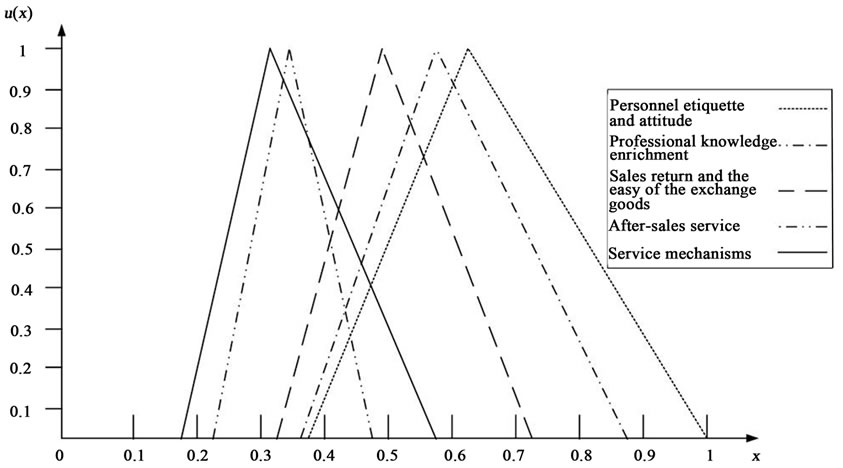
Figure 5. The fuzzy spread of image attributes with “the sales and services”.
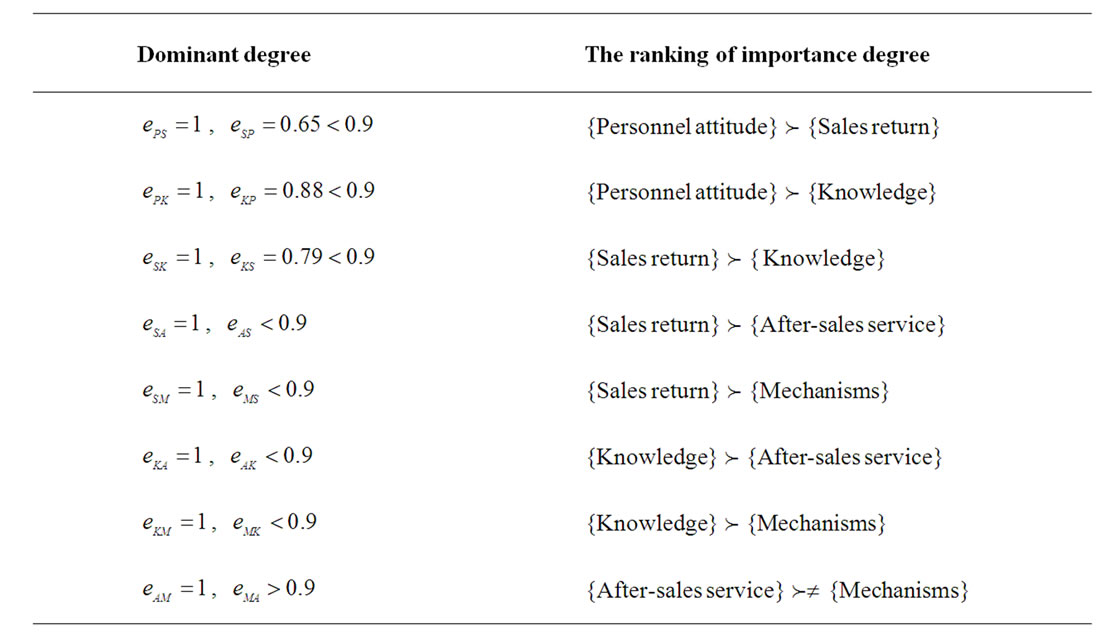
Table 7. The importance degree ranking of image attributes.
4.3. Assessment Results
From the assessment result of above-mentioned three kinds of methods, the importance degree difference of image attributes with “the after-sale service” and “the service mechanics” attached to the image dimension of “the sales and service” is not obvious, especially adopting the Buckley and Zhu & Lee’s ranking methods of fuzzy numbers. However, this study utilizes the concept of the possibility degree of modified LLSM analysis to distinguish the ranking consistence efficiently and effectively. Other image attributes roughly present the unanimous situation comparing the Buckley and Zhu & Lee’s methods with modified LLSM analysis. It can be obviously find that modified LLSM analysis possesses more advantages with the concept of possibility degree than the two kinds of other methods.
5. Conclusions
In setting up the analysis hierarchy process of the store image specialty, the assumption of the independence in the same dimension ignoring the interrelationships and interdependence between image attributes and the inconsistency with the comparison matrix often cause the biased result partially. Besides, the consumers’ assessment procedures usually imply the subjective linguistic inputs which present the inherent ambiguous perceptions to require effect in store image evaluation. This study attempts to join the fuzzy set concept onto analytic network process and adopts FANP method to solve the interdependence and feedback effect properly among image dimensions and attributes.
In this way, the FANP model not only can solve the independent unreasonable assumption, but also can describe the interrelationship among the store image life cycles and the feedback between the image dimensions and different stages of image life cycles. According to the analysis result, the images of each department store can be built or improved based on the consumers’ fuzzy cognitions. The application extrapolated the fuzzy set theory to the analytical network process with the development and planning of image characteristics provides the innovative research direction.
REFERENCES
- N. J. Ashill, M. Frederikson and J. Davies, “Strategic Marketing Planning: A Grounded Investigation,” European Journal of Marketing, Vol. 37, No. 3-4, 2003, pp. 430-460. doi:10.1108/03090560310459032
- B. Hall, “A New Model for Measuring Advertising Effectiveness,” Journal of Advertising Research, Vol. 42, No. 2, 2002, pp. 23-31.
- G. Birtwistle, I. Clarke and P. Freathy, “Store Image in the UK Fashion Sector: Consumer versus Retailer Perceptions,” International Review of Retail, Distribution and Consumer Research, Vol. 9, No. 1, 1999, pp. 1-16. doi:10.1080/095939699342651
- J. Semeijn, A. C. R. van Riel and A. B. Ambrosini, “Consumer Evaluations of Store Brands: Effects of Store Image and Product Attributes,” Journal of Retailing and Consumer Services, Vol. 11, No. 4, 2004, pp. 247-258. doi:10.1016/S0969-6989(03)00051-1
- A. C. R. Van Riel, J. Lemmink and H. Ouwersloot, “Consumer Evaluations of Brand Extensions: Differences between Goods and Services,” Journal of Service Research, Vol. 3, No. 3, 2001, pp. 220-231. doi:10.1177/109467050133003
- D. J. Burns and H. B. Warren, “Need for Uniqueness: Shopping Mall Preference and Choice Activity,” International Journal of Retailing and Distribution Management, Vol. 23, No. 12, 1995, pp. 4-12. doi:10.1108/09590559510103954
- D. L. James, R. M. Durand and R. Dreves, “The Use of A Multiattribute Attitude Model in A Store Image Study,” Journal of Retailing, Vol. 52, No. 2, 1976, pp. 23-34.
- J. D. Lindquist, “Meaning of Image: Survey of Empirical and Hypothetical Evidence,” Journal of Retailing, Vol. 50, No. 4, 1974, pp. 29-38.
- D. Mazursky and J. Jacoby, “Exploring The Development of Store Images,” Journal of Retailing, Vol. 62, No. 2, 1986, pp. 145-165.
- P. Temporal, “Advanced Brand Management: from Vision to Valuation,” John Wiley and Sons, Hoboken, 2002.
- T. Erdem, J. Swait and J. Louviere, “The Impact of Brand Credibility on Consumer Price Sensitivity,” International Journal of Research in Marketing, Vol. 19, No. 1, 2002, pp. 1-19. doi:10.1016/S0167-8116(01)00048-9
- R. C. Kwok, D. Zhou, Q. Zhang and J. Ma, “A Fuzzy Multi-Criteria Decision Making Model for IS Student Group Project Assessment,” Group Decision and Negotiation, Vol. 16, No. 1, 2007, pp. 25-42. doi:10.1007/s10726-006-9029-7
- Y. M. Wang, Y. Luo and Z. Hua, “On the Extent Analysis Method for Fuzzy AHP and Its Applications,” European Journal of Operational Research, Vol. 186, No. 2, 2008, pp. 735-747. doi:10.1016/j.ejor.2007.01.050
- Y. M. Wang, T. M. S. Elhag and Z. Hua, “A Modified Fuzzy Logarithmic Least Squares Method for Fuzzy Analytic Hierarchy Process,” Fuzzy Sets and Systems, Vol. 157, No. 23, 2006, pp. 3055-3071.
- T. L. Saaty, “Decision making with dependence and feedback: The analytic network process,” RWS Publications, Pittsburgh, 1996.
- T. L. Saaty, “Rank from Comparisons and from Ratings in the Analytic Hierarchy/Network Processes,” European Journal of Operational Research, Vol. 168, No. 2, 2006, pp. 557-570. doi:10.1016/j.ejor.2004.04.032
- J. J. Buckley, “Ranking Alternatives Using Fuzzy Numbers,” Fuzzy Sets and Systems, Vol. 15, No. 1, 1985, pp. 21-31. doi:10.1016/0165-0114(85)90013-2
- Q. Zhu and E. S. Lee, “Comparison and Ranking of Fuzzy Numbers in Fuzzy Regression Analysis,” Omnitech Press, Warsaw, 1992.