Journal of Geographic Information System
Vol.6 No.4(2014), Article ID:48526,9 pages
DOI:10.4236/jgis.2014.64027
Spatio-Temporal Land Cover Analysis in Makhawan Watershed (M.P.), India through Remote Sensing and GIS Techniques
Mohd Talha Anees1*, Akram Javed1, Mohd Yousuf Khanday2
1Department of Geology, Aligarh Muslim University, Aligarh, India
2Geological Survey of India, Srinagar, India
Email: *talhaanees_alg@yahoo.in
Copyright © 2014 by authors and Scientific Research Publishing Inc.
This work is licensed under the Creative Commons Attribution International License (CC BY).
http://creativecommons.org/licenses/by/4.0/


Received 20 May 2014; revised 15 June 2014; accepted 13 July 2014
ABSTRACT
The present study makes an attempt to assess land use/land cover (LU/LC) changes at watershed level through remote sensing and GIS techniques, in Makhawan Watershed, Madhya Pradesh (India). The study involves multi-temporal satellite data of IRS-1D LISS III of 2001 and IRS-P6 LISS III of 2011, which have been analyzed visually. The study reveals that major LU/LC changes were due to the combined effects of many parameters, viz.; decline in average rainfall, more urbanization, sustainable agricultural activities and successful wasteland reclamation programmes. The major LU/LC changes noticed in the watershed decrease in uncultivated land (15.79%), wasteland whereas increases in open scrub (13.99%) and cultivated land. Changes in LU/LC categories are also compared with elevation which shows that most of the changes are associated with low lying areas (lower elevation ranges) except open scrub which shows changes in both low as well as high elevation ranges. Another notable change is the shrinkage of reservoir during 2001-2011 period which is linked to the decline in rainfall over the years.
Keywords:Land Use/Land Cover, Remote Sensing, GIS, Watershed

1. Introduction
The land use pattern of any terrain is a reflection of the complex physical process acting upon the surface of the Earth. These processes include impact of climatic, geologic and topographic conditions on the distribution of natural resources. Remote sensing has emerged as one of the frontier technologies in recent times because of its repetitive and synoptic coverage capabilities which are helpful in assessing land use/land cover changes in a time series domain. Information on existing land use/land cover (LU/LC), its spatial distribution and changes is essential prerequisite for planning [1] . Environmental change detection and monitoring can be done using multi data image to evaluate difference in LU/LC. It might be due to the human activities or by change in environmental conditions [2] .
GIS is an effective tool to solve geo-scientific problems creating geo-database of natural resources and to integrate various thematic data layers to study inter relationships of different layers. GIS and remote sensing techniques are being effectively used in recent times as advanced tools gather information about the Earth’s resources more accurately, efficiently and quickly than conventional methods [3] . Digital Elevation Model (DEM), multi layer overlay and raster analysis is also generated from GIS, which is helpful in assessing land cover changes.
LU/LC changes analyzed from 1998 to 2010 of Neil Island in Andaman by using Remote Sensing and GIS techniques, where it was found that forest, mangroves and reef area were decreased while sandy beaches increase to 88.2% during 1998-2010 [4] . The aquaculture tanks and agricultural land have been decreased by 7.34% and 5.56% respectively in area from 2000 to 2010 in the southern part of West Godavari district (India). Some plantation mixed with crops, fallow lands and built up land has increased while natural streams/ rivulets, mangroves etc. have decreased [5] . In Chilka catchment, located in East coast of India, LU/LC changes have occurred from 1975 to 2012 which relates different components responsible for the change with the implication on increase in biodiversity loss, soil erosion and inappropriate land management [6] .
The present study has been undertaken in Makhawan watershed of Madhya Pradesh state in Central India, with the objective of assessing LU/LC changes during the ten years period i.e., using IRS satellite data of 2001 and 2011, besides that an attempt has also been made to correlate the LU/LC changes with the Digital Elevation Model of the area.
2. Study Area
Makhawan watershed is located in Guna district of Madhya Pradesh, Central India and covers an area of 153.9 km2 and bounded between 24˚40' to 24˚45'N latitudes and 77˚15' to 77˚20'E longitudes (Figure 1). The maximum and minimum elevations encountered in the study area are 555 m and 440 m above mean sea level (MSL) respectively. The area is drained by Nagri stream and its tributaries. A small dam is built on the river which forms a reservoir in the north-western part of study area, which primarily serves as the single source for irrigation in an otherwise rain fed watershed. The soil of the watershed comprises several types such as Typic Haplusterts (32.68%), a moderate to deep, with moderately well drained fine soil found on gentle slopes and Chromatic Haplusterts (15.01%) is deep fine soil reported from very gentle slope. Geologically the area is represented by Recent Alluvium and exposures of Deccan Traps, besides it is characterized by two geomorphic units viz., Denudational Hills and Plateau. The drainage pattern is dendritic to subdendritic with moderate to high drainage density [3] . The drainage superimposed on DEM is shown in Figure 2. The climate of the area is tropically dry having sub-humid with average rainfall about 821 mm. The main crops in the area are wheat, mustered, cotton, maize etc.
3. Data Source
The survey of India (SOI) topographic sheet number 54H/6 (Scale 1:50,000) of 1982-1983 was used for preparation of base map, drainage map and other basic details. Geocoded False Colour Composite (FCC) of IRS-1D LISS III of 2001 with spatial resolution of 36.25 m and IRS-P6 LISS III of 2011 with spatial resolution of 23.5 m of band combinations green, red and near infrared were used for deriving information on various parameters of the watershed. ASTER data of 30 m resolution for preparation of DEM was downloaded from the website http://www.gdem.aster.erdac.or.jp/search.jsp.
Besides, secondary information in the form of published reports, papers, maps from government and nongovernment sources were also consulted.
4. Methodology
The study begins with review of literature and collection of information/data about the study area. The base
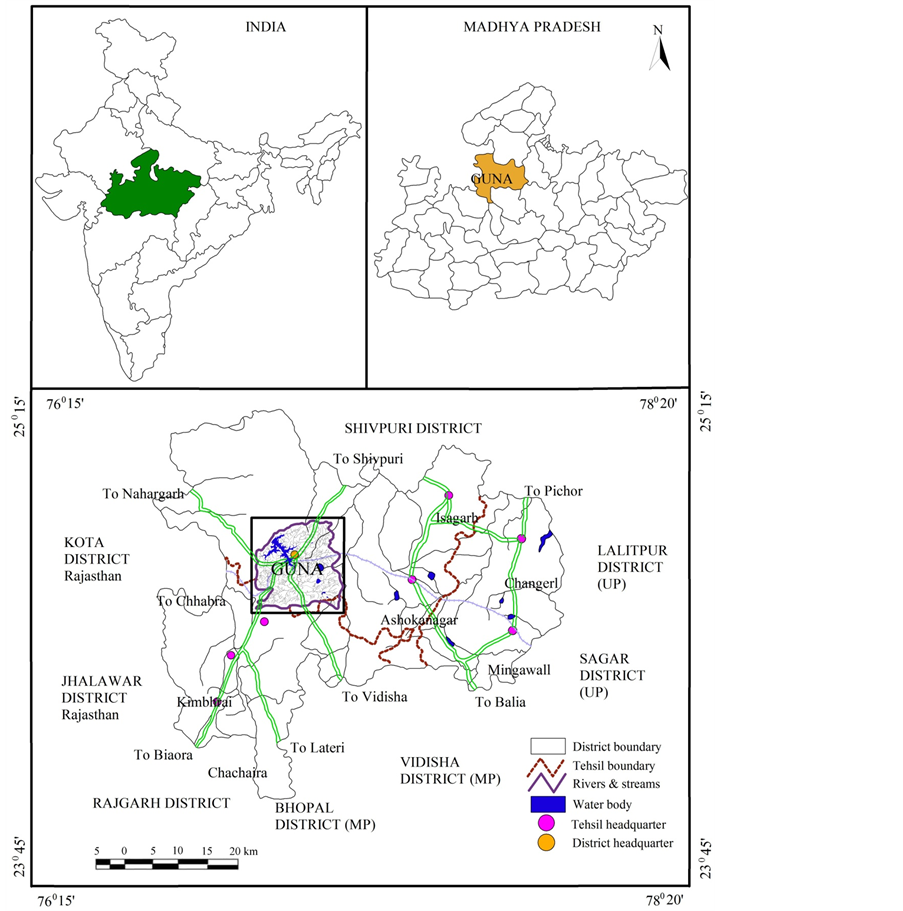
Figure 1. Location map of the study area.
map was prepared showing major natural and manmade features from the SOI toposheet on 1:50,000 scale.
Satellite data was interpreted using photographic and geotechnical elements besides field knowledge about the study area.
Visual interpretation of remotely sensed data is an effective method of classifying land cover especially when the analyst is familiar with the area being classified. This method uses skills that were originally developed for interpreting aerial photographs, and takes in to consideration image characteristics such as tone, texture, shape, pattern and relationship with other objects to identify different land cover classes. Remote sensing data analysis is supported by field/ground truth verification carried out in key areas to ascertain the veracity of the satellite data.
LU/LC maps were prepared through visual interpretation of IRS data of 2001 and 2011. Photographic elements and field knowledge was utilized to delineate various LU/LC categories such as cultivated land, uncultivated land, dense forest, open scrub, wasteland, water body and built up land.
LU/LC maps of the 2001 and 2011 were scanned, rectified and geocoded using Georefrencer and Geotrans-2 and digitized using ArcView 3.2. Unique polygon id was assigned to every LU/LC class. The digitized map was
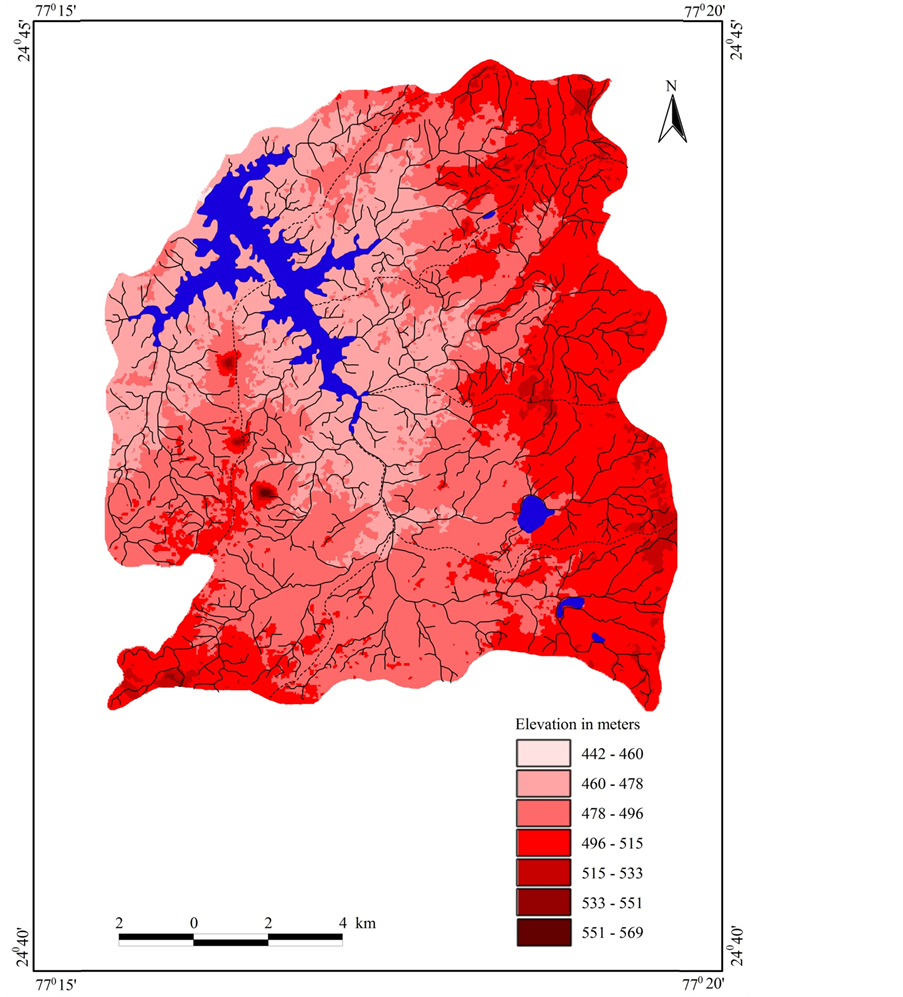
Figure 2. Drainage superimposed on Digital Elevation Model.
edited, cleaned and errors of digitization were removed before finalization of the maps.
Area under each category of LU/LC was calculated and computed in sq∙km as well as in percentage. A comparative analysis of the LU/LC maps was attempted to find out the changes during 2001-2011 period, by superimposing the two maps. The maps were then overlaid on DEM (Figure 3 & Figure 4) to know the correlation between elevation and LU/LC. Figure 5 shows the flow chart for the methodology adopted.
5. Results and Discussion
For the better development and management of the catchment areas of reservoirs, it is necessary to have timely and reliable information on land use/land cover. For the present study IRS data of 2001 and 2011 were visually interpreted which led to the identification and delineation of following LU/LC categories in the study area:

Figure 3. Land use/land cover (2001) superimposed on DEM.
6. Cultivated Land
The cultivated land is recognized on FCC by its red tone, smooth texture and regular to sub-regular boundary outlines. It was found that cultivated land has increased from 30.51 km2 (19.83%) in 2001 to 35.65 km2 (23.17%) in 2011 primarily due to shrinkage of reservoir which has been converted to cultivated land around its periphery. Increase in cultivated land is indication of good agricultural practices, land reclamation programs and rehabilitation of farmers.
7. Uncultivated Land
Uncultivated land exhibit grey tone, coarse texture, irregular boundary outline and haphazard patterns. It decreased from 41.49 km2 (26.96%) in 2001 to 17.18 km2 (11.17%) in 2011. Mostly it has been converted to open
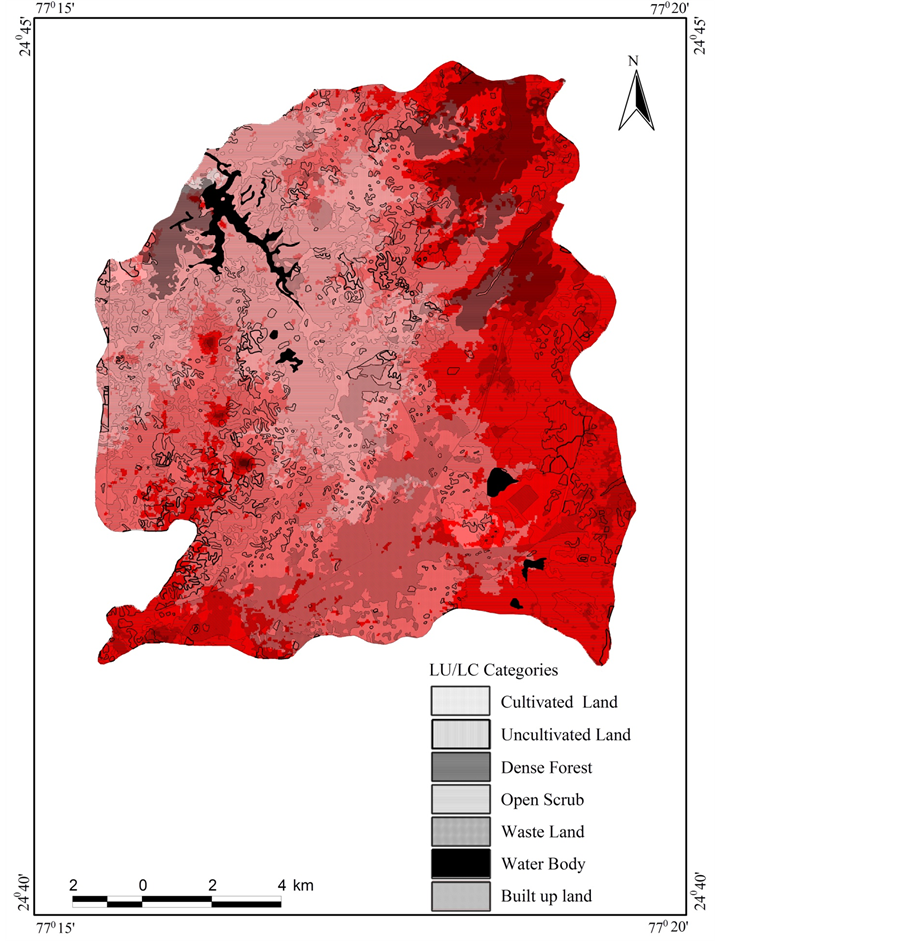
Figure 4. Land use/land cover (2011) superimposed on DEM.
scrub (11.40 km2), at places, in cultivated land due to availability of moisture and rest is occupied by built up land.
8. Dense Forest
Dense forest is identified by its dark red/brown tone, smooth texture, scattered pattern and association with high relief zones (563 m to 570 m). Dense forest has marginally decreased from 13.89 km2 (9.03%) in 2001 to 12.10 km2 (7.87%) in 2011, possibly due to decline in average rainfall and anthropogenic factors and it was degraded into open scrub in most of the places. However, at some places, it is degraded into wasteland. The loss of dense forest in this period is 1.73 km2 (1.16%).
9. Open Scrub
One of the major changes in Makhawan watershed is open scrub which is identified by its pinkish to light yel-
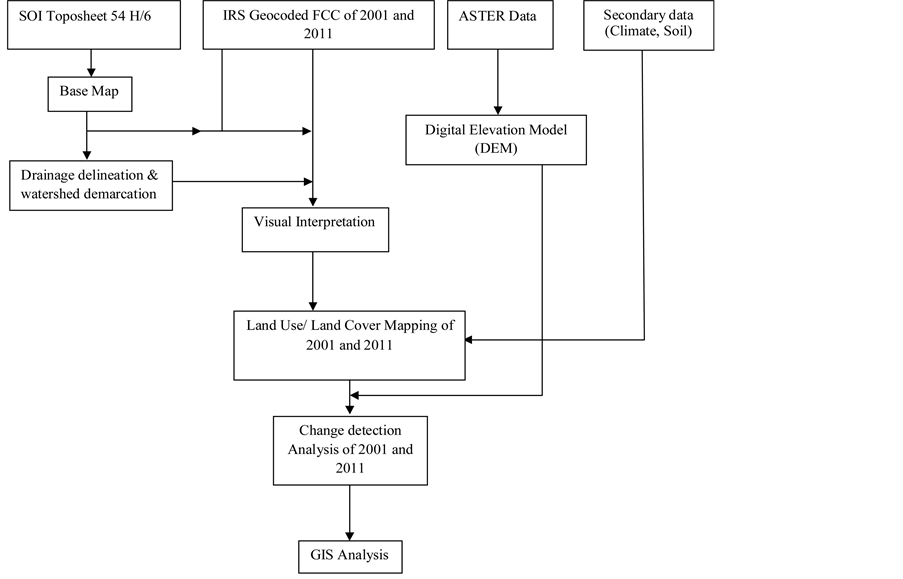
Figure 5. Schematic diagram showing methodology.
low tone, irregular boundary outline and rough texture. Open scrub has increased from 42.54 km2 (27.65%) in 2001 to 64.07 km2 (41.64%) in 2011 due to conversion of dense forest into open scrub, drying up of water body, besides uncultivated land becoming open scrub.
10. Wasteland
Wasteland normally exhibits light tone because of high reflectance, irregular pattern with smooth texture, absence of any land use activity or natural vegetation and its proximity to cultivated land/uncultivated land. Wasteland decreased from 11.08 km2 (7.19%) in 2001 to 4.80 km2 (3.12%) in 2011. Wasteland has been converted into built up land, open scrub and cultivated land, which suggest reclamation measures.
11. Built up Land
Built up land is characterized by magenta tone with irregular shape and boundary outline and sharp contact with adjacent land use. It has increased from 7.03 km2 (4.57%) in 2001 to 17.15 km2 (11.15%) in 2011. Built up land has observed drastic change in study area which is responsible for some positive changes due to their good agricultural activities and proper maintenance of environmental conditions. Conversion of cultivated land and uncultivated land due to shifting is occupied by built up land. Totally built up land increased in this period is 10.12 km2 (6.58%).
12. Water Body
Water bodies appear dark on satellite data due to absorption of incoming IR radiation, hence it exhibit dark tone, smooth texture, sharp boundary outline and irregular pattern. Makhawan watershed has a single source of surface water in the north-western part of the area and about 2.91% area of reservoir has shrunk from 7.36 km2 (4.79%) in 2001 to 2.90 km2 (1.88%) in 2011. The dried up water body has been converted into open scrub since it has high moisture content which resulted in growing up of natural vegetation.
A bar diagram of LU/LC changes during 2001 to 2011 are shown in Figure 6 and the details of LU/LC and the changes in area under each category are given in Table1
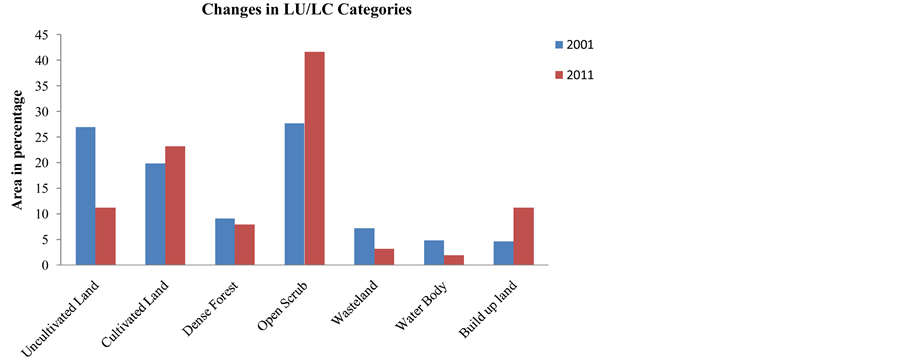
Figure 6. Changes in land use/land cover during 2001-2011.

Table 1. Changes in land use/land cover in Makhawan watershed during 2001-2011.
13. LU/LC and DEM
By comparing LU/LC changes with DEM following results are obtained:
●Major changes in cultivated land occurred in low lying areas of elevation ranging 442 m - 496 m. Increase in cultivated land from 2001 to 2011 is due to shrinkage of reservoir leading to increase in cultivated land and transformation into open scrub and few in uncultivated land.
●Changes in uncultivated land have occurred in almost all elevation range (442 m - 551 m). Uncultivated land associated with high elevation range converted into open scrub while low elevated uncultivated land is changed into both open scrub and cultivated land. Partially uncultivated land is converted to built up land in relatively gentler slopes to meet the demand for housing to accommodate growth in population.
●Dense forest in low lying areas have been degraded and converted to open scrub and at few places even used for cultivation. High elevated dense forest ranges from 496 m - 533 m have changed into open scrub.
●Open scrub has increased substantially in high elevation range (496 m - 551 m), at the periphery of dried up water body and almost all low lying areas.
●Wasteland of high elevation area (515 m - 551 m) has converted into open scrub and that of low elevation range (442 m - 496 m) into cultivated land and built up land.
14. Conclusion
The present study clearly demonstrates the utility of remote sensing and GIS techniques in monitoring the LU/LC changes which have taken place in Makhawan watershed from 2001 to 2011. Since remote sensing data provide repetitive coverage, it can be used more effectively with multiple data and has found its use in seven LU/LC features and its analysis with the help of GIS tools. The major positive changes which have taken place in the study area increase in cultivated land and open scrub, decrease in uncultivated land and wasteland. Negative changes include reduction under dense forest and water body. In terms of elevation, major changes in LU/LC categories occurred mostly in low lying areas except open scrub which occupies low elevation areas as well as high elevation areas. The analysis shows that good agricultural practices and wasteland reclamation have brought out positive results in the overall environmental set up of the watershed. However, some of the activities such as plantation, contour bunding and construction of check dams/percolation ponds may be taken up for the better watershed management.
Acknowledgements
The authors are thankful to the Chairman, Department of Geology, Aligarh Muslim University, Aligarh for providing necessary infrastructure facilities, for the study. Thanks are also due to Ms. Subah Rais and Mr. Mohd Aleem for their help in data analysis and fruitful discussions. The constructive comments and suggestions of the referees and editors of Journal of Geographic Information System are thankfully acknowledged.
References
- Dhinwa, P.S., Pathan, S.K., Sastry, S.V.C., Rao, M., Majumder, K.L., Chotani, M.L., Premnath Singh, J. and Sinha, R.L.P. (1992) Land Use Change Analysis of Bharatpur District Using GIS. Journal of the Indain Society of Remote Sensing, 20, 237-250.
- Singh, S.S. and Singh, A.K. (2013) Spatio-Temporal Changes Detection for LU/LC and Its Impact on Hasdeo River Basin of Central India. International Journal of Recent Scientific Research, 4, 925-930.
- Khanday, M.Y. (2009) Characterization and Prioritization of Watersheds in Parts of Guna District, Madhya Pradesh, Using Remote Sensing & GIS Techniques. PHD Thesis, AMU, Aligarh.
- Saravanan, Dharanirajan, K., Yuvaraj, E. and Karpoorasundarapandian, N. (2013) Quantifying the Dynamic Changes of Landuse and Landcover in Neil Island, Andaman and Nicobar, India. International Journal of Geomatics and Geosciences, 4, 427-434.
- Anil, N.C., Sankar, G.J., Rao, M.J., Prasad, I.V.R.K.V. and Sailaja, U. (2011) Studies on Land Use/Land Cover and Change Detection from Parts of South West Godavari District, A.P—Using Remote Sensing and GIS Techniques. Indian Geophysical Union, 15, 187-194.
- Ojha, A., Rout, J., Samal, R.N., Rajesh, G., Pattnaik, A.K. and Daspatnaik, P. (2013) Evolution of Landuse/Landcover Dynamics of Chilika Catchment. International Journal of Geomatics and Geosciences, 4, 388-396.
NOTES

*Corresponding author.