Journal of Geographic Information System
Vol.6 No.1(2014), Article ID:42823,7 pages DOI:10.4236/jgis.2014.61003
Utilization of Hot Spotting to Identify Community Needs and Coordinate Care for High-Cost Patients in Memphis, TN
1Wake School of Medicine, Division of Public Health Sciences, Winston Salem, USA
2Methodist Le Bonheur Healthcare, University of Memphis School of Public Health, Memphis, USA
3University of Tennessee Health Science Center, Knoxville, USA
4University of Illinois School of Public Health, Chicago, USA
5Qsource & University of Memphis School of Public Health Memphis, Memphis, USA
Email: tcutts@wakehealth.edu, ed.rafalski@mlh.org, cgrant@QSource.org, razvan.marinescu@mlh.org
Copyright © 2014 Teresa Cutts et al. This is an open access article distributed under the Creative Commons Attribution License, which permits unrestricted use, distribution, and reproduction in any medium, provided the original work is properly cited. In accordance of the Creative Commons Attribution License all Copyrights © 2014 are reserved for SCIRP and the owner of the intellectual property Teresa Cutts et al. All Copyright © 2014 are guarded by law and by SCIRP as a guardian.
Received October 23, 2013; revised November 23, 2013; accepted November 30, 2013
KEYWORDS
Hot Spotting; CHNA (Community Health Needs Assessment); Congregational Health Network (CHN); Memphis Model; Health Disparities
ABSTRACT
In 2006, Methodist Le Bonheur Healthcare (MLH) created the Congregational Health Network (CHN, TM pending) which works closely with clergy in the most under-served zip codes of the city to improve access to care and overall health status of the population. To best coordinate CHN resources around high-utilization and address the largest health needs in the community, MLH applied hot spotting and geographic information system (GIS) spatial analysis techniques. These techniques were coupled with the community health needs assessment process at MLH and qualitative, participatory research findings captured in collaboration with church and other community partners. The methodology, which we call “participatory hot spotting,” is based upon the Camden Model, which leverages hot spotting to assess and prioritize community need in the provision of charity care, but adds a participatory, qualitative layer. In this study, spatial analysis was employed to evaluate hospital-based inpatient and outpatient utilization and define costs of charity care for the health system by area of residence. Ten zip codes accounted for 56% of total system charity care costs. Among these, the largest zip code, as defined by a percentage of total charity costs, contributed 18% of the inpatient utilization and 17% of the cost. Further, this zip code (38109) contributed 69% of the inpatient and 76% of the outpatient charity care volume and accounted for 75% of inpatient and 76% of outpatient charity care costs for the system. These findings were combined with grassroots intelligence that enabled a partnership with clergy and community members and Cigna Healthcare to better coordinate care in a place-based population health management strategy. Presentations of the analytics have subsequently been made to HHS and the CDC, referred to by some as the “Memphis Model”.
1. Introduction
The Patient Protection and Affordable Care Act (PPACA) addresses community benefits and engagement in its provisions regarding reductions in uncompensated care costs through expansion of insurance coverage [1]. Effective beginning two years after enactment of the PPACA, a community health needs assessment (CHNA)
must be conducted no less than every three years and the reporting not-for-profit hospital must adopt a strategy to address needs identified through CHNA, incorporate input from persons representing the broad interests of the community, including those with interest/expertise in public health, and must make the report widely available to the public. Hospitals must also include a description of how they are meeting identified needs through CHNA, any such needs that are not being addressed and explain why the needs are not being met in their IRS Form 990 [2].
Currently, many community benefit programs focus on counting activities and dollars rather than on the impact of activities and the extent to which they address community needs. In an effort to reconnect to the communities served by hospitals and re-emphasize the charitable mission, not-for-profit hospitals are revisiting their founding principles much like what Paul Starr chronicled in his Social Transformation of American Medicine [3]. This will potentially shift focus away from random activities and toward: community engagement, collaboration between providers, accountability for identified local needs, focus on accessibility of services and prevention and focus on population health issues.
According to the National Institute for Healthcare Management (NIHCM), 5% of the population accounts for almost half of total health care spending in the United States [4]. A small number of patients end up consuming most of the charity health care dollars not-for-profit hospitals provide to their communities [5]. Having the ability to focus resources on these patients allows for improved health outcomes and potentially reduces hospital’s expenditures [6]. Further, having targeted investments with demonstrable success in hot spot areas can also address the most recent community benefits requirements enacted through healthcare reform.
The Camden Model maps the community block by block using hospital data and identifies hot spots for intervention, focusing on the heaviest users and connecting them with a primary care provider to address their needs outside the hospital [4]. The model’s calculations show that 1% (one percent) of the people who used Camden’s medical facilities accounted for 30% (thirty percent) of its costs. There is a second model, the Memphis Model, which promotes a comprehensive enhanced focus on building a health system inclusive of all community and congregational assets required to improve health outcomes and eliminate disparity in our area [7]. The Memphis Model is also being leveraged to proactively manage the charitable mission through community engagement, provider collaboration, accountability to identified needs and accessibility of services.
In essence, we combine two best practices, the Camden Model and the Memphis Model, to address in a unique manner the health care needs of the Memphis community. Participatory hot spotting, a term we coined to describe our methodology, entails chart review and data analytics, tracking patients with the highest utilization back to neighborhood and household level, coupled with the intelligence of our community health workers, to help navigate those persons to more appropriate and lower level care. We believe that this methodology combines the best of quantitative in-hospital data monitoring with qualitative data or knowledge possessed by community workers about those persons and their circumstances, while leveraging trusted relationships [8].
The Memphis Model centers on the Congregational Health Network (CHN) of more than 500 churches who navigate patients to optimal point-of-care through health navigators employed by the CHN. These health navigators rely on church liaison volunteers for public health outreach. Outcome data reflect reduced hospital readmissions for patients who are members of the network.
Applying the Camden hot spotting model to the Memphis community, neighborhoods and the relatively few charity care patients that over-utilize hospital facilities were identified (One of those patients had visited the ED 212 times in 3 years). These patients represented the highest percentage of charity care cost. For example, in the zip code ranked highest by inpatient and outpatient charity care utilization, 6% of hospital inpatient volume accounted for nearly 40% of total cost.
Managing these patients at the neighborhood level should have the biggest impact on their charity care. Identifying patients at risk through hot spotting and addressing their healthcare needs in the community/neighborhood by assigning local church-based navigators will assist in avoiding the fragmented care for acute episodes obtained in the ED and providing for regular follow-up with primary care providers in a medical home. This paper further describes our participatory hot spotting approach.
2. Background
Methodist Le Bonheur Healthcare (MLH) is a not-forprofit seven (7) hospital system, located in Memphis, TN, which is a large urban hub of poverty and health disparity. MLH has an annual budget of $1.6 billion and provides a substantial amount of care to the under-served and under-insured, given the concentration of poverty in West Tennessee. Additionally, many of the patients served are of African-American descent, with premature aging secondary to multiple chronic co-morbidities (e.g., cardiovascular disease, diabetes, hypertension, end-stage renal disease and obesity), with poorer health status and health outcomes. To deal proactively with coming fines in avoidable readmissions among this vulnerable population, MLH created the Congregational Health Network (CHN) in 2006, partnering with 12 clergy in the most underserved zip codes (South Memphis and near the medical center area) to improve access to care and overall health status of the population. Since that time, the CHN has grown to over 536 clergy partners, has trained over 2000 health liaisons and clergy in a variety of topics germane to community-based caregiving and “navigating” patients to more appropriate level care sooner. This CHN model of community-based health care navigation has been referenced by some as the “Memphis Model”.
Preliminary review of inpatient utilization rates among the first 473 CHN members to touch the MLH system in the first 25 months of operation, compared to controls matched on age, ethnicity, gender and DRGs, showed that CHN members had roughly 20% fewer readmissions, half the crude mortality rate and total charges were $4 million lower [3,5]. Later, predictive modeling of mean time to readmission demonstrated that median time to readmission in first quartile was 120 days longer for CHN members for all patient review diagnostic related groups (DRGs) (statistically significant) and 141 days for congestive heart failure (not statistically significant, due to lower n) compared to controls matched on 14 variables. These data indicate that this community caregiving model is effective in decreasing hospital utilization and readmissions, which will be a key in keeping MLH viable in the future as Medicare and Medicaid reimbursement rates decrease and penalties for readmissions and poor patient satisfaction increase. The CHN partnership is characterized by community participatory based research [5] and critical to the success of this work is that it is both data driven (high-tech) and based on continuity with and knowledge of persons served in the congregations and community (high-touch).
3. Methods
GIS spatial analysis of the City of Memphis was performed using Esri’s ArcGIS suite of mapping tools. Using big data and data mining techniques [9] encounter data from the MLH inpatient and outpatient electronic medical record (EMR) system, provided by Cerner, was obtained though Cerner Power Insight and Cost-Flex cost accountting reporting tools (Table 1). Encounter data were then aggregated at the individual hospital level to evaluate the concentration of patients originating from 38109 (Table 2). Use rates and fixed/variable costs by patient were derived by aggregating the encounter and billing data by unique patient identifier medical record numbers. Unique patients were geocoded along with CHN locations and both were mapped over the Memphis Metropolitan Statistical Area (MSA) to identify the areas with the highest concentration of patients with high utilization and cost (Figure 1). Combining the cost data with the CHN assets in the community led us to choose zip code 38109 which displayed the highest utilization and a high penetration of 0.6 congregations per 1000 population (Table 3).
Each patient resident was then mapped to begin to identify their location in relation to CHN sites at the street and block group level. Building on this level of analysis, a CHN navigator, liaisons and member churches were identified for their “analysis” of the data, community level discussion and trust building. These CHN partners helped to understand the “story” or qualitative narrative regarding the top utilizers, directing them to local ministries and resources that could serve in a safety net role (e.g., The Healing Center, who, through peer mentors, screens and triages African American persons to traditional mental health care through 13 local church sites).
4. Results
The top ten Memphis zip codes accounted for 2743 inpatient visits and 27,959 outpatient visits totaling 59% of patient volume (Table 1). These visits cost the system over $61M in charity care and accounted for 56% of charity care cost in 2010. While inpatient volume was only 5% of the total charity volume in 2010, it accounted for almost 40% of the total cost.
With approximately 49,000 residents, 38109 comprises 14% of the total population of Memphis and is 97% African American. From this zip code, there were 493 inpatient and 5073 outpatient visits representing 36% of all volume.
Inpatient and outpatient data were aggregated at the individual hospital level to evaluate the concentration of patients originating from 38109 (Table 2). Methodist Hospital South (MHS), located just south of Graceland on Elvis Presley Boulevard due east of 38109 (Figure 1), accounted for 6% of the inpatient volume and 37% of the total charity care cost at MHS. It accounted for 57% of the outpatient volume and 20% of the total charity care cost at MHS.
The “hot spot” of utilization and cost was found to be south of the City of Memphis proper in one zip code 38109. As is often noted for residents who have high rates of utilization of ED services, 38109 contains a high percentage of under-served persons and has only one Federally Qualified Health Center (FQHC) safety net clinic, serving roughly the 49,000 residents.
Further analysis exposed the medically and socially complex nature of the patients served and the health challenges faced by these communities as a result. Six of the top ten utilizing patients from the leading zip code experienced mental health co-morbidities. Also of note were how enrolling two patients in Medicare and TennCare (Medicaid) coverage substantially altered ED utilization in the year subsequent to enrollment.
Crafting a place-based population health management strategy, MLH Senior Management then initiated a dialogue in a select neighborhood within the target zip code 38109, with the aim of leveraging the trust built with CHN congregational partners and community members. Payer partners, including Cigna Healthcare, pastors and community members, as well as coalition leaders, were invited to participate in a series of community “conversations” with the aim of gleaning grassroots input and engagement
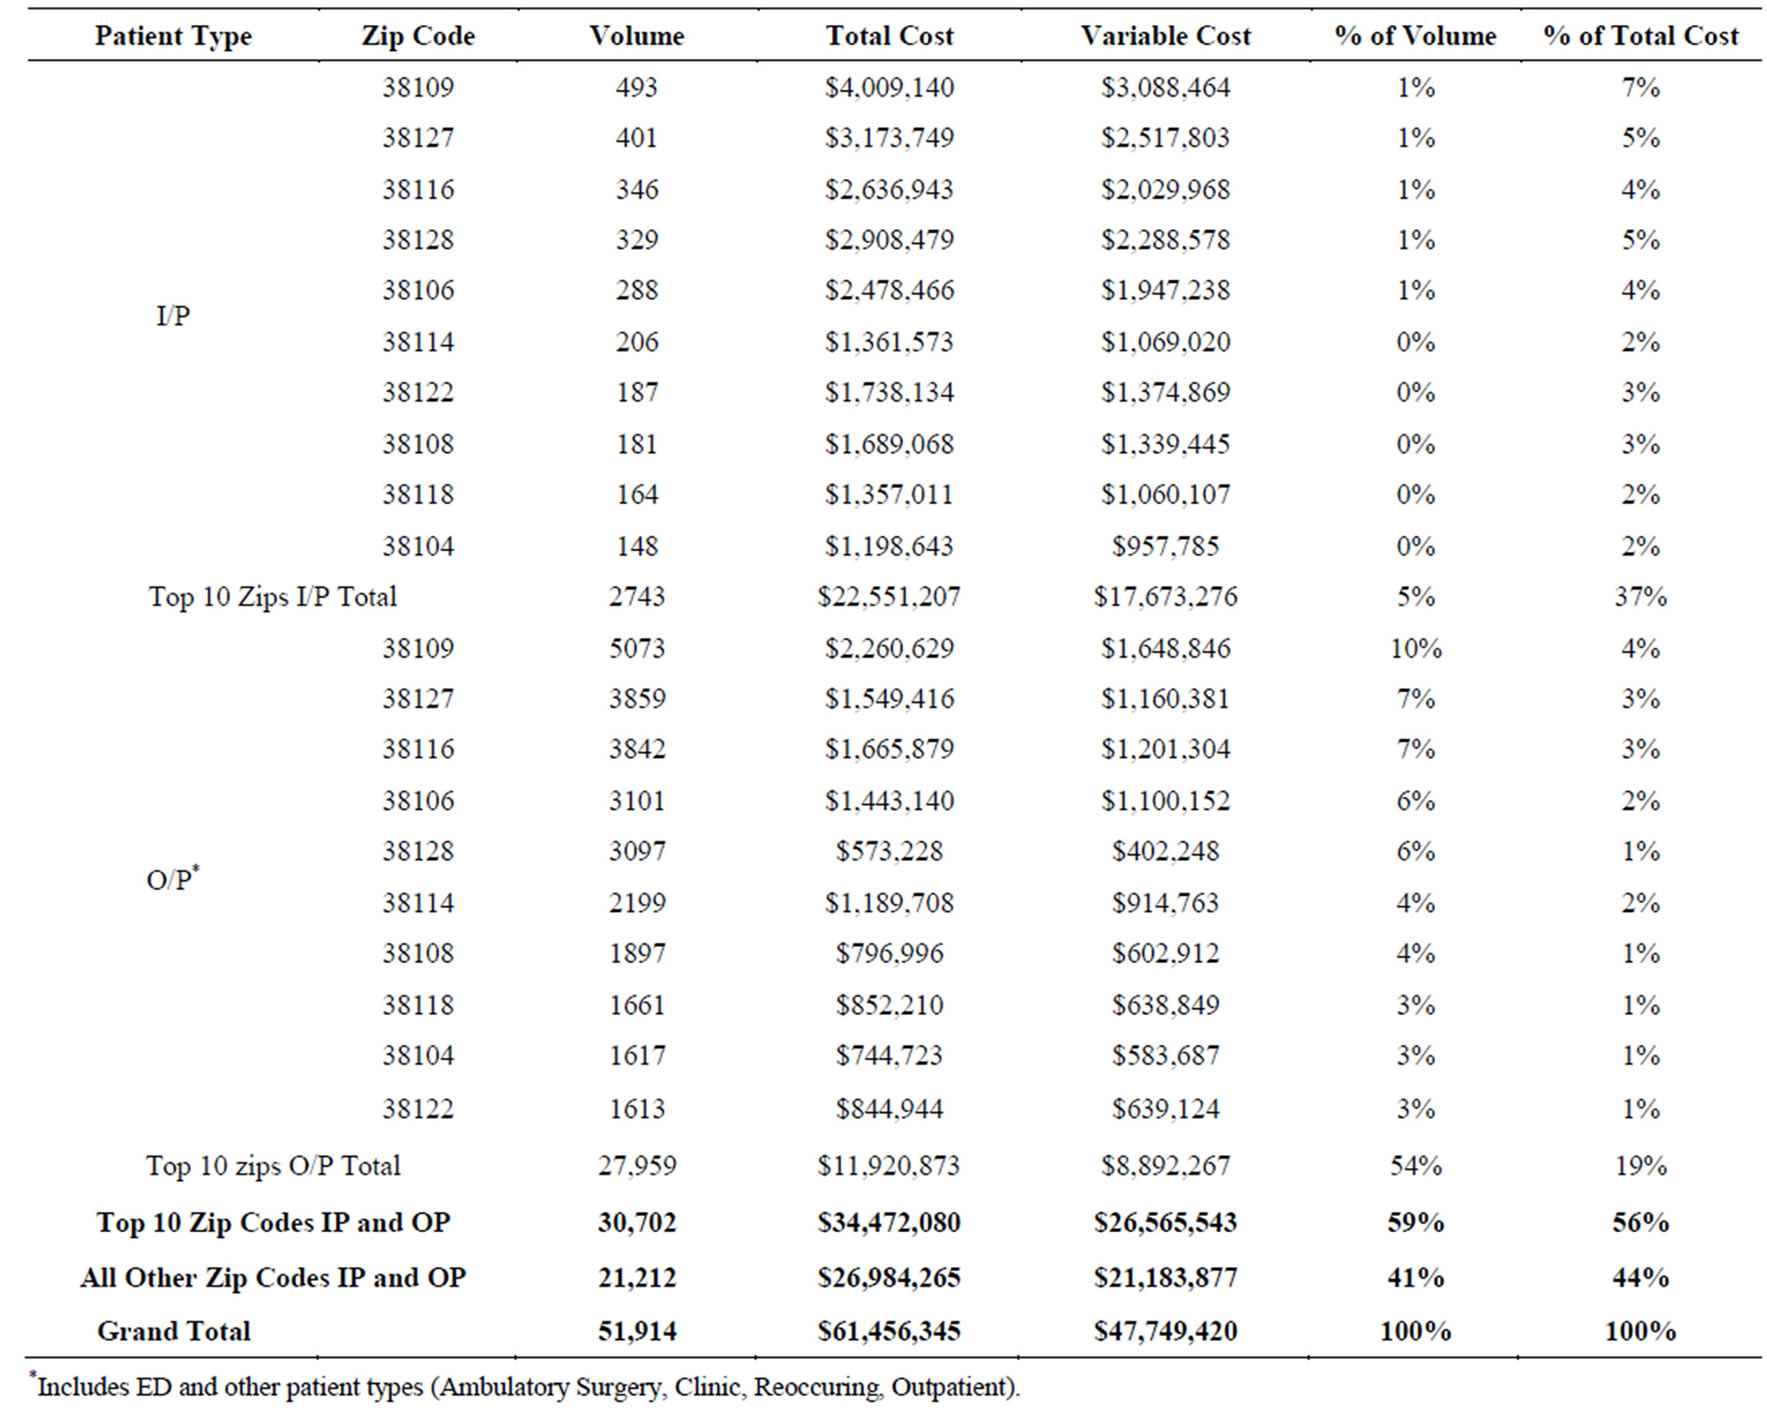
Table 1. Top 10 zip codes by volume, 2010.
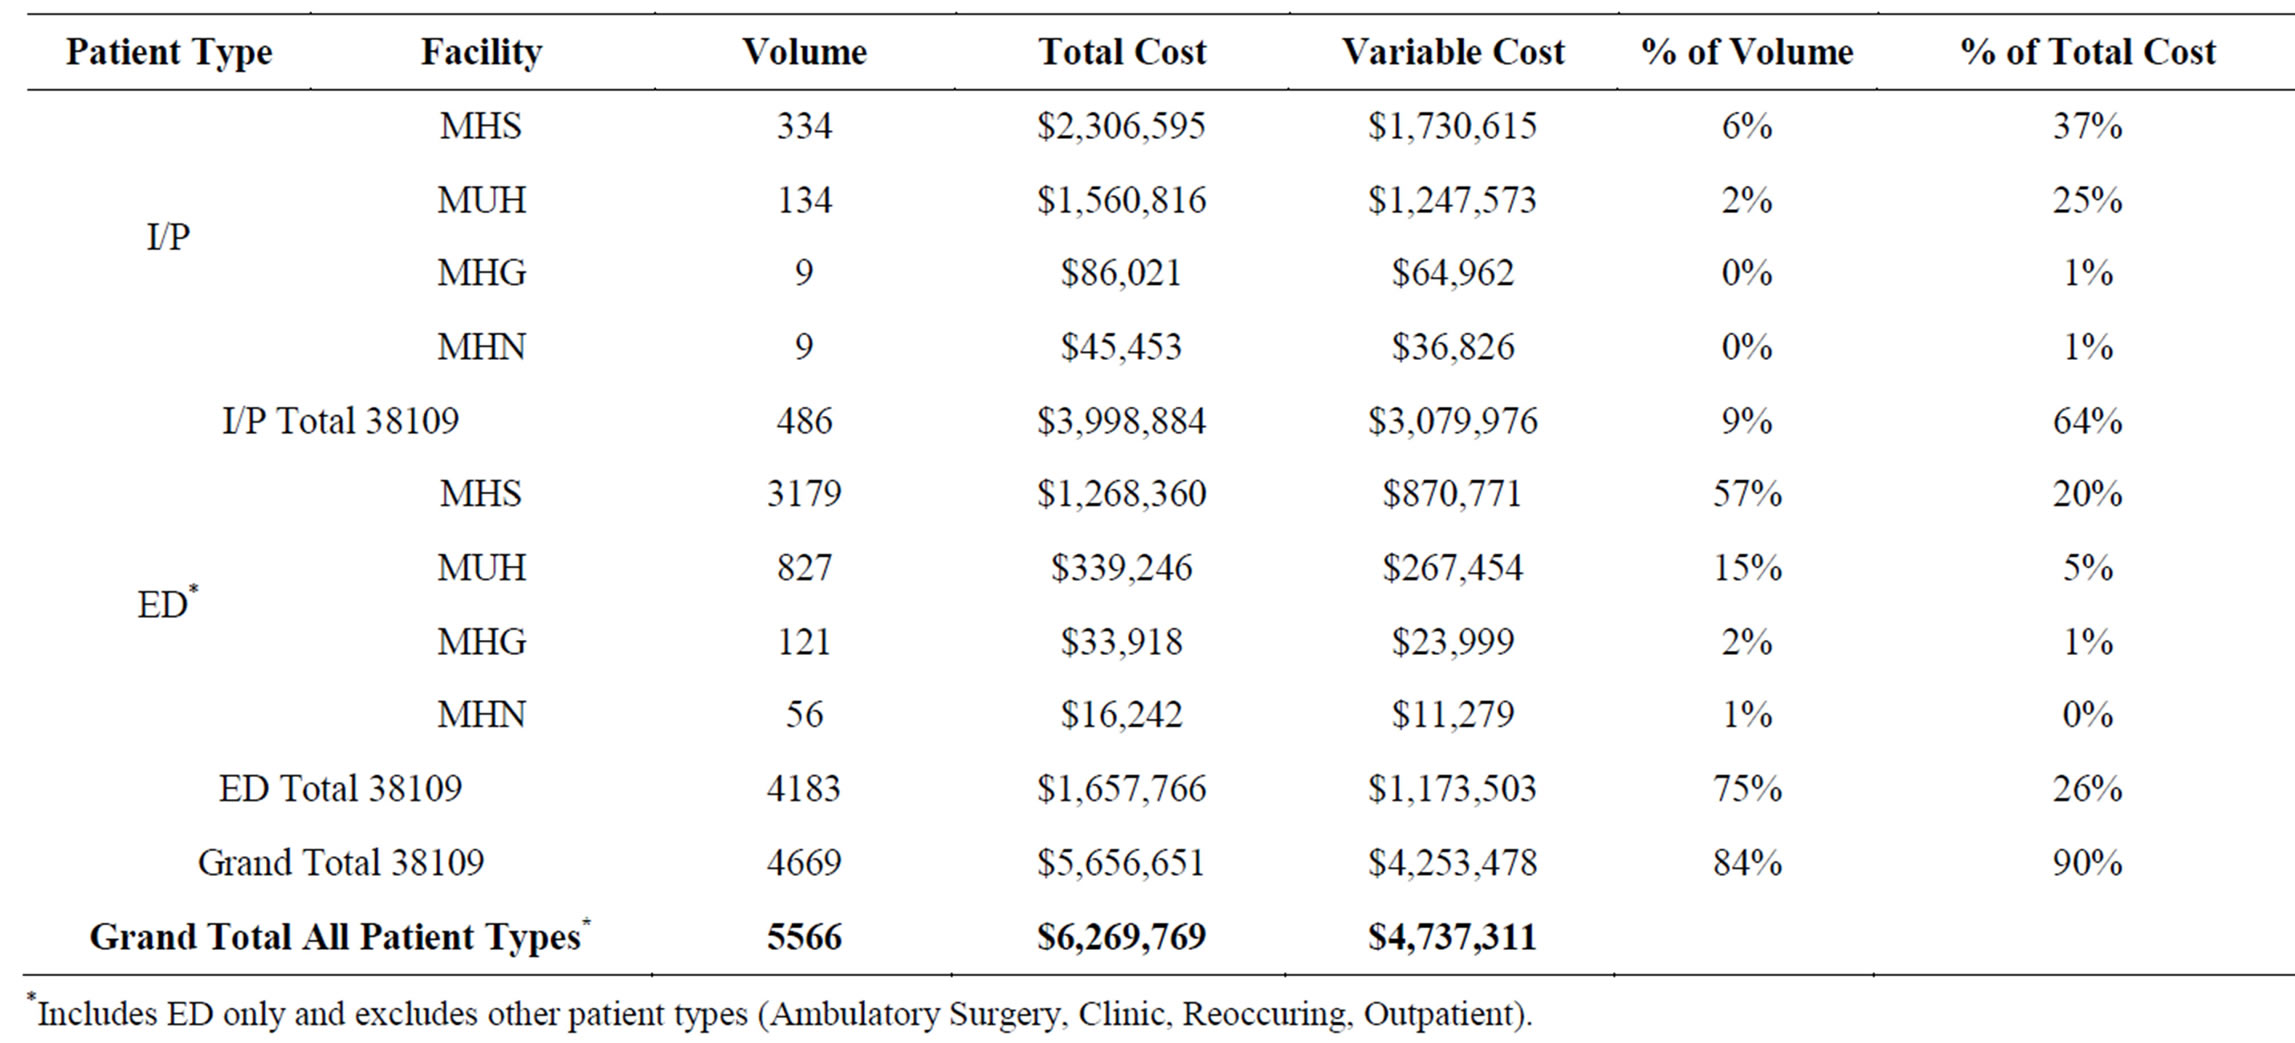
Table 2. Charity care by hospital for patients residing in 38109, 2010.
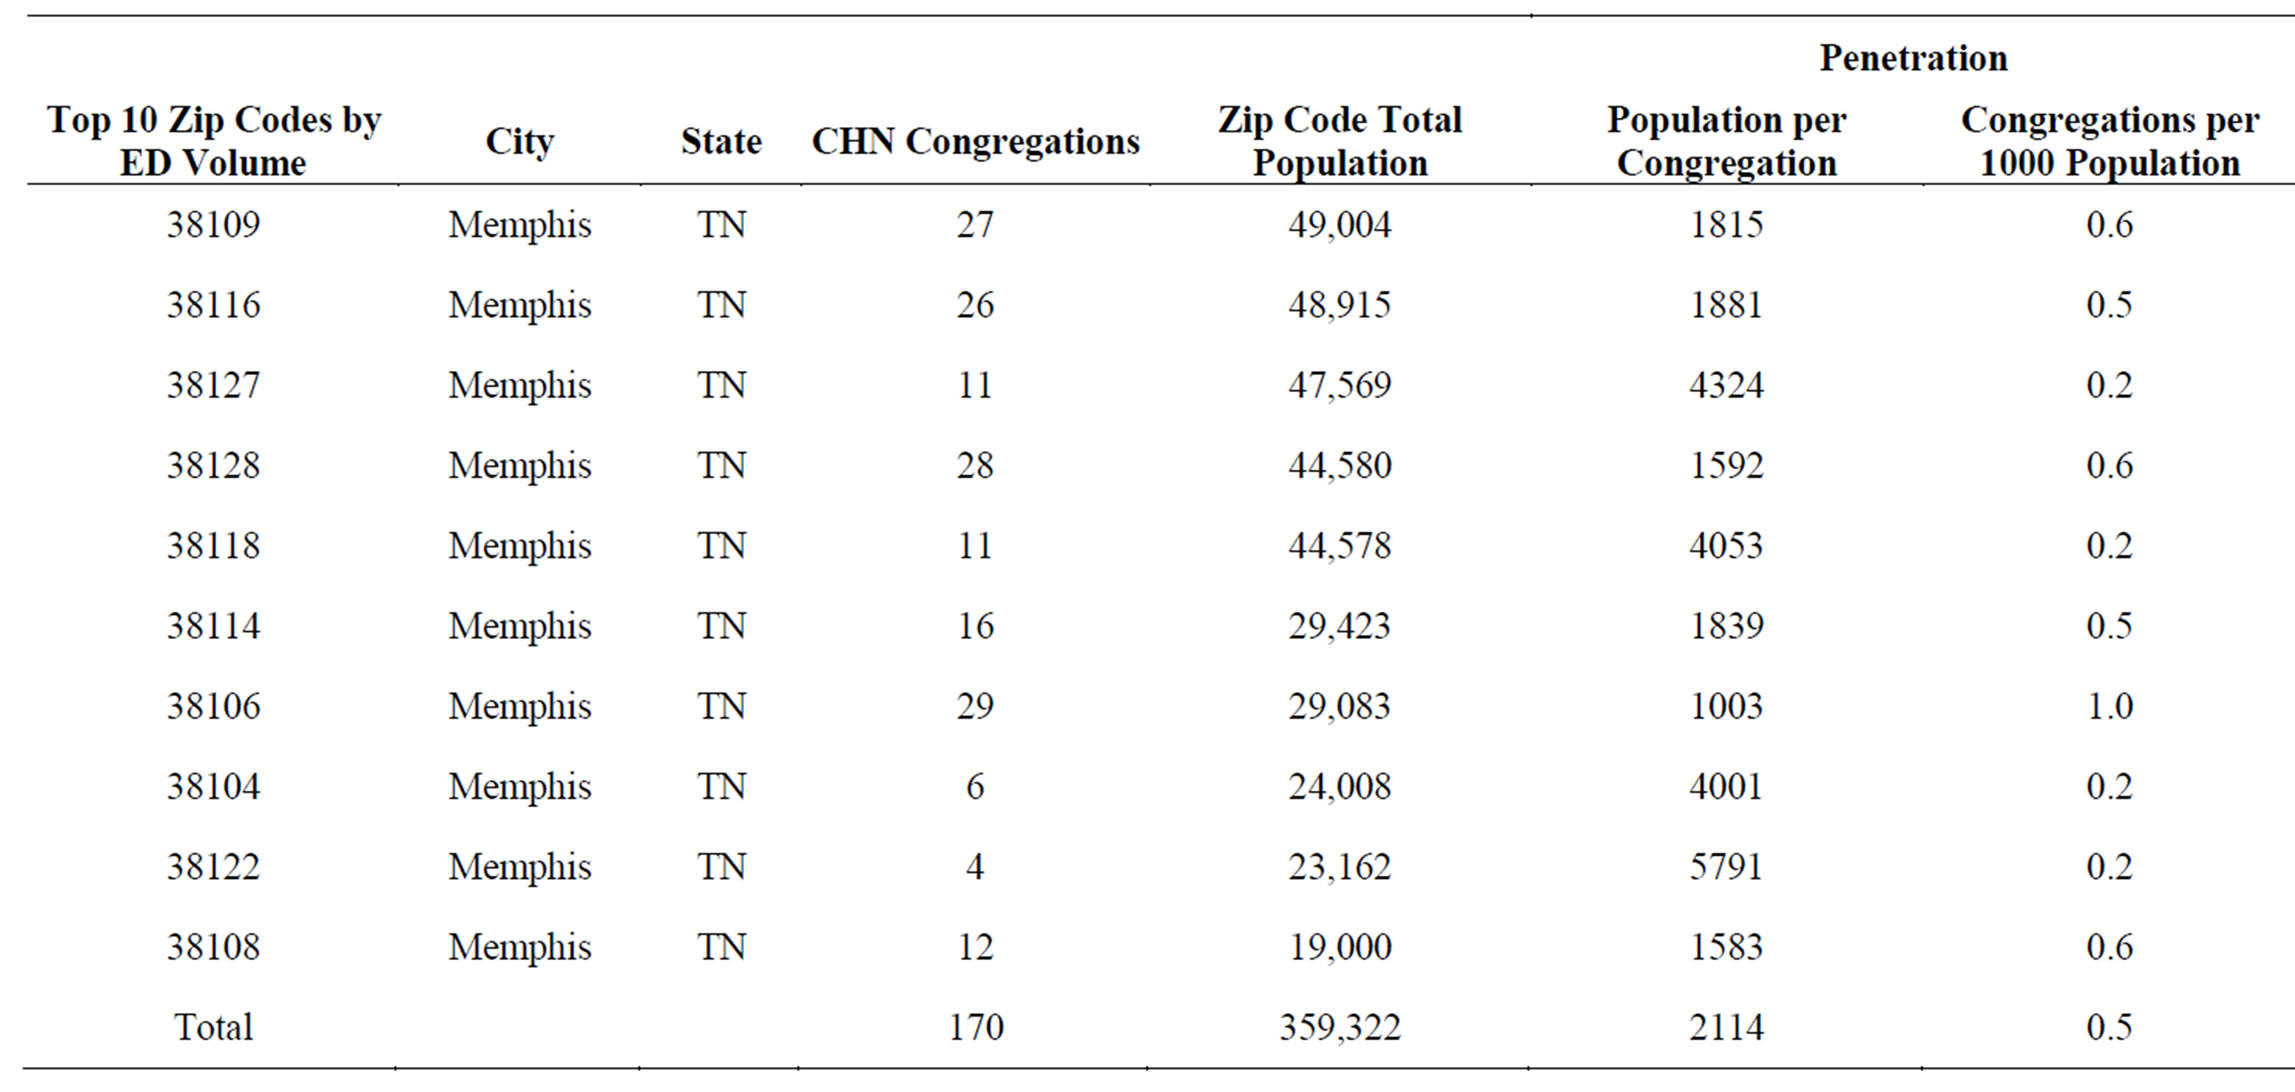
Table 3. Penetration of CHN congregations among the zip codes with the highest volume of ED utilization.
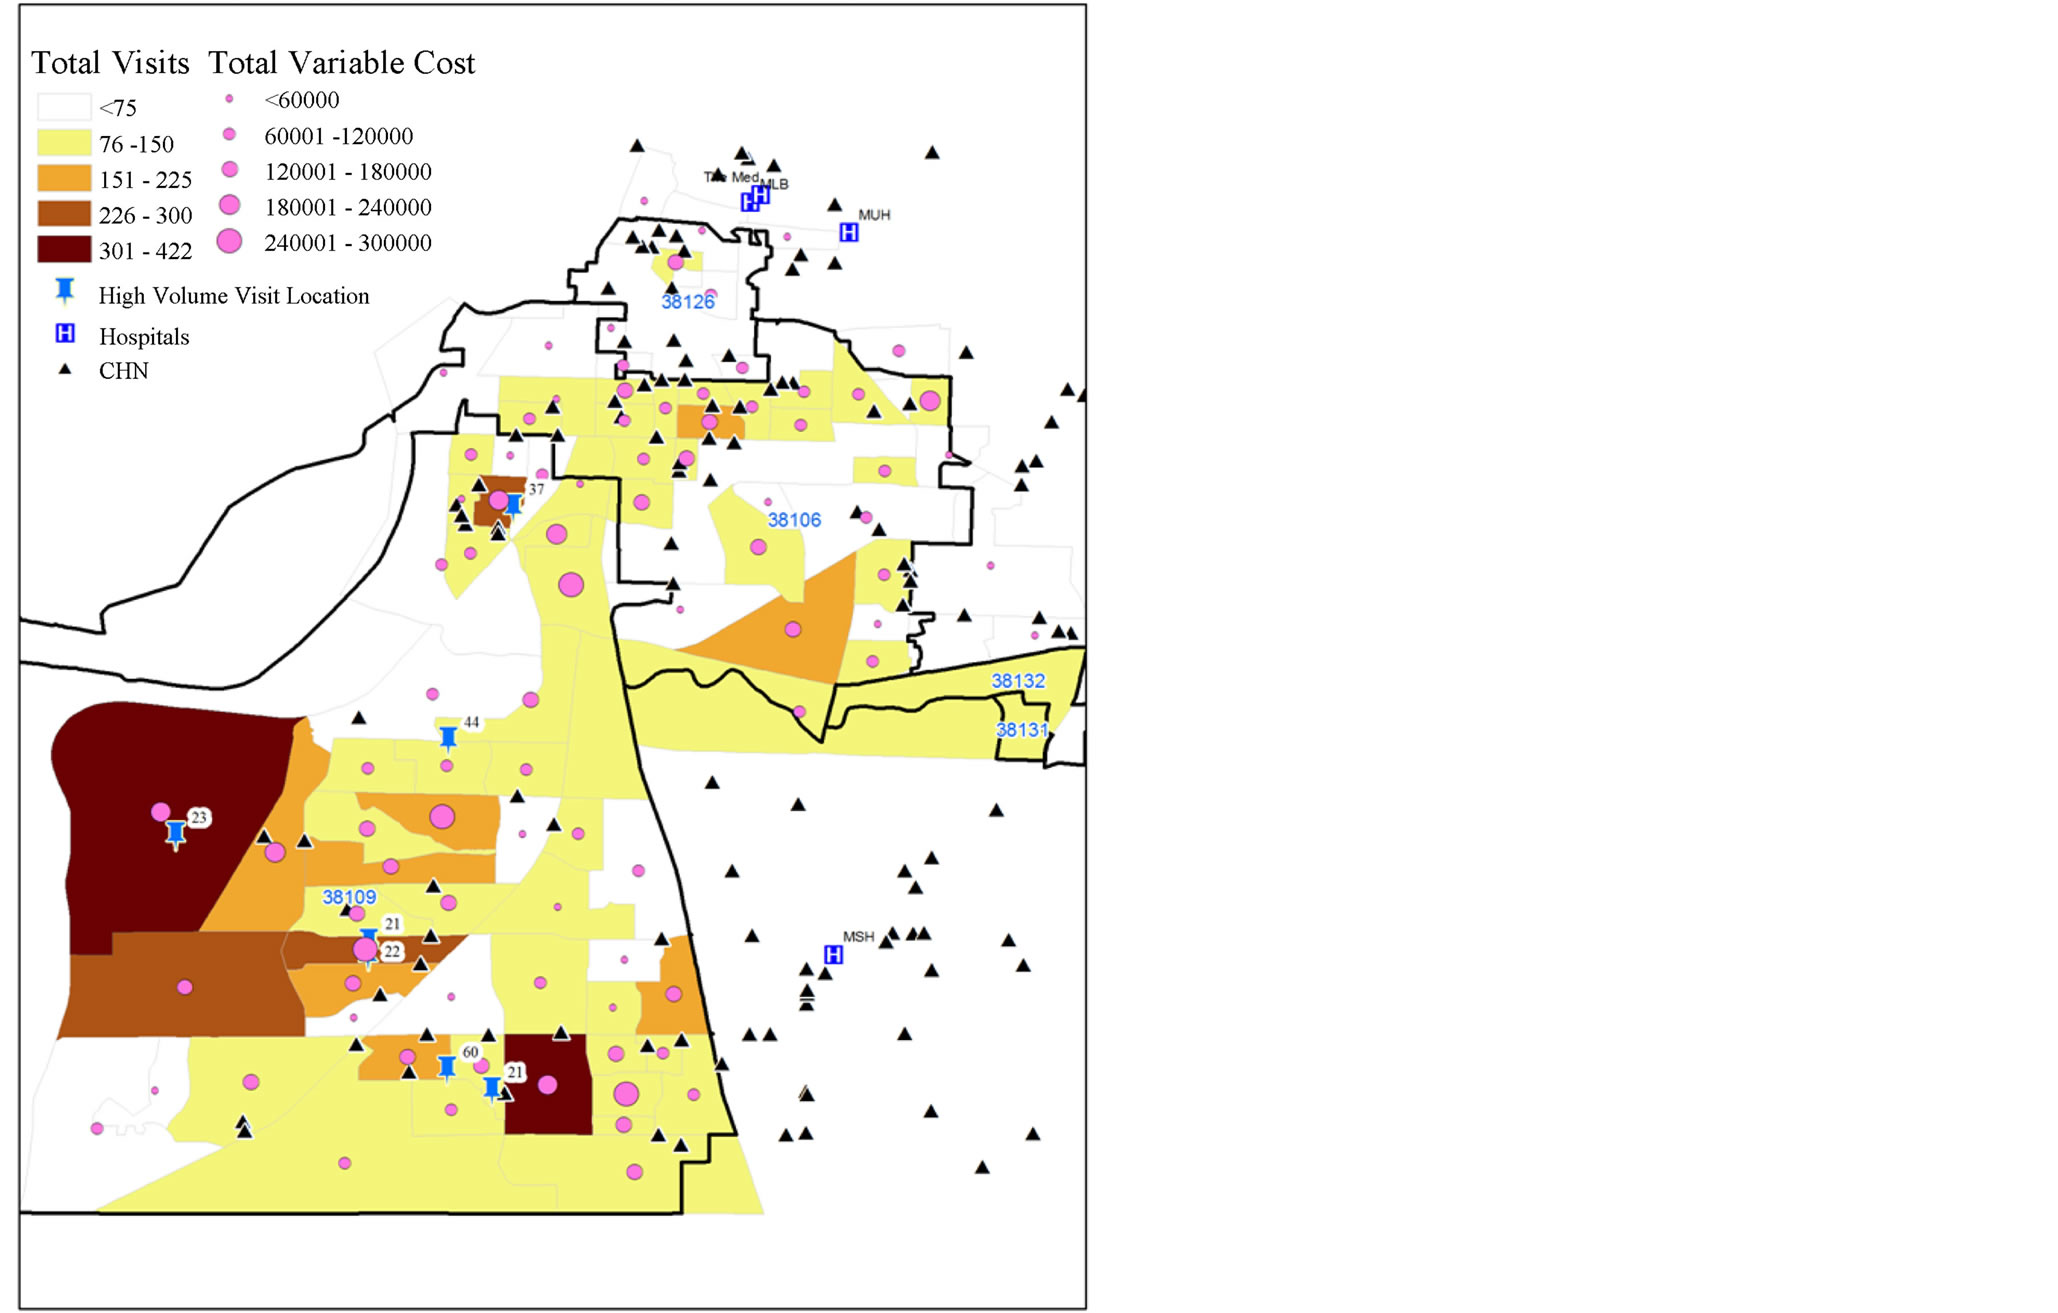
Figure 1. Charity care write off, visits and variable cost by block group, 2010.
on decreasing healthcare disparity, as well as high rates of both inpatient and outpatient service utilization. Through subsequent analysis, Cigna determined that 38109 was one of its highest utilization zip codes in the entire country with regard to emergency room utilization and costs. As a result, Cigna awarded MLH a community-based grant, hypothesizing that MLH’s hot spotting methodology and community-based interventions in this particular zip code could benefit both the hospital (in decreasing readmissions and charity care costs), as well as decrease Cigna’s costs for caring for covered lives in that area. Shared risk exists for both Cigna and MLH in this zip code: MLH for the uninsured and Cigna for their insured lives. Improving the overall health status of residents of 38109 can benefit both hospital system and payer and Cigna’s funding helped continue the ongoing work started by MLH.
5. Discussion
While quantitative review of utilization data tracked to combinations of zip codes may lead to a conclusion that a larger geographic region may be “hotter” as a function of total cost to volume when compared to one zip code, qualitative data layering greatly enhances such analyses and leads to more effective interventions. Qualitative mapping of existing community assets can help to address the problem of utilization, as well as offer useful data to deal with the challenge of taking an intervention to scale after it is proven effective. In the case of identifying existing assets, variables to consider include the density of population relative to primary care, as well as the presence of social service resources and grassroots caregiving available in the community. In our case, proximity to a hospital in the system, an FQHC partner and engaged congregational assets embedded in the community added qualitative and participatory data, which led us to focus on one zip code as opposed to many.
Participatory hot spotting also helps to facilitate the coordination of scarce resources and apply them to disparate areas of the community, leveraging the grassroots intelligence of partners in church and under-served neighborhoods to develop interventions that directly address the social determinants driving disparity. Additionally, in our case, such work attracted funding from a payer partner (Cigna), who also was at risk for higher reimbursement in 38109, with the potential to improve their bottom line for plan participants in that area. This led to even richer, multi-stakeholder collaboration in decreasing inappropriate utilization.
Traditional community health worker models’ (e.g., Promatores) return on investment has been explored and there is burgeoning interest in such frameworks [10,11]. However, Memphis’ CHN model is unique, in that it utilizes ten paid staff-our hospital-based navigators-who function in a broad-based community triage role, integrating traditional clinical care in the hospital with the work of unpaid, volunteer workers in the community (our 600 CHN liaisons). As such we have built a model that can be sustained with less funding, leverages the volunteer efforts of trusted congregational members who literally work “on the ground” in community, and honors and makes visible the work of those in the “love economy”. Additionally, MLH has further shifted power and policymaking to CHN clergy in 38109-like zip codes, by changing the By-Laws and formally adding them as voting members to our MLH Faith and Health Committee of the Board of Directors. Hence, the CHN partnership with MLH continues to build and nurture “trust” and community engagement by sharing resources, offering clergy decision and policy-making roles on our Board, as well as leveraging the “blended intelligences” of our MLH staff, senior leaders, clergy and liaisons in the community. We believe that this community-based participatory research strategy will continue to yield benefits to MLH in terms of decreased inappropriate utilization of hospital services and decreased charity care costs, as well as ultimately, decreased health disparity and improved health outcomes for the community at large.
6. Conclusions
John Snow, physician and the Father of Modern Epidemiology was the first to use a dot map to illustrate the cluster of cholera cases around a water pump in the Soho neighborhood of London in 1854. Snow used mapping to illustrate the connection between the quality of the water source and cholera cases. This project was formulated on the model created by Dr. Snow who utilized a liaison model and spatial mapping to garner community level trust-building. Interestingly, Dr. Snow also partnered very closely with Rev. Whitehead, who conducted the participatory mapping, through interviews in the Soho area, which led Dr. Snow to the index case of a female infant with a soiled diaper. Their partnership is outlined in Steven Johnson’s book, The Ghost Map [12]. Now, over 150 years later in Memphis, the partnership between our MLH researchers in various divisions and the CHN navigators and liaisons on the ground reflect the same trust and grassroots knowledge that led to ameliorating the cholera epidemic in 1854.
The Memphis Model has taken the traditional infectious disease hot spotting model and applied it to chronic co-morbidities. We are confident that this newer model in conjunction with the blended intelligence of the community and congregational partners and our staff of researchers will continue to decrease health disparity and unnecessary hospitalizations in our area and facility for years to come [13]. Finally, we believe this participatory hot spotting model can be used for disparity research and for focusing both hospital system provider and payer efforts to reduce cost, improve quality, improve population health and generate value for all constituencies concerned in an era of healthcare innovation and reform [13].
Acknowledgements
Special thanks to Gary Gunderson, Bobby Baker, Carol Weidenhoffer, Riham Ishak.
REFERENCES
- W. V. Huntington, L. A. Covington, P. P. Center, L. A. Covington and L. Manchikanti, “Patient Protection and Affordable Care Act of 2010: Reforming the Health Care Reform for the New Decade,” Pain Physician, Vol. 14, No. 1, 2011, pp. E35-E67.
- “Patient Protection and Affordable Care Act,” Pub L No. 111-148, 2010.
- P. Starr, “The Social Transformation of American Medicine: The Rise of a Sovereign Profession and the Making of a Vast Industry,” Basic Books, New York, 1982.
- J. A. Schoenman, “Understanding US Health Care Spending,” NICHM Foundation Data Brief, 2011.
- S. Chazin, I. Friedenzohn, E. Martinez-Vidal and S. A. Somers, “The Future of US Charity Care Programs: Implications of Health Reform,” Center for Health Care Strategies, Inc., Trenton, 2010.
- G. D. Randolph and J. H. Morrow, “The Potential Impact of the Affordable Care Act on population health in North Carolina,” North Carolina Medical Journal, Vol. 74, No. 4, 2013, pp. 330-333.
- T. Cutts, “The Memphis Congregational Health Network Model: Grounding ARHAP Theory,” In When Religion and Health Align: Mobilizing Religious Health Assets for Transformation, Cluster Publications, Pietermaritzburg, 2011, pp. 193-209.
- T. Cutts, B. Baker and G. Gunderson, “Innovation Profile: Church-Health System Partnership Facilitates Transitions from Hospital to Home for Urban, Low-Income African Americans, Reducing Mortality, Utilization, and Costs,”, Agency for Healthcare Research and Quality (AHRQ). http://www.innovations.ahrq.gov/content.aspx?id=3354
- E. Rafalski, “Using Data Mining/Data Repository Methods to Identify Marketing Opportunities in Health Care,” Journal of Consumer Marketing, Vol. 19, No. 7, 2002, pp. 607-613. http://dx.doi.org/10.1108/07363760210451429
- P. Duthrie, E. Phillipi and K. Mitchell, “Supporting CHWs as Part of the Health Care Team through Policy Change and Successful Supervision,” Michigan Community Health Worker Alliance Spectrum Health Healthier Communities Meeting, Big Rapids, 3 October 2012.
- “Addressing Chronic Disease through Community Health Workers: A Policy and Systems-Level Approach,” Centers for Disease Control and Prevention, Atlanta, 2011.
- S. Johnson, “The Ghost Map: The Story of London’s Most Terrifying Epidemic—And How It Changed Science, Cities and the Modern World,” Riverhead Trade, New York, 2006.
- P. B. Barnes, T. F. Cutts, S. B. Dickinson, G. Hao, S. Bowman and G. Gunderson, “Methods for Managing and Analyzing Electronic Medical Records: An Examination of Patient Outcomes for a Hospital-Congregation Based Intervention,” Population Health Management, Accepted for Publication with Revisions, 2013.