Natural Science
Vol.07 No.13(2015), Article ID:62157,8 pages
10.4236/ns.2015.713060
Non-Seasonal SSTs of the Western Tropical North Pacific
Kern E. Kenyon
4632 North Lane, Del Mar, CA, USA

Copyright © 2015 by author and Scientific Research Publishing Inc.
This work is licensed under the Creative Commons Attribution International License (CC BY).
http://creativecommons.org/licenses/by/4.0/


Received 26 November 2015; accepted 21 December 2015; published 24 December 2015
ABSTRACT
Seasonal changes in SSTs are very small in the western tropical North Pacific, in spite of the fact that significantly more solar radiation per unit time and per unit area is absorbed by the surface layer in summer than in winter and mainly at lower latitudes. Therefore, an efficient heat transport mechanism must be operating to keep up with the solar input. Sea surface temperatures from a world atlas are analyzed where it is found that the areas between the 80 and 82.5 F contours and the equator have marked seasonal variations: increasing in spring and summer as the contours move north, then decreasing in fall and winter as the contours return south. Between winter and summer, the area under the 80 F contour doubles in size. The increase of surface areas is likely due to the increase of absorption of solar radiation. When the areas decrease with time, the inferred heat in the surface layer must go somewhere. Arguments consistent with the available data suggest that the accumulated heat in spring and summer is advected north out of the tropics. The surface temperature gradient, related to the driving force for the flow, computed between the contours and the Aleutian Islands, increases slowly from January to June but then increases much faster till September, after which it rapidly decreases again. It is conjectured that cold surface water from the subarctic surges south beginning in June causing a warm tropical water pulse simultaneously to go north. The large volume of high temperature water of the surface layer in the western tropical North Pacific is thought to be the source of the permanent northward wide warm current off California as well as the additional northward warm surge in summer, both of which have been established previously on the basis of very many observations.
Keywords:
Summer Warm Surge, North Pacific Ocean

1. Introduction
An important oceanographic concept is the non-seasonality of the SSTs in the western tropical North Pacific. In this large region of the ocean, the sea surface temperatures are at most only 1 C higher in summer than in winter, whereas the seasonal temperature range at mid-latitudes is typically 10 C [1] . However, it is self-evident that more solar energy, per unit time and per unit surface area, is absorbed in the top 100 m in summer than in winter, particularly in the tropics. Understanding this dilemma is one goal of the present essay.
Some of the earliest evidence of the non-seasonality property is contained in the classical world atlas of sea surface temperatures [2] , based on ship-injection temperature data. It is well known that the accuracy of the individual measurements involved is just 1 F. Fortunately, greater accuracy is not needed in order to demonstrate the qualitative characteristics of the non-seasonality of the SSTs. For example, although the temperatures themselves do not vary all that much, the surface area between the 80 F contour and the equator in the western tropics is twice as large in summer as it is in winter according to the old atlas. It is unlikely that this feature will change significantly when more recent and more accurate SSTs are studied from this same point of view in the future. If the increase in area in summer is due primarily to the input of solar energy, then when the area decreases in winter, where does all the inferred heat in the surface layer go? Finding a reasonable explanation to answer this question is the second goal of the discussion to follow.
In a recent study of an extensive SST data set, covering the North Pacific above 20 N, coast to coast, and over a 30 year period, the suggestion was made that a separate wide body of warm surface water headed north crossing mid-latitudes in the central and eastern ocean every summer [3] . This conjecture is consistent with the North Pacific’s need to transport poleward more excess ocean heat in summer that is absorbed from the sun in the top 100 m of mainly the lower latitudes, and it is also consistent with the inability of the permanent wide warm current flowing northeast off California to either significantly deepen or speed up during the summer.
Earlier the proposal is put forward that there is a permanent wide warm surface current flowing northeast off California [4] . If one is to go due west from any part of the coast of California, in any year and at any time of the year, sequentially recording sea surface temperature, it will be found that the temperature slowly increases to a maximum and then decreases again over a total distance of several thousand kilometers. This real and permanent longitudinal maximum in SST is a key signature of the northward current. Then, the suggested additional warm surge takes place in summer alongside and to the west of the permanent flow.
Support for the origin of the wide warm current off California, which becomes even wider in summer due to a separate warm surge, being the warmest western topical surface layer waters year around is offered below by taking into account SST data that include observations below 20 N, and putting together a few reasonable interpretations of these observations coupled with some stated assumptions.
2. Where Non-Seasonal SSTs Occur
Where the non-seasonal sea surface temperatures occur in the western tropics of the North Pacific is also the place where the warmest temperatures in the whole ocean are to be found all year long. This striking fact has important consequences, although there is very little discussion of it in the recent text books. In the 1970s I was made acquainted with that unusual feature by a professor of oceanography at Scripps, who was senior to me (I was an assistant research oceanographer). Since then I have learned that the idea was not entirely new with him because a similar feature was described in print long ago to take place in the western tropical North Atlantic by M. F. Maury [5] . Why is it that in these particularly large regions the surface temperatures are no higher in summer than in winter, when it is self-evident than more solar energy per unit time and per unit area is absorbed in the top 100 m in summer than in winter, especially in the tropics? A very efficient heat export mechanism must be in place which keeps pace with that of the solar energy input. Next, it will be argued that heat is constantly being carried out of the western tropics by northward advection, and more so in summer than in winter.
3. SSTs of the Western Tropical North Pacific
Since the most extensive SST data set, the Namias-Scripps ship-injection temperatures, does not extend south of 20 N in the North Pacific, another source of observations is needed for exploring the surface and surface layer of that part of the ocean: the classical World Sea Surface Temperature Atlas, H. O. 225 [2] , which is also based on ship-injection temperatures.
In Figure 1, taken directly from the 12 charts of the western Pacific of H. O. 225 [two of which are reproduced in Figure 4 and Figure 5], is displayed the area between the equator and the 82.5 F contour and the area between the equator and the 80 F contour as functions of month in the western North Pacific. Counting of the
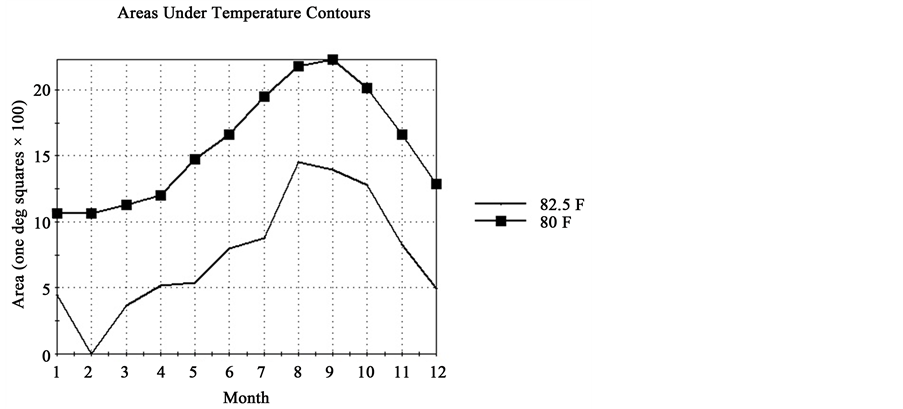
Figure 1. Area (units of one degree square × 100) between the 80 F contour (upper curve) and the equator and area between the 82.5 F contour (lower curve) and the equator as functions of month (1 = January, etc.).
one degree squares, provided as a background grid in the charts, was carried out by starting at the equator for a given longitude, and going north to the 82.5 F contour, beginning at 120 E east, or where the nearest land/ocean boundaries east of it are, and proceeding to the longitude where that temperature contour crosses the equator and never comes back. For the 80 F contour the counting of squares for the area was carried out in the same way but stopped at the arbitrarily chosen longitude of 160 W, since the real concern here is with the western tropics and also the 80 F contour converges toward but does not cross the equator in most months. This procedure gives surface areas in terms of the total number of one degree latitude/longitude squares contained below the 82.5 F contour and above the equator in the western North Pacific and below the 80 F contour and the equator. By interpretation, for purposes of discussing surface layer heat content, the total areas of Figure 1 can be converted into volumes through multiplication by a constant characteristic depth of 100 m, within which over 90% of the solar radiation which enters the ocean is absorbed.
As can be seen in the figure, the total areas have distinct seasonal changes and vary significantly from one month to the next, in contrast to the sea surface temperatures inside the areas which do not change from month to month, or only change a little. Presumably in the months from February to August, where the areas in Figure 1 are monotonically increasing, the explanation can be ascribed primarily to the in situ absorption of solar radiation, because it also increases from one month to the next at that time of year, plus some heat trickling in from the east by currents that the trade winds push along. So what happens, for example, in the months from August to February when the areas in Figure 1 successively shrink in size? Where does all that inferred heat go?
When the areas in Figure 1 increase or decrease, they do so mainly by the contours moving north or south (Figure 2 shows this for the 80 F contour). In all cases the longitude of the maximum latitude of the 80 F contour, used in the construction of Figure 2, was located well out in the open ocean and not immediately off the western boundary (longitudes of the maximum range from 130 to 160 E). Gently curving temperature contours produce large-scale longitudinal maxima. [Where the 82.5 F contour crosses the equator (not shown) ranges from 162 W to 167 E but with no apparent systematic seasonal variation.]
Consider briefly the northward gradient of sea surface temperature in the North Pacific, which is set up and maintained by the sun. An estimate of the mean northward SST gradient is given in Figure 3 as a function of month based on H. O. 225. Differences in surface temperature were taken between that of the 80 F contour and an average of that at the Aleutian Island chain, and differences in latitude were taken between the maximum latitude of the 80 F contour and the average latitude of the Aleutian Island chain. Then the ratios of the temperature differences to the latitude differences were computed and given in the figure in units of degrees F per degree of latitude. What is to be noticed at a quick glance in Figure 3 is the gradual rise in the magnitude of the gradient between January and September, followed by a quicker decline. The gradient maintains the same sign
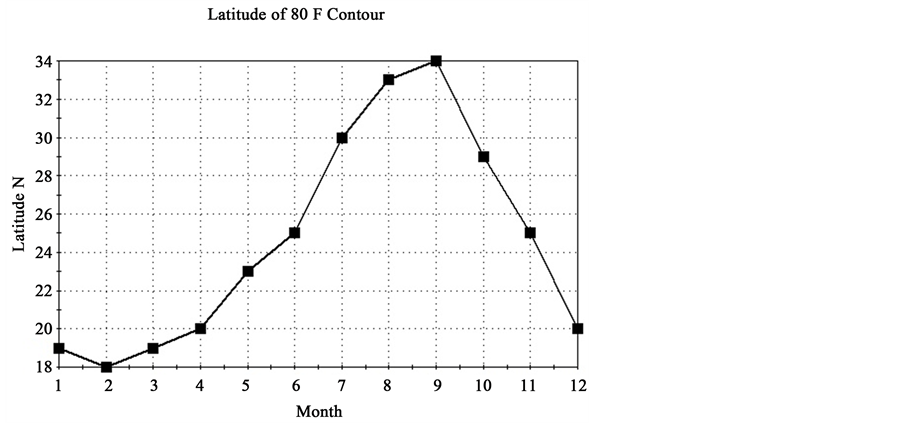
Figure 2. Maximum latitude of 80 F sea surface temperature contour in the western North Pacific as a function of month (1 = January, etc.).
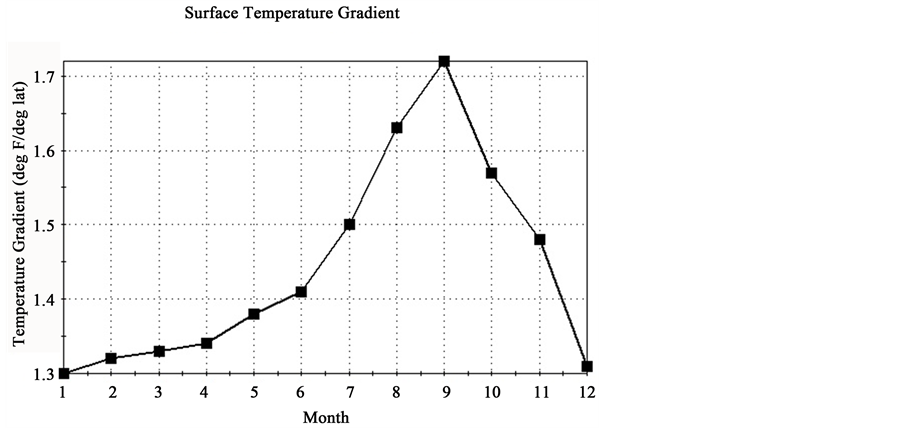
Figure 3. Sea surface temperature gradient (units of degree F per degree of latitude) for the western North Pacific as a function of month (1 = January, etc.).
since equatorial temperatures are always higher than subarctic temperatures, but the magnitude of the gradient has a seasonal variation.
Figure 4 and Figure 5 are reproduced from the H. O. 225 Atlas to show the isotherms for the two extreme conditions (February and August) in the western Pacific to help orient the reader. A similar thing was done many years ago for the Atlantic by Maury [5] , stimulating his imagination greatly.
4. Discussion
At this point an assumption is inserted in order to help make further progress in the argument: no north or south currents exist along the equator that could transport heat from one hemisphere to the other. Behind the assumption is the reasonable hypothesis that each ocean, North and South Pacific, can effectively and individually accomplish its heat balance requirements on its own. One reason is that in the North and South Pacific Oceans there are wide open water regions that connect the equatorial zones with the subarctic (or subantarctic) zones in
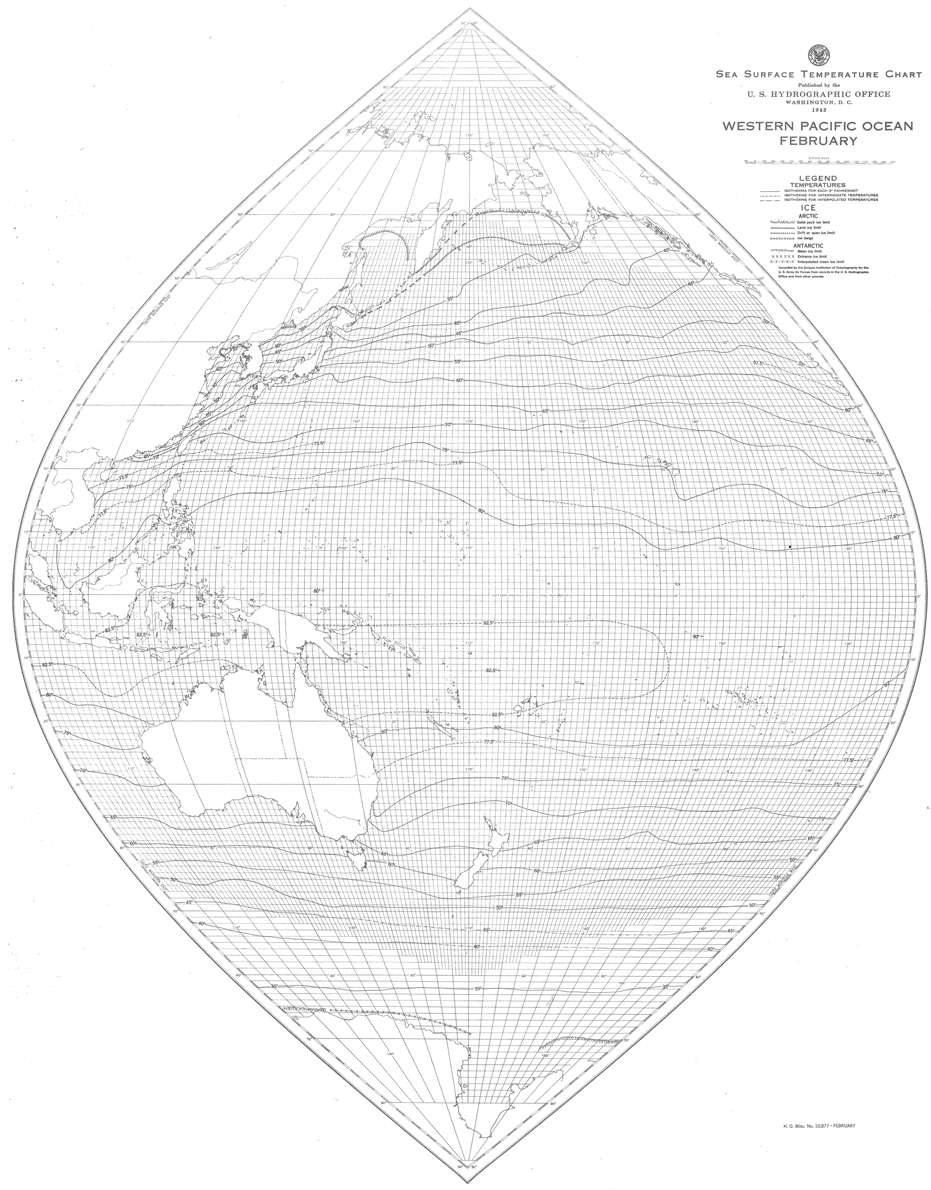
Figure 4. February isotherms of sea surface temperature in the western Pacific Ocean (from H. O. 225 Atlas).
which the possibility exists that continuous streams of flow can connect the low and high latitudes and thereby partially, at least, satisfy the necessary heat balances, by means of cold currents coming south and warm currents going north, on a permanent basis.
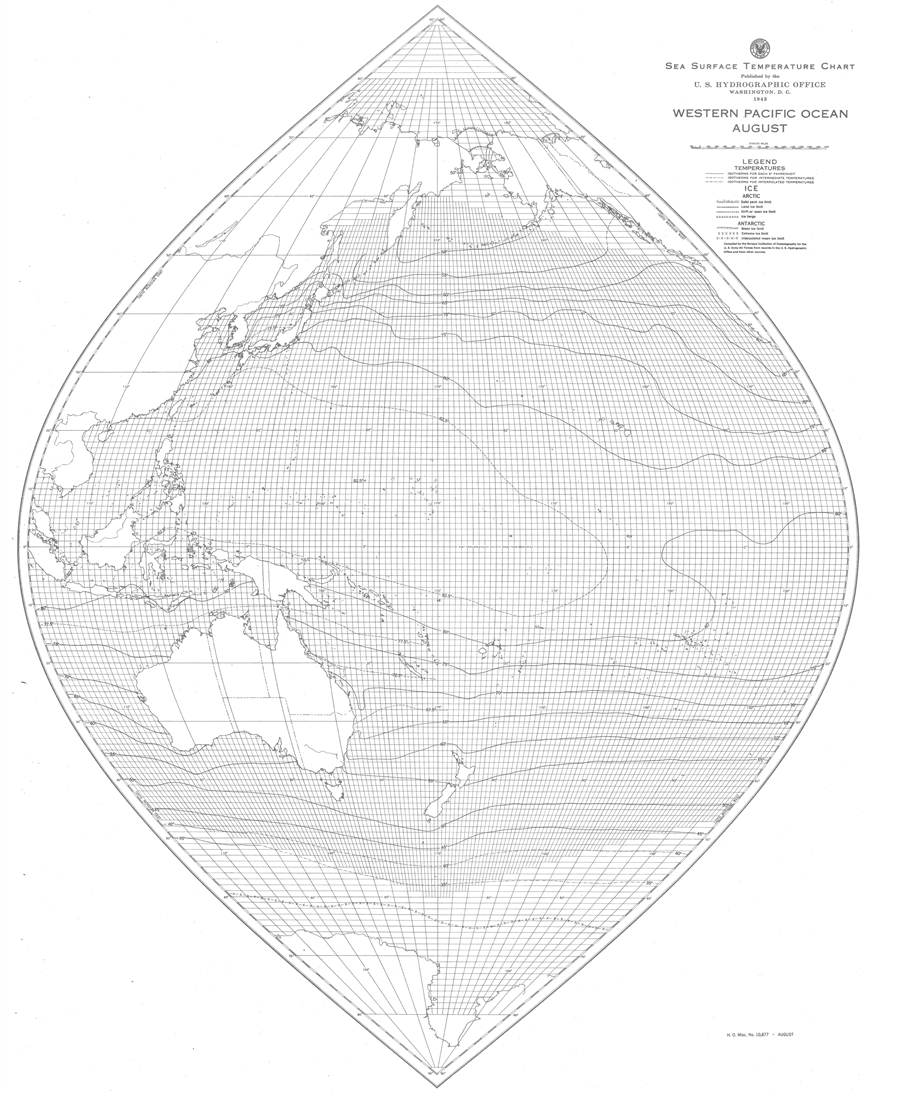
Figure 5. August isotherms of sea surface temperature in the western Pacific Ocean (from H. O. 225 Atlas).
Thus, warm North Pacific surface layer water does not cross the equator in the western Pacific by assumption. Consistent with this picture is the cold surface water in the eastern Pacific that flows west along the equator, as suggested by the sea surface temperatures of the H. O. 225 Atlas. Undoubtedly originating near Antarctica, since penguins exist on the Galapagos Islands right on the equator, and moving north along the coast of South America in the Humboldt Current, when it reaches the equator the cold water turns left and goes straight west, apparently not crossing the equator. In addition, the submerged undercurrent is symmetric about the equator and swiftly flows due east.
In the far west of the basin (around 120 E), and between about 20 N and the equator, there is not a continuous continental boundary in the usual sense. Nevertheless, a westward flow should be mostly stopped by land from moving into the northern Indian Ocean, at least according to the way the land is depicted in the temperature atlas (Figure 4 and Figure 5). Therefore, for the present purpose the majority of westward flow is considered to be effectively halted by the presence of islands, peninsulas, etc.
Returning to the primary question sparked by Figure 1: where does all the heat in the surface layer of the western tropical North Pacific go between August/September and January/February? Part of the answer is that very little of it could be expected to move vertically downward by mixing or other physical processes. One main feature opposing the movement of heat downward is that there is a buoyant force holding the warm surface layer up due to the presence of the thermocline that exists most places in the open ocean, together with the fact that temperature usually dominates over salinity in influencing the density of sea water.
Neither is it anticipated that any significant amount of heat from the surface layer would be transported vertically upward into the atmosphere by conduction or evaporation. Cloud bands parallel to and just north of the equator [6] have the tendency to reduce both conduction and evaporation as well as trap long wave radiation from the ocean thereby keeping the air warm and moist near the sea surface.
Plausible conjectures for negligible vertical heat transfer from the sea surface, up or down, for the western tropical North Pacific need to be substantiated with observations when they become available. Also the assumed zero cross-equatorial flow of heat in the surface layer should be verified. Hopefully, once that work is successfully completed, then there is only one option left: northward exporting of the excess tropical heat.
Assuming minimal heat transfer between the ocean and atmosphere in the tropics, then a northward movement of the temperature contours in spring and summer (Figure 2) may be a good indication that the warm surface waters there are moving north as well, and at the same speed. From Figure 2 the average northward speed calculated between April and July is 14.4 cm/sec (10 degrees of latitude in 3 months), which is right in the range of 10 - 20 cm/sec estimated previously for the northward flow of the wide warm current at mid-latitudes [6] .
When a large volume of warm surface water heads north and leaves the tropics, starting around August or shortly before on the average, the net effect will be to cause the latitude of the temperature contours to drop south. That will qualitatively account for the negative slope of the curve on the right side of Figure 2.
5. Northward Warm Flow Mechanics
Within the surface layer the temperature decreases from the tropics to the subarctic (Figure 3), which is the same as saying that the water density increases from south to north at and near the surface. Such an arrangement is inherently unstable because the cold northern water will try to rush south. When that happens, the warm water must move out of the way. Otherwise instability is not of any concern for the flow regime that is already operating, i.e. the permanent warm surface flow going north off California, with a permanent cold flow moving south underneath and on either side of the warm flow. It is the cold water in the north that drives this whole convective system throughout the year including the additional warm surge at the surface in summer.
As cold water goes south due to a horizontal pressure force created by the north/south density difference in the surface layer, there is no force to oppose that motion except for internal friction. The Coriolis force acts to the right of the flow in the northern hemisphere. Thus a warm flow that may start out heading due north in the tropics will become a northeastward flow, and a cold flow that begins going due south in the subarctic will turn into a southwestern flow.
What can be inferred from Figure 3 is that the horizontal driving force for the southward flow gradually increases in strength from January to June, and then more rapidly strengthens until September, after which the magnitude decreases rapidly again to December. Then a guess can be made that would be consistent with Figure 3. In June either a new cold surge from the subarctic starts south, or an existing one is enhanced, which in turn causes simultaneously a new warm surge to head north out of the tropics. Such a speculation might serve as a model to be confirmed or refuted in the future.
6. Conclusion
Earlier studies of ocean observations have revealed the existence of a wide warm current flowing northeast off California that is a real and permanent part of the surface and near surface circulation at mid-latitudes of the eastern North Pacific. Also each summer, a separate surge of warm surface water heads north to the west of the permanent flow. These findings have been based on extensive ship-injection sea surface temperatures as well as more accurate and closely spaced surface and subsurface hydrographic measurements. To understand the source of the wide warm flows, it is necessary to analyze surface temperature data below 20 N, which has been done here using a classical world atlas. Results are that in the western tropical North Pacific there is a large body of the warmest sea surface temperatures which have a very small seasonal variation, because at all times of the year, and particularly in summer, excess heat from absorbed solar radiation in the top 100 m is advected north out of the tropics. Then, the Coriolis force bends these northward currents to the east to join up with those flows already established at mid-latitudes. Cold surface waters from the subarctic moving south are the cause of the warm flows going north above them. After some assumptions have been made, these conclusions are consistent with the data which are available at this time.
Cite this paper
Kern E.Kenyon, (2015) Non-Seasonal SSTs of the Western Tropical North Pacific. Natural Science,07,605-612. doi: 10.4236/ns.2015.713060
References
- 1. Kenyon, K.E. (2013) Seasonal Sea Surface Temperatures of the North Pacific. Natural Science, 5, 875-879.
- 2. (1942) World Atlas of Sea Surface Temperatures. 2nd Edition, H. O. No. 225, US Navy, Washington DC.
- 3. Kenyon, K.E. (2014) North Pacific Month to Month SST Changes. Natural Science, 6, 1179-1185.
- 4. Kenyon, K.E. (2012) The Wide Warm Current of the North Pacific. Lambert Academic Publishing, Saarbrucken.
- 5. Maury, M.F. (1963) The Physical Geography of the Sea and Its Meteorology. Belknap Press, Cambridge, 346. http://dx.doi.org/10.4159/harvard.9780674865280
- 6. Sadler, J.C., Oda, L. and Kilonsky, B.J. (1976) Pacific Ocean Cloudiness from Satellite Observations. National Science Foundation, Department of Meteorology, University of Hawaii, Honolulu.