Natural Science
Vol.4 No.12A(2012), Article ID:26129,44 pages DOI:10.4236/ns.2012.412A139
Discovery and validation of potential drug targets based on the phylogenetic evolution of GPCRs
![]()
State Key Laboratory of Pharmaceutical Biotechnology, College of Life Sciences, Nanjing University, Nanjing, China; *Corresponding Author: yangjie@nju.edu.cn
Received 8 October 2012; revised 10 November 2012; accepted 23 November 2012
Keywords: Pharmaceutical Targets for Drug Development; G-Protein Coupled Receptors; Scoring Matrices; Hit Rates
ABSTRACT
Target identification is a critical step following the discovery of small molecules that elicit a biological phenotype. G-protein coupled recaptors (GPCRs) are among the most important drug targets for the pharmaceutical industry. The present work seeks to provide an in silico model of known GPCR protein fishing technologies in order to rapidly fish out potential drug targets on the basis of amino acid sequences and seven transmembrane regions (TMs) of GPCRs. Some scoring matrices were trained on 22 groups of GPCRs in the GPCRDB database. These models were employed to predict the GPCR proteins in two groups of test sets. On average, the mean correct rate of each TM of 38 GPCRs from two test sets ( and
and ) was found 62% and 57.5%, respectively, using training set 18 (
 ); the mean hit rate of each TM of 38 GPCRs from
  and
and  was found 68.1% and 64.7%, respectively. Based on the scoring matrices of PreMod, the mean correct rate of each TM of GPCRs from
  and
and  was found 62% and 62.04%, respectively; the mean hit rate of each TM of GPCRs from
  and
and  was found 67.7% and 68.0%, respectively. The means of GPCRs in
  based on
  is close to those based on PreMod; whereas the means of GPCRs in
  based on
  is less than those based on PreMod. Moreover, the accuracy (“2”) and validity (“2 + 1”) rates of prediction all seven TMs of 38 GPCRs by the scoring matrices of PreMod are more than those by
 ,
,  and
and ; whereas the hit rates (94.74% and 97.37%) by PreMod are less than those of
  but bigger than those of
  and
and , respectively. This is the reason that we choose PreMod to predict some potential drug targets. 22 GPCR proteins in the sense chain of chromosome 19 constructing validation set were predicted and validated by PreMod whose hit rate is up to 90.91%. Further evaluation is under investigation.
1. INTRODUCTION
G-protein coupled receptors (GPCRs) are among the most important drug targets for the pharmaceutical industry [1]. More than 30% of all marketed therapeutics interacts with them. GPCRs are integral membrane proteins that possess seven membrane-spanning domain or transmembrane helices with the N terminal of these proteins located in extracellular and the C-terminal extended in the cytoplasm. They comprise a large protein family of transmembrane receptors that sense molecules outside the cell and activate inside signal transduction pathways and, ultimately, cellular responses. The heterotrimeric G proteins (guanine nucleotide-binding proteins) are signal transducers, attached to the cell surface plasma membrane, that connect receptors to effectors and thus to intracellular signaling pathways [2,3]. The extracellular signals are received by GPCRs that activate the G proteins, which communicate signals from many hormones, neurotransmitters, chemokines, and autocrine and paracrine factors by several distinct intracellular signaling pathways [2]. These pathways interact with one another to form a network that regulates metabolic enzymes, ion channels, transporters, and other components of the cellular machinery controlling a broad range of cellular processes, including transcription, motility, contractility, and secretion. These cellular processes in turn regulate systemic functions such as embryonic development, gonadal development, learning and memory, and organismal homeostasis [2]. G protein-dependent and G protein-independent pathways each have the capacity to initiate numerous intracellular signaling cascades to mediate these effects [4]. G proteins are GTPases (guanosine triphosphatases) that cycle between a GDP-bound form and a GTP-bound form [5]. The GTP-bound G protein is an active form that interacts with downstream effectors and transmits signals, during which the bound GTP is often hydrolyzed to GDP and the G protein recycles into the inactive GDP-bound form [5]. The heterotrimeric G protein complex comprises a Gα subunit, of which there are 4 main families (Gαs, Gαi/o, Gαq/11, and Gα12/13), coupled to a combination of Gβ and Gγ subunits, of which there exist 6 and 12 members, respecttively [2,4]. Gα subunit binds to guanine nucleotides while Gβγ subunits cannot be dissociated under nondenaturing conditions. The activity of G proteins is regulated mainly through three classes of regulatory proteins: GTPase-activating proteins (GAPs), guanine nucleotideexchange factors (GEFs), and guanine nucleotide-dissociation inhibitors (GDIs) [6]. Upon activation, the GTPbound Gα subunit dissociates from Gβγ subunits, and serves as the major signaling messenger by interacting with its signal acceptors (downstream effectors) [2].
Mammalian GPCRs constitute a superfamily of diverse proteins with hundreds of members [7,8]. GPCRs can be grouped into 6 classes based on sequence homology and functional similarity [9,10]: Class A (Rhodopsin-like receptors) [11], Class B (Secretin receptor family) [12], Class C (Metabotropic glutamate/pheromone receptors) [13], Class D (Fungal mating pheromone recaptors) [14], Class E (Cyclic AMP receptors) [15], and Class F (Frizzled/Smoothened, F/S) [16,17]. GPCRs act as receptors for a multitude of different signals [8]. One major group, referred to as chemosensory GPCRs (csGPCRs), is receptors for sensory signals of external origin that are sensed as odors [18,19], pheromones, or tastes [20]. Most other GPCRs respond to endogenous signals, such as peptides, lipids, neurotransmitters, or nucleotides [21,22]. These GPCRs are involved in numerous physiological processes, including the regulation of neuronal excitability, metabolism, reproduction, development, hormonal homeostasis, and behavior [8]. A characteristic feature of GPCRs differentially expressed in many cell types in the body, together with their structural diversity, has proved important in medicinal chemistry. GPCRs are involved in many diseases, and are also the target of around half of all modern medicinal drugs [23]. Of all currently marketed drugs, >30% are modulators of specific GPCRs [24]. However, only 10% of GPCRs are targeted by these drugs, emphasizing the potential of the remaining 90% of the GPCR superfamily for the treatment of human disease [8].
Additionally, Celera’s initial analysis of the human genome found 616 GPCRs [25] and Takeda et al. [26] found 178 intronless nonchemosensory GPCRs, whereas the International Human Genome Sequencing Consortium reported a total of 569 “rhodopsin-like” (i.e., Class A) GPCRs [27]. Vassilatis DK and co-worker conducted a comprehensive analysis and reported that the repertoire of GPCRs for endogenous ligands consists of 367 receptors in humans and 392 in mice. Included here are 26 human and 83 mouse GPCRs not previously identified [8]. Phylogenetic analyses cluster 60% of GPCRs according to ligand preference, allowing prediction of ligand types for dozens of orphan receptors. Expression profiling of 100 GPCRs demonstrates that most are expressed in multiple tissues and that individual tissues express multiple GPCRs. Over 90% of GPCRs are expressed in the brain. Strikingly, however, the profiles of most GPCRs are unique, yielding thousands of tissueand cell-specific receptor combinations for the modulation of physiological processes.
Moreover, diverse members of GPCR superfamily participate in a variety of physiological functions and are major targets of pharmaceutical drugs. GPCRs are one of the most important target classes in pharmacology and are the target of many blockbuster drugs [28]. The presumably α-helical transmembrane regions (TMs) of GPCRs are probably arranged with similarity to bacteriorhodopsin (brh) [29]. Except for low-resolution electron diffraction [30,31] and high resolution X ray-based crystallography [32] of brh, the first crystal structure of a mammalian GPCR, bovine rhodopsin [33], was solved. In 2007, the first structure of a human GPCR, β2-adrenergic receptor, was solved [34,35]. In particular, GPCRs are of enormous importance for the pharmaceutical industry because 52% of all existing medicines act on a GPCR [36]. Very well-known therapeutic drugs such as β-blockers and anti-histamines act on GPCRs. This explains why so many three-dimensional models of GPCRs have been built. Early structural models, such as HIV-1 co-receptor CCR5 (chemokine receptors) [37,38], and human thromboxane receptor [39], are based on the atomic coordinates of the brh structure; some models, e.g. human ADP receptor (Purinergic Receptor P2Y12) [40], are constructed by homology modeling using bovine rhodopsin as a template. All of these modeling studies combined with bioinformatics and chemoinformatics become amenable to the rational design of novel drugs targeting GPCRs in the human genome [28].
These models would contribute to a better understanding of the structure and the function of GPCRs, as well as the ligand-receptor interaction. The present study is devoted to use bioinformatics and computational modeling to build up GPCRs’ theoretical modeling and folding fashions, for prediction of unknown GPCRs in the human genome and studying the interaction between GPCRs ant their ligands at the molecular level.
2. MATERIALS AND METHODS
Structural data of G-protein coupled receptors (GPCR) were taken from a new release of the GPCRDB v.7.6 (http://www.gpcr.org/7tm/htmls/entries.html) based on the latest UniProtKB (Universal Protein Knowledgebase) release of 15-May-2006 (http://www.ebi.ac.uk/swissprot/; http://au.expasy.org/)
, which contain approximately 764 proteins. Their GPCR family profiles are updated. Their amino acid sequences were from Genbank (http://www.ncbi.nlm.nih.gov/Genbank/index.html).
and SWISSPROT. The secondary structure of protein residues corresponds to the DSSP method and their seven TMs were determined based on the GPCR superfamily.
2.1. Data Partitioning
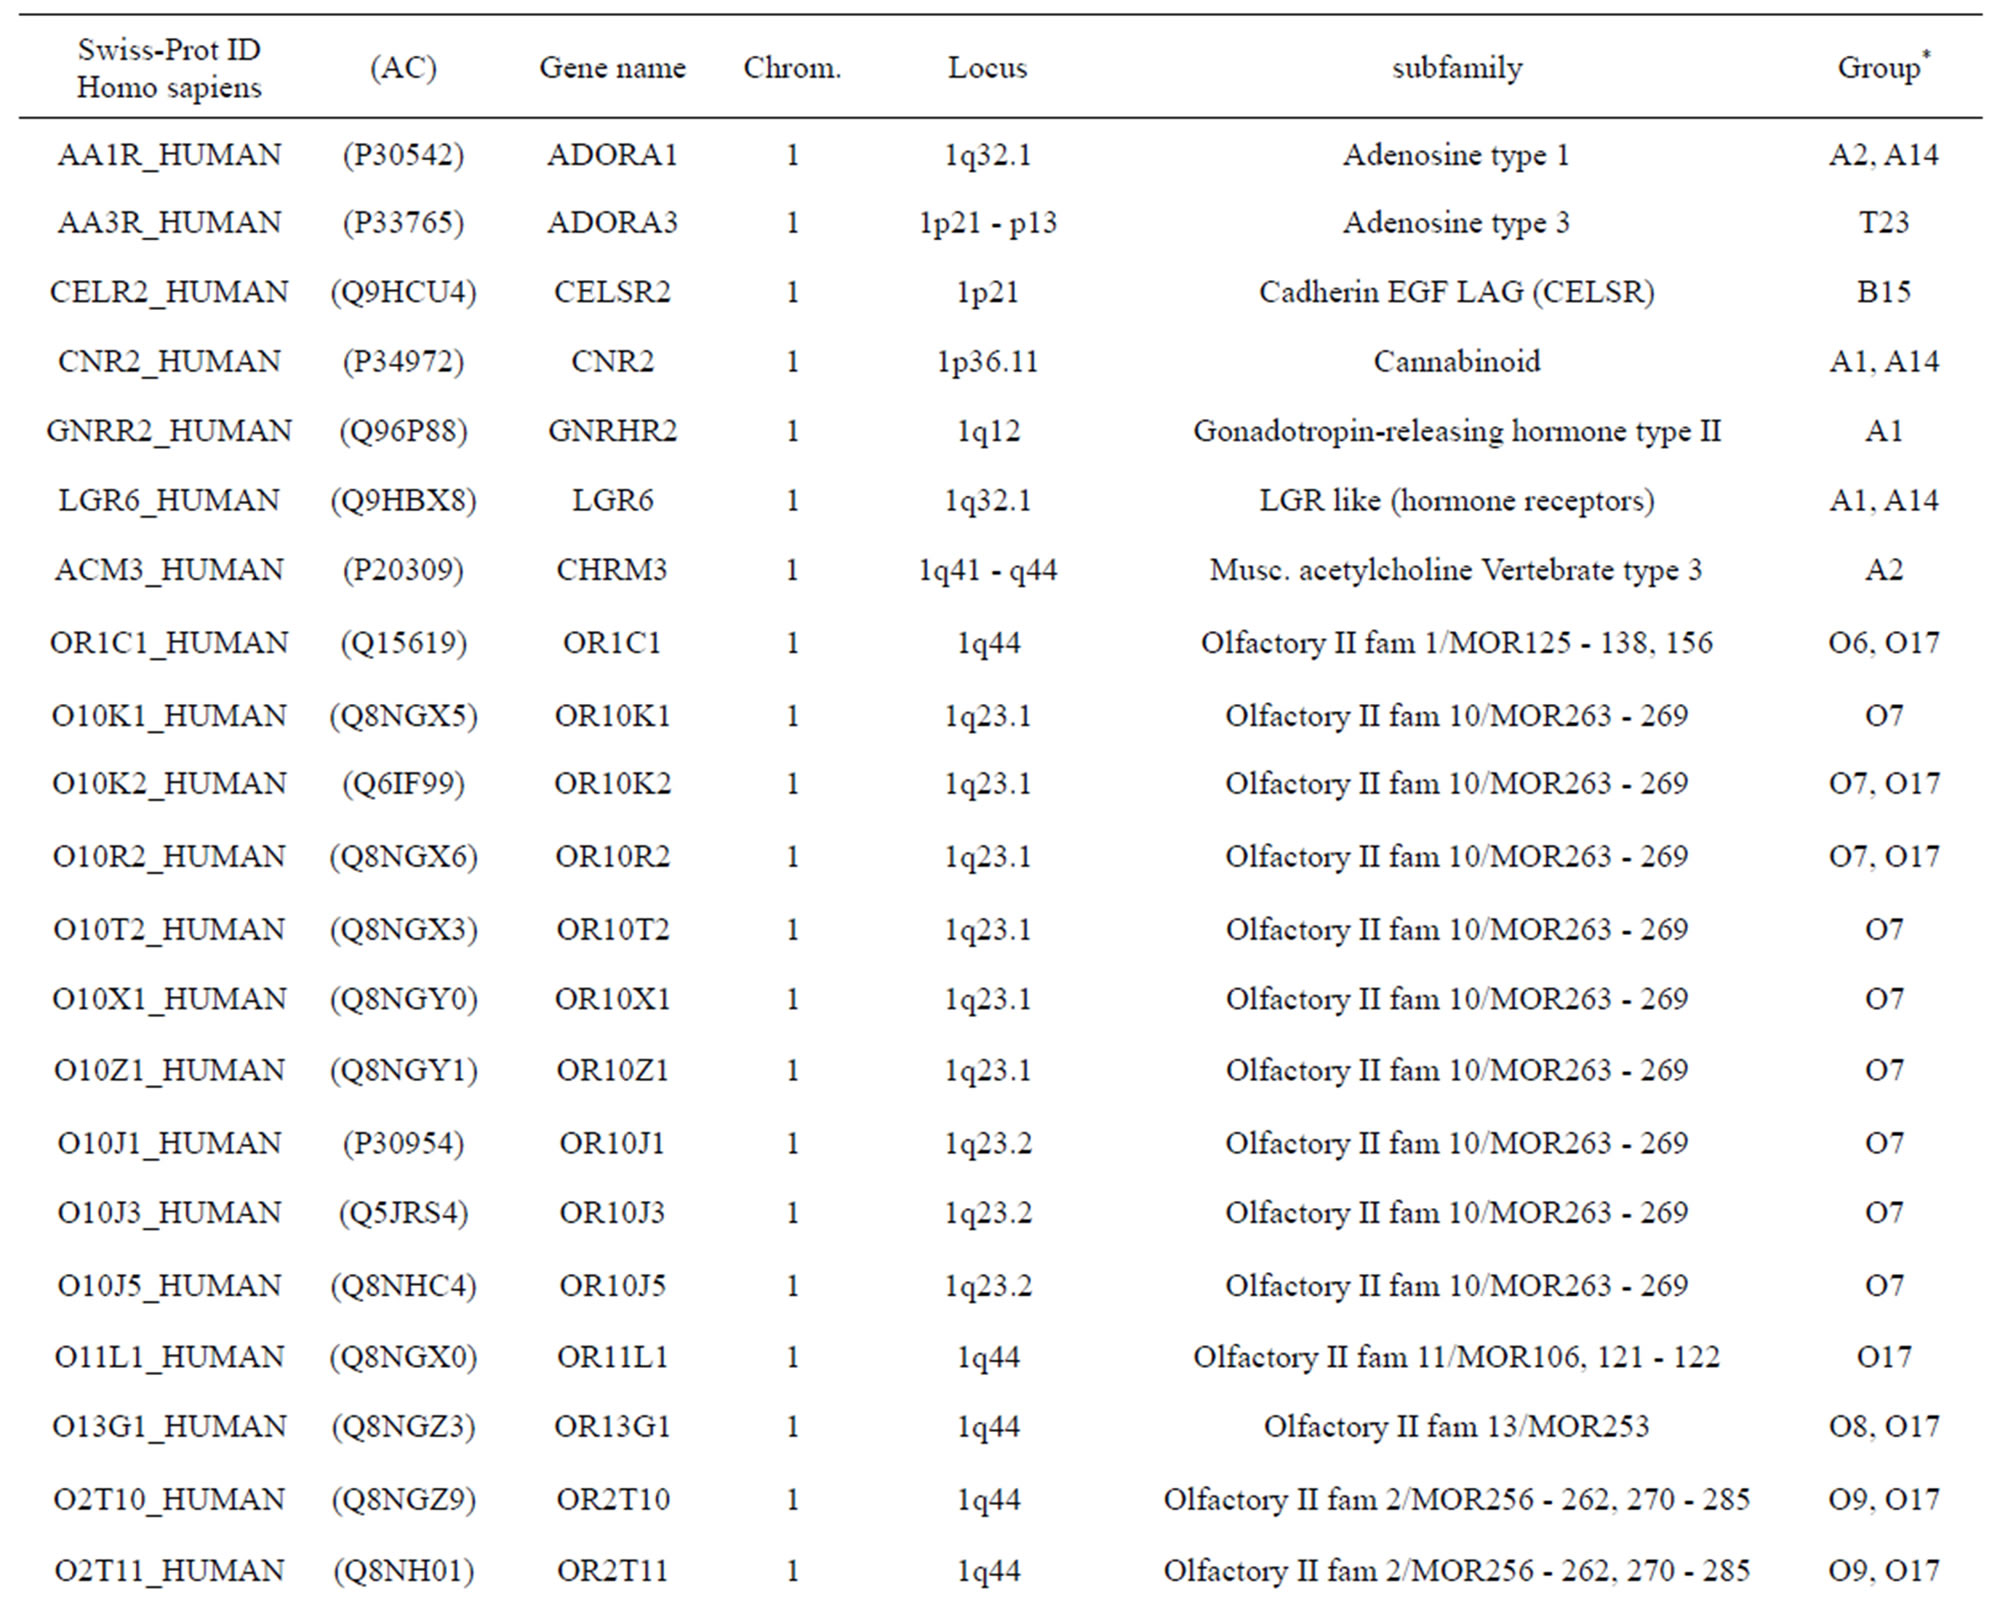
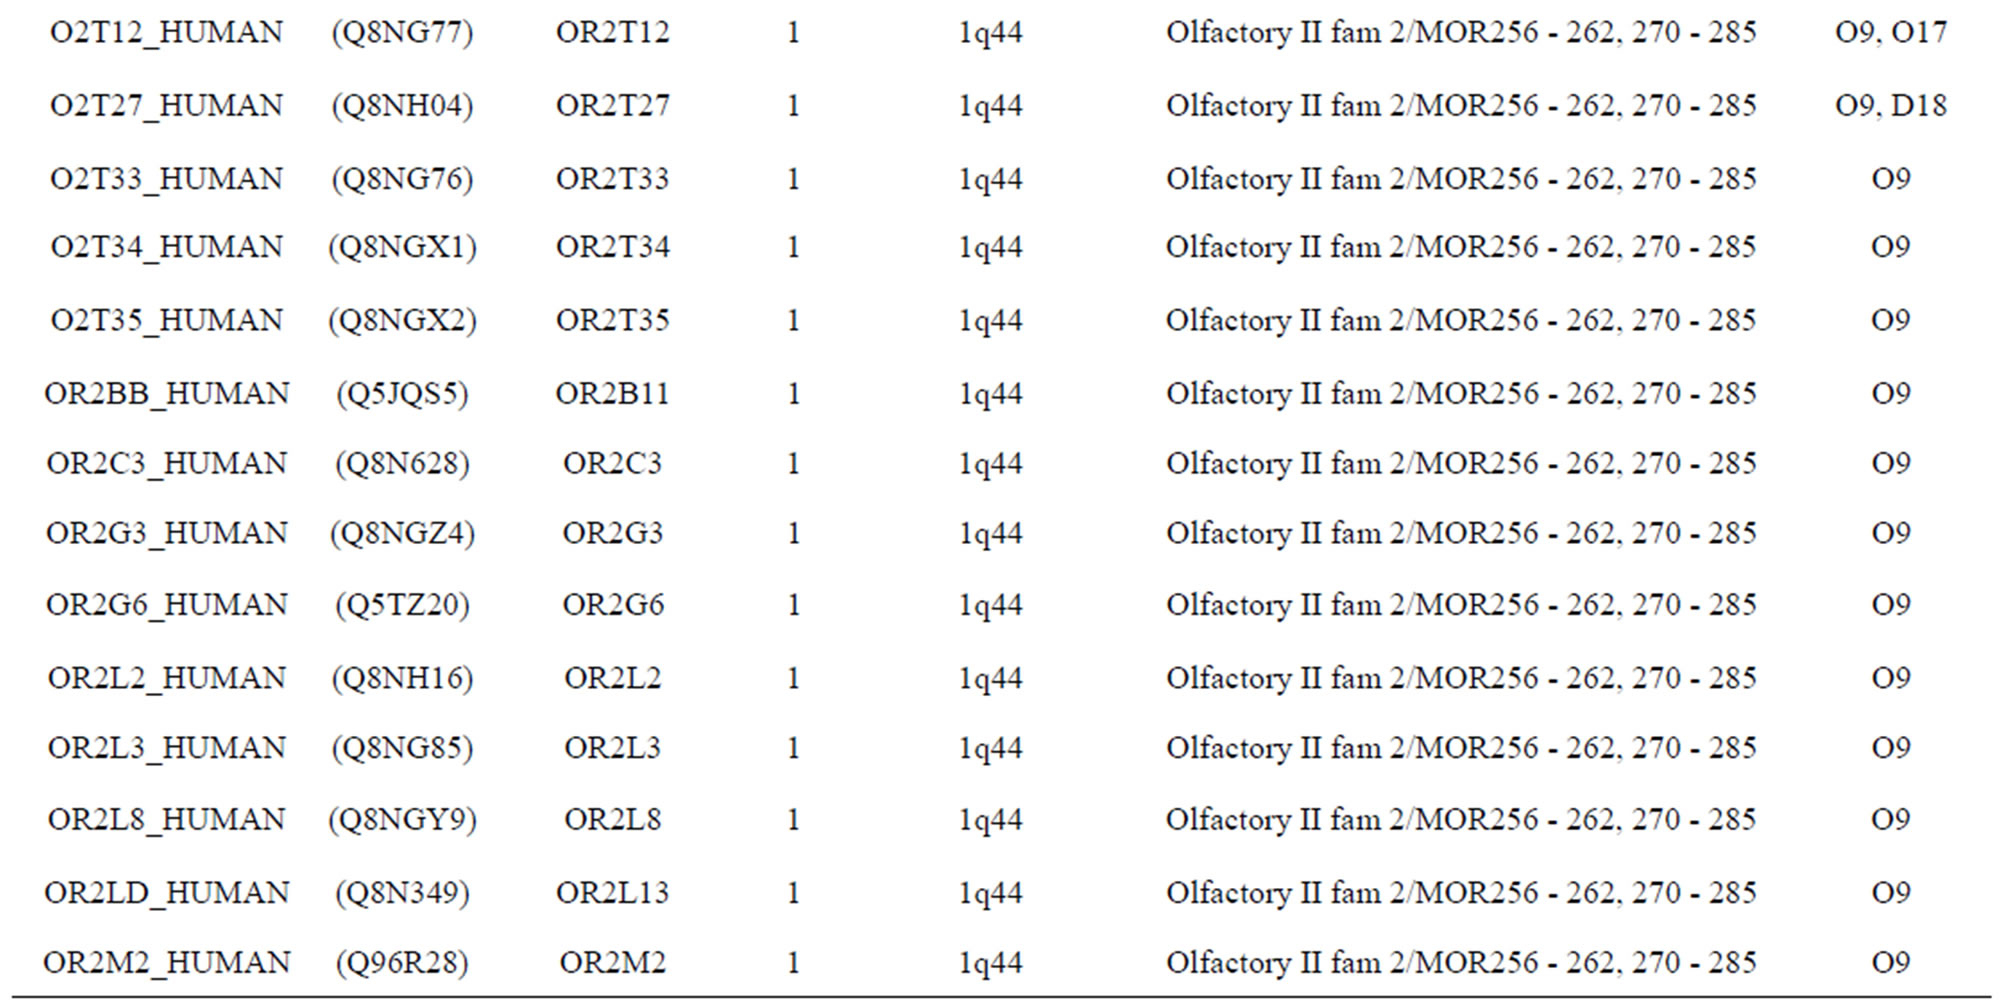
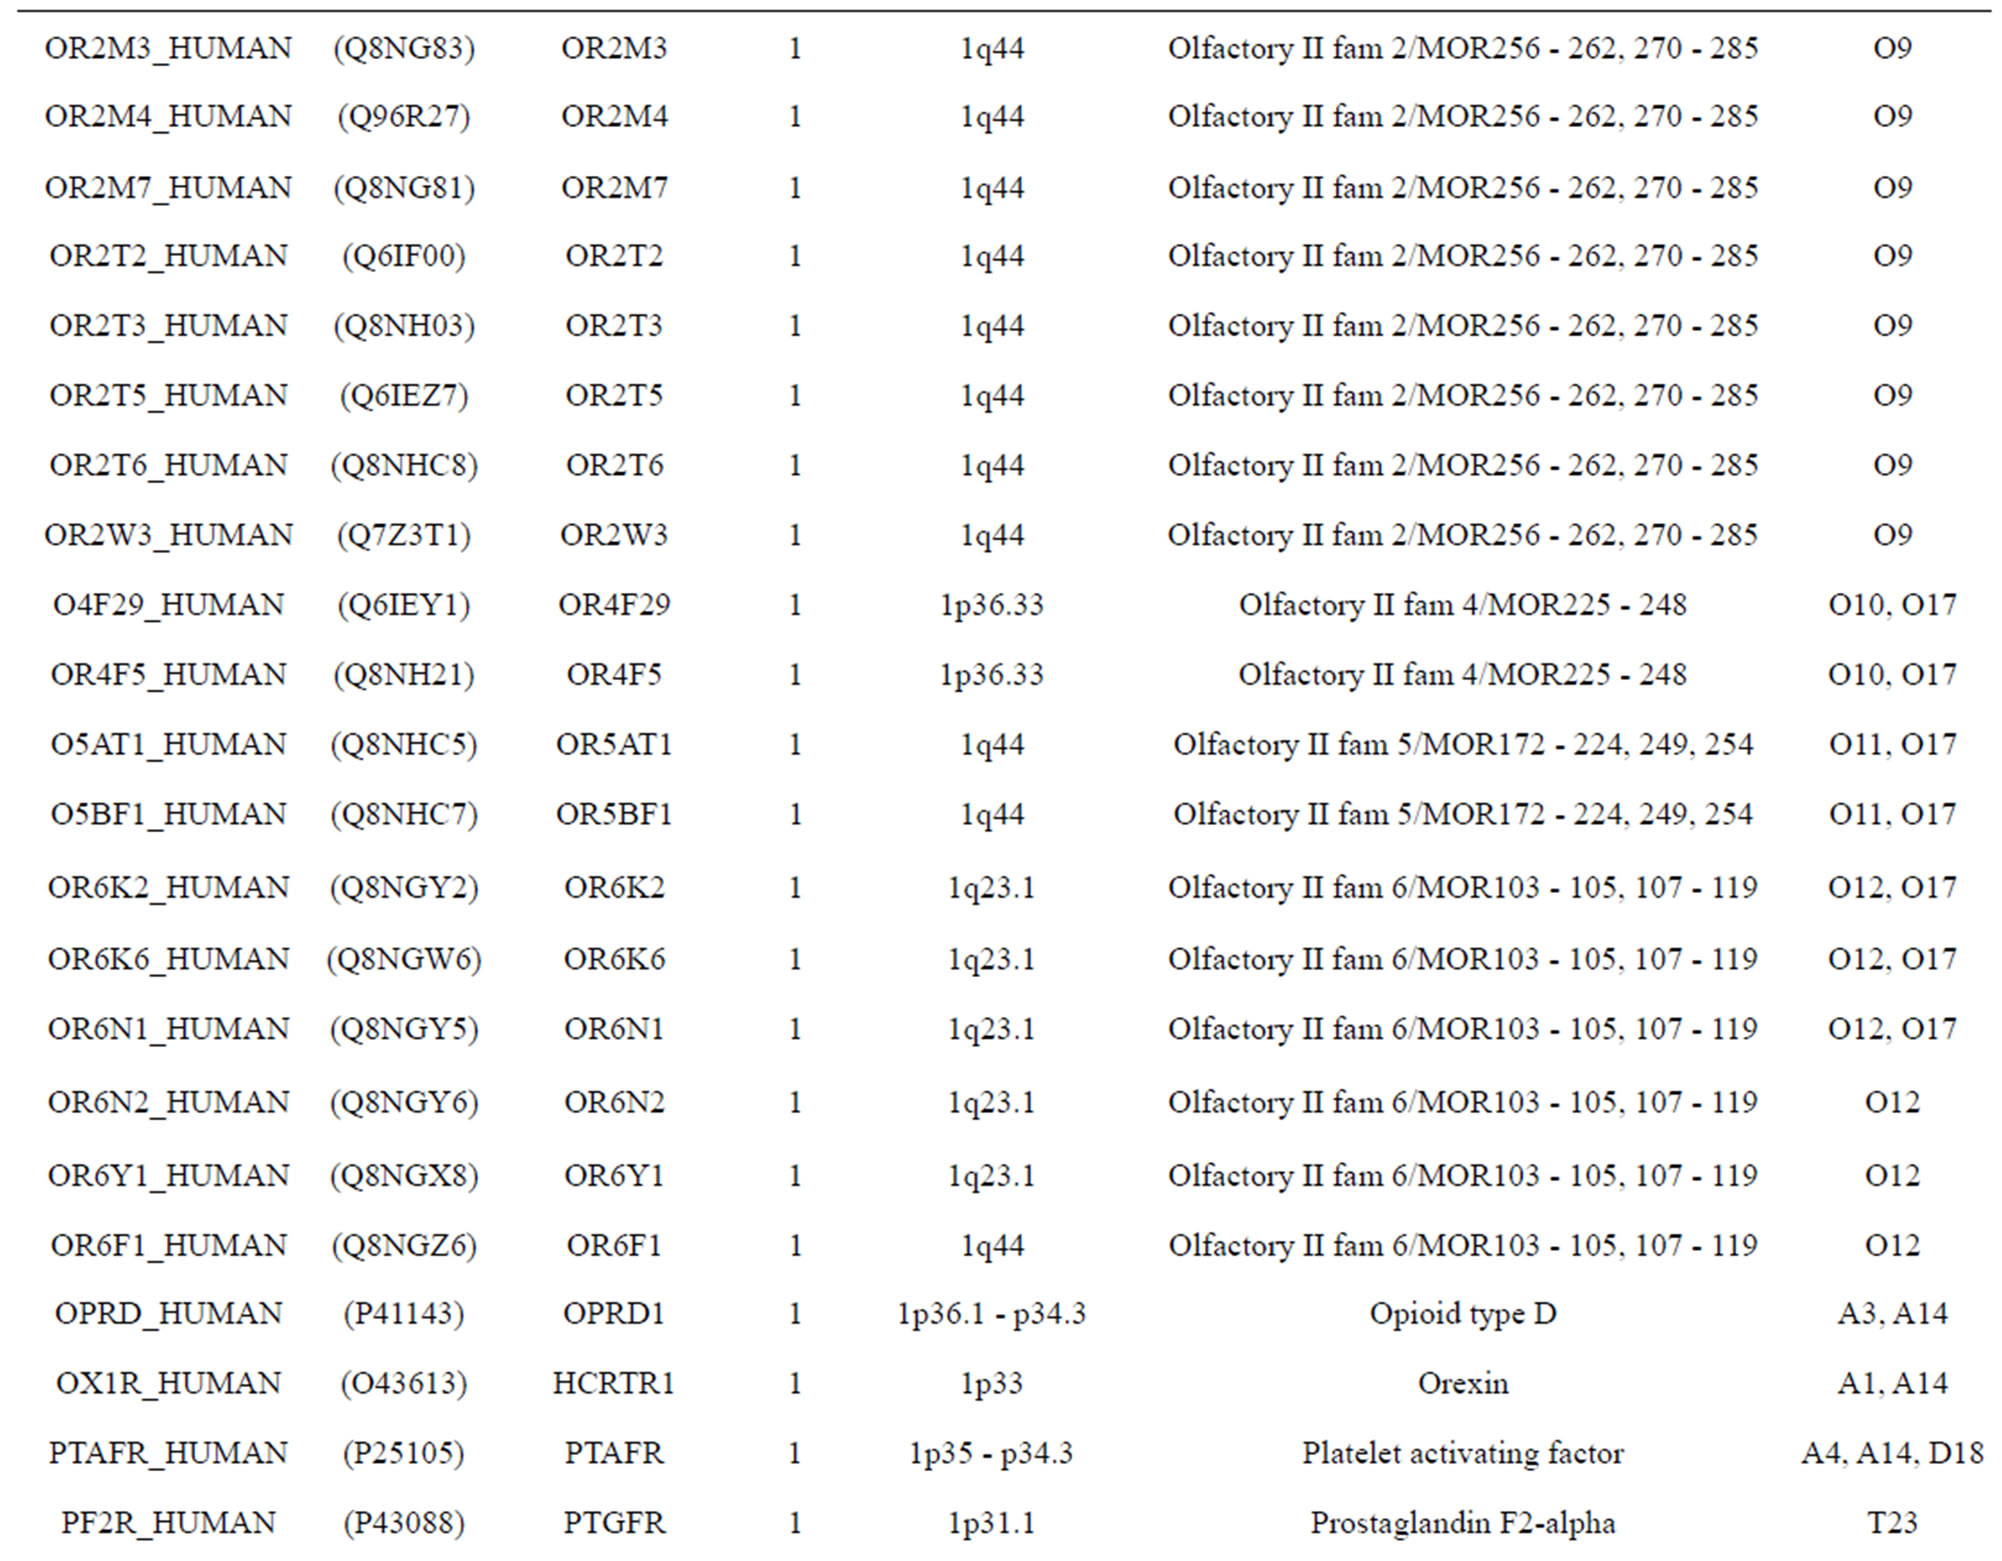
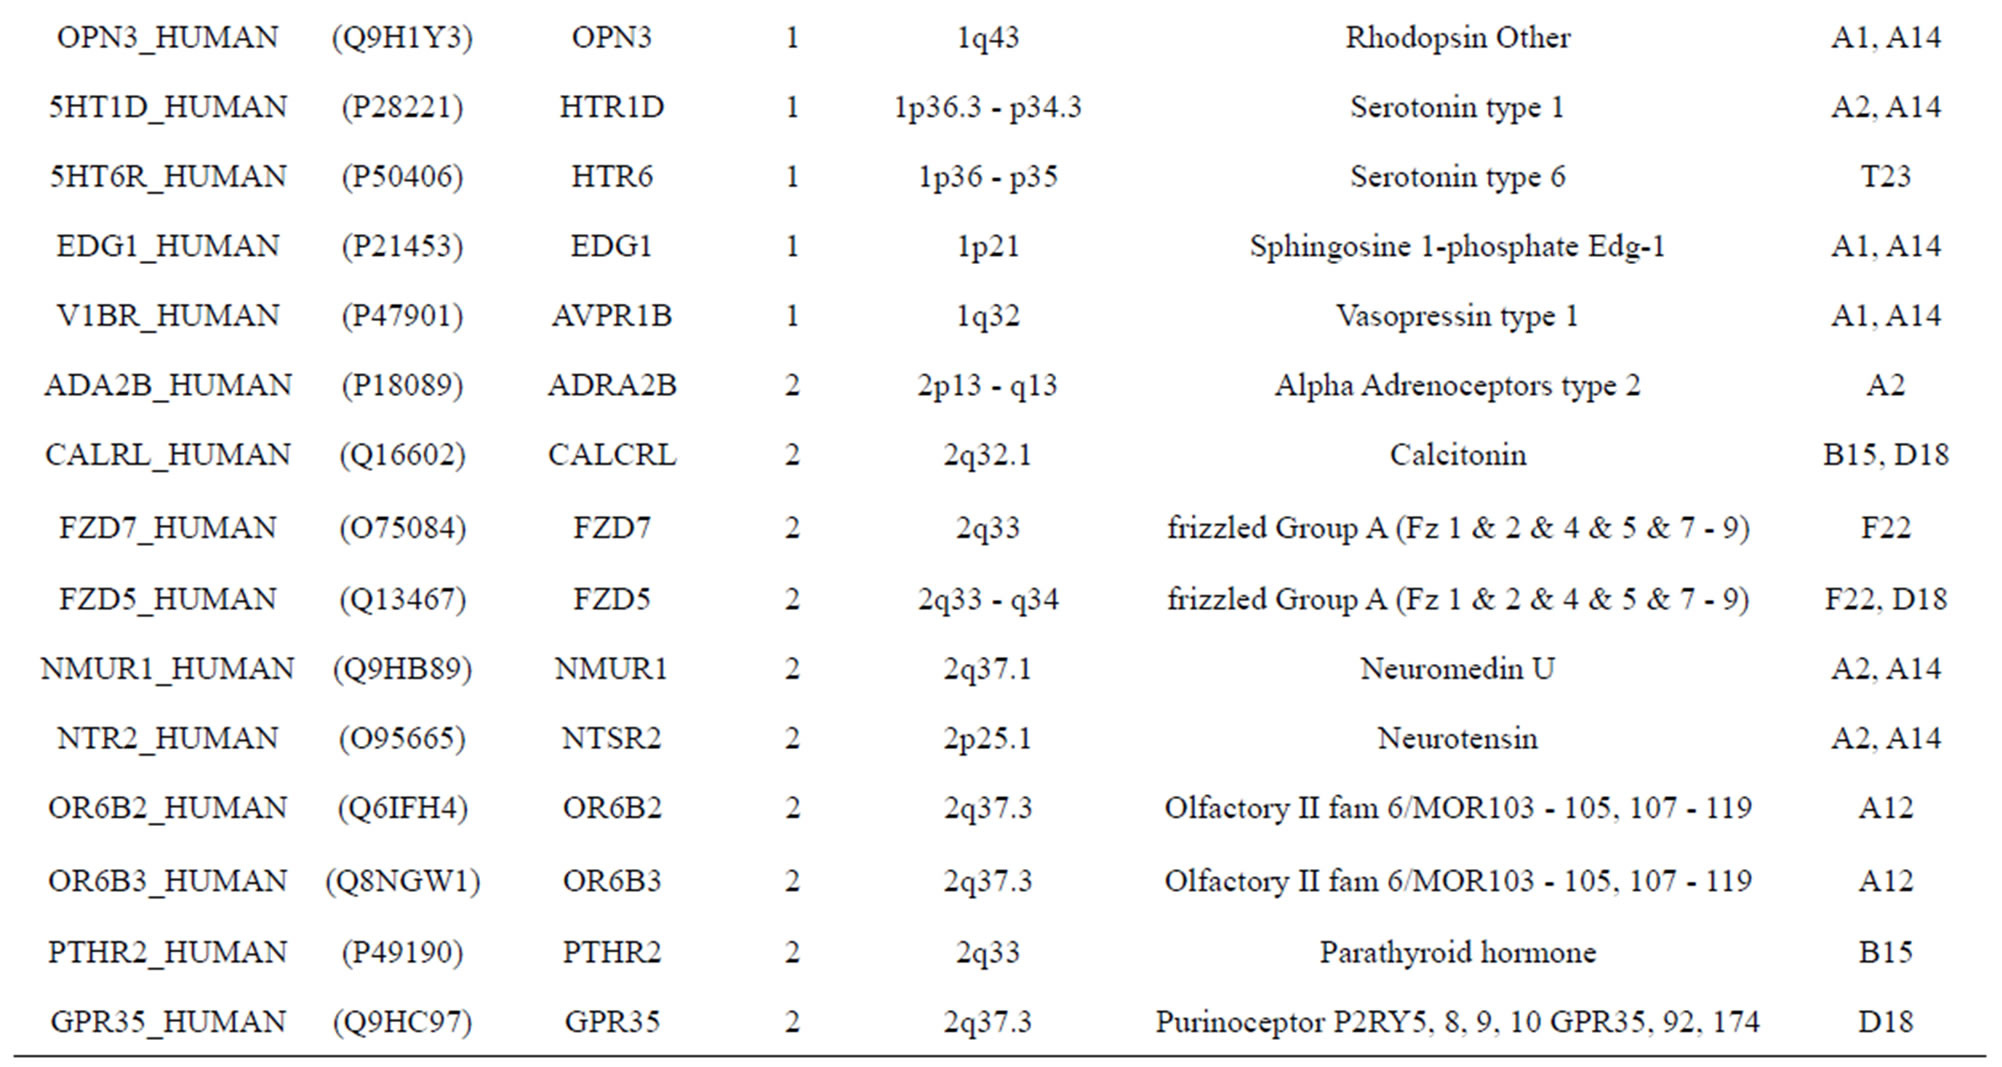
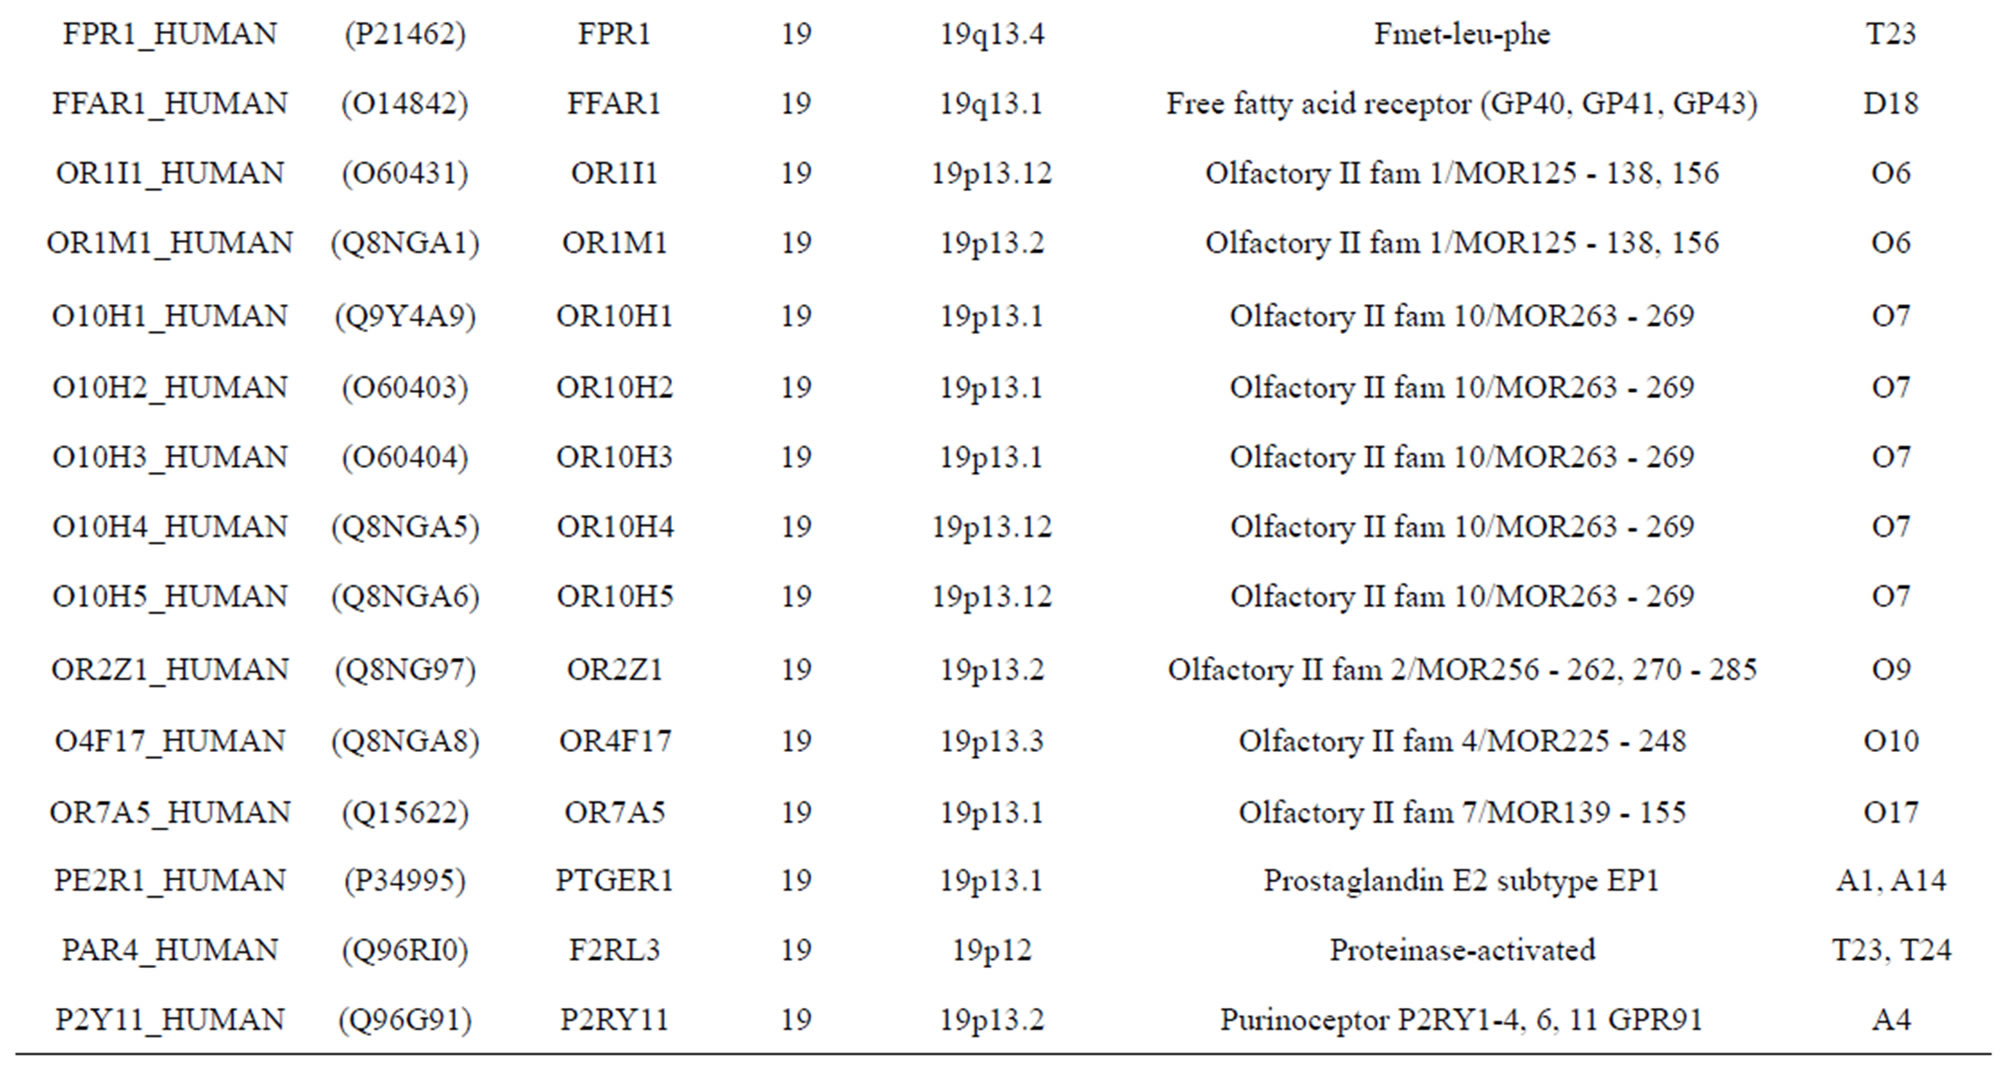
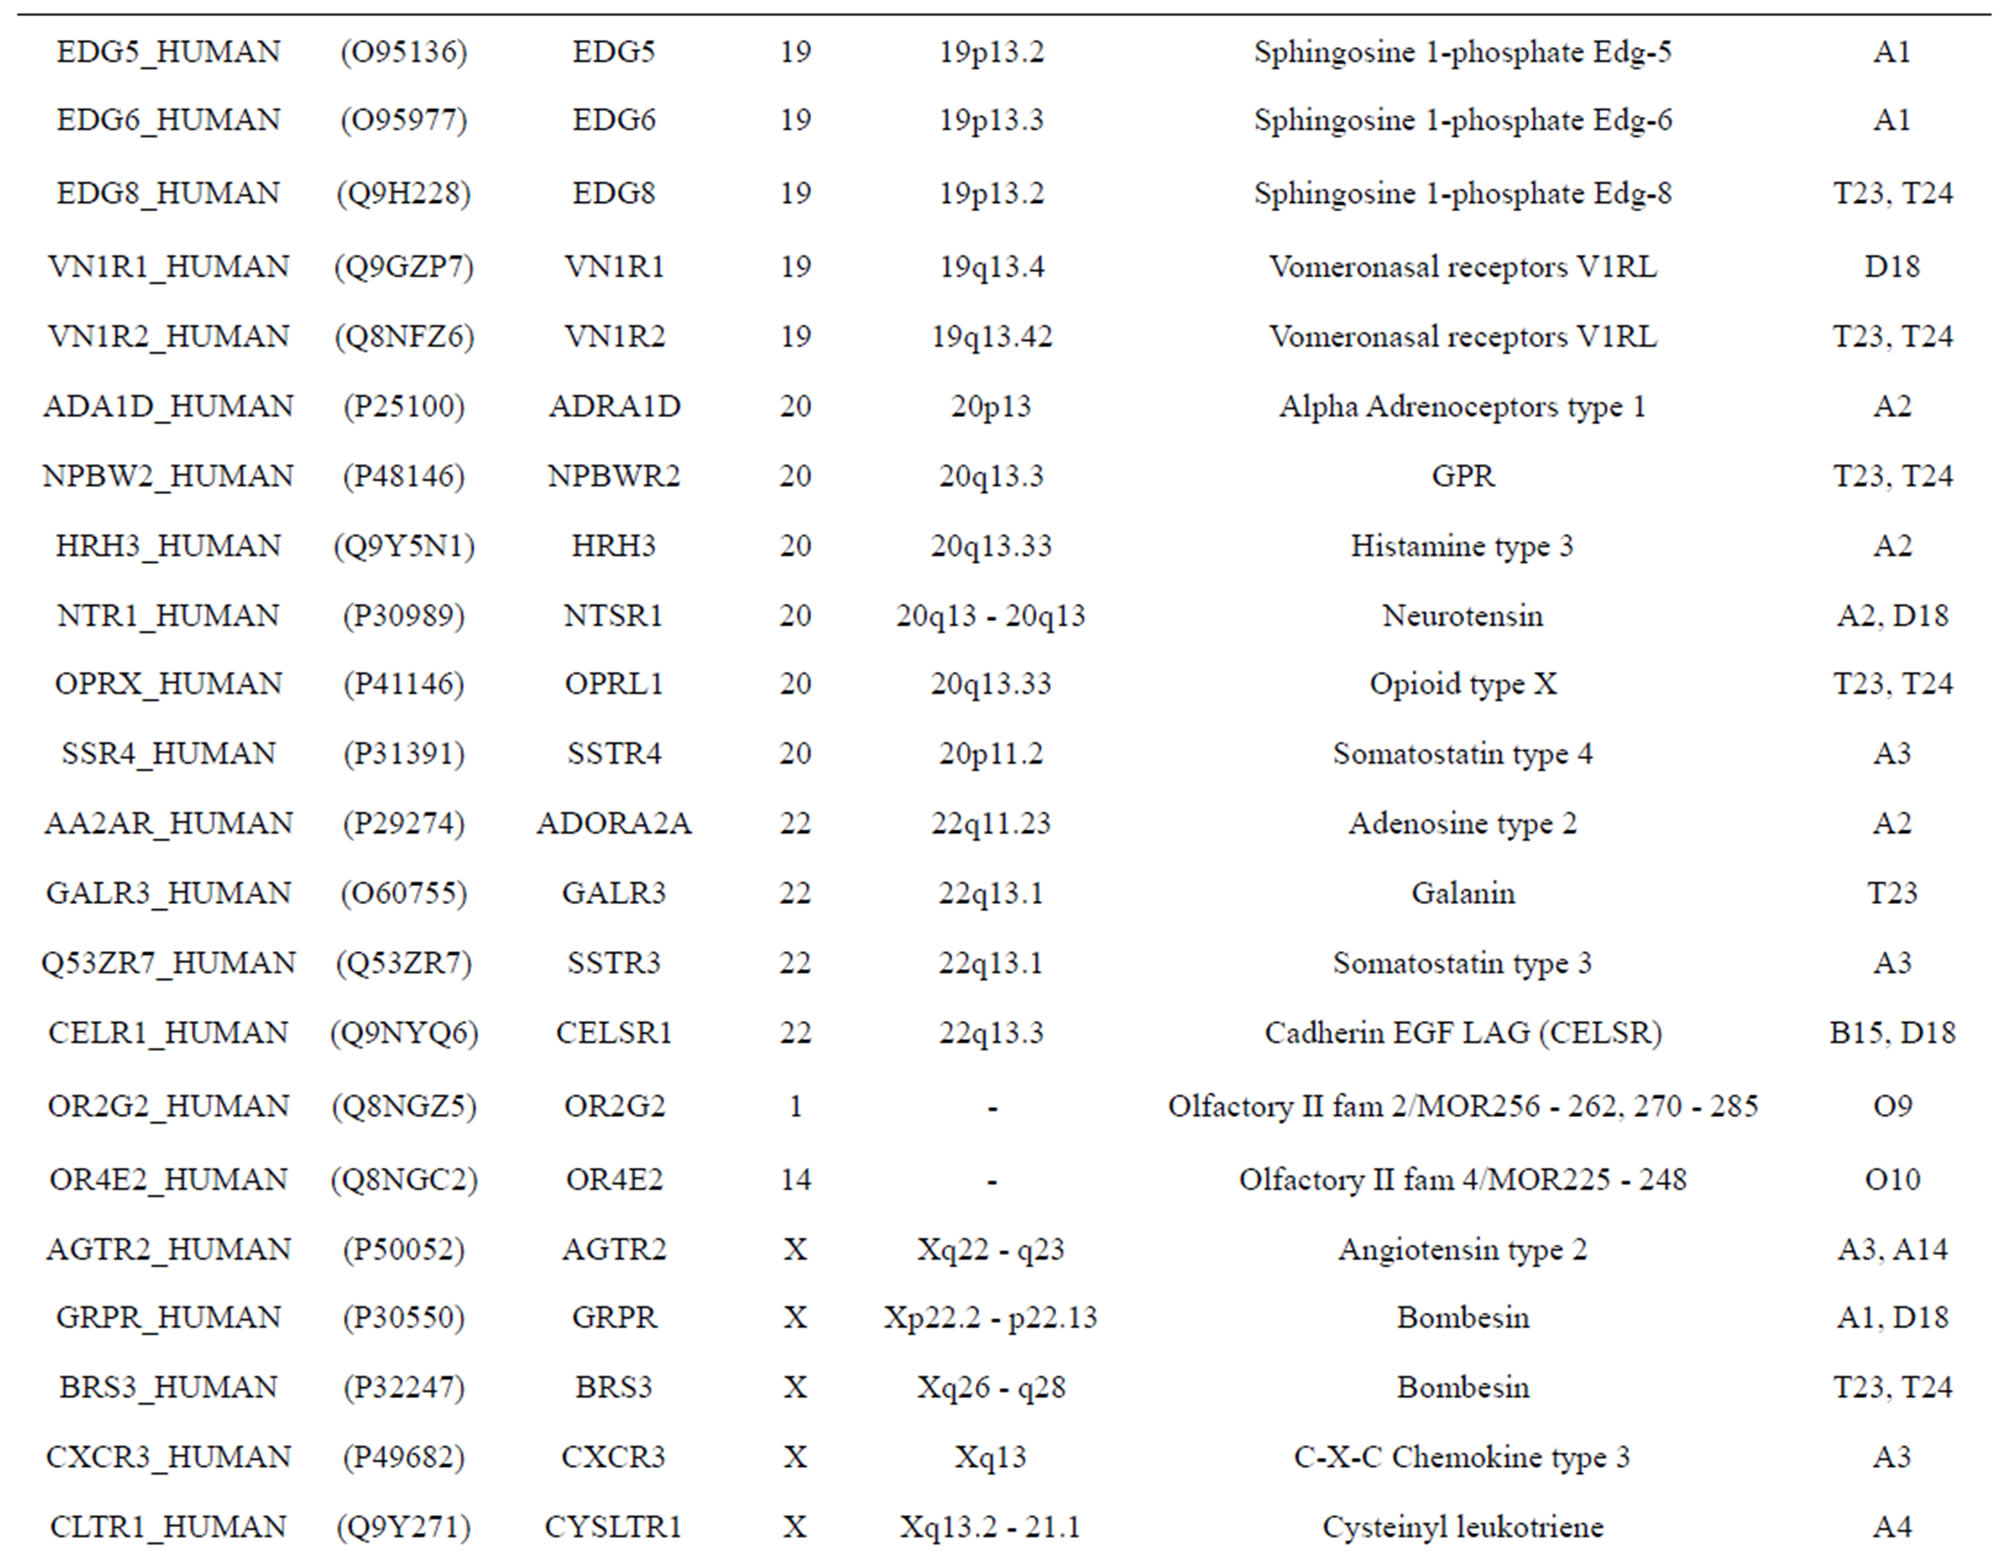
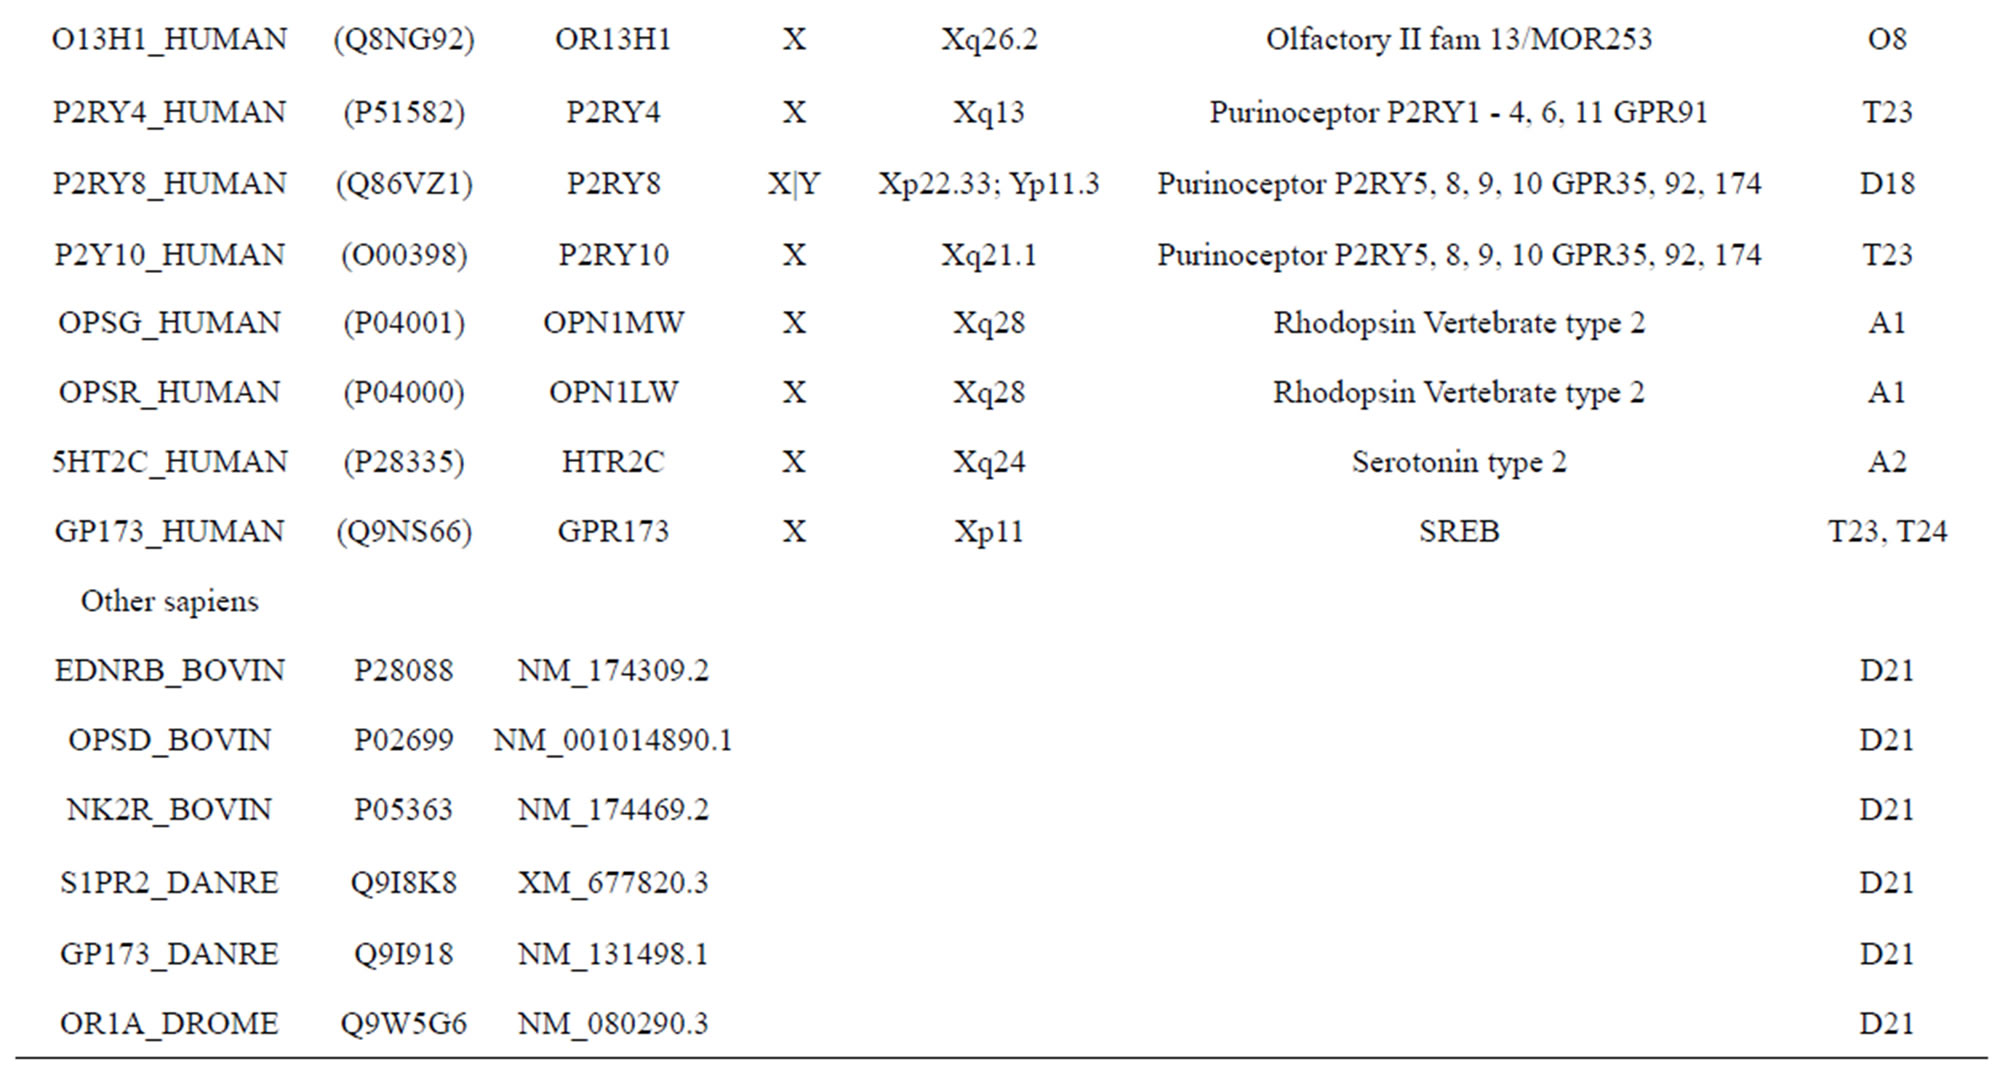
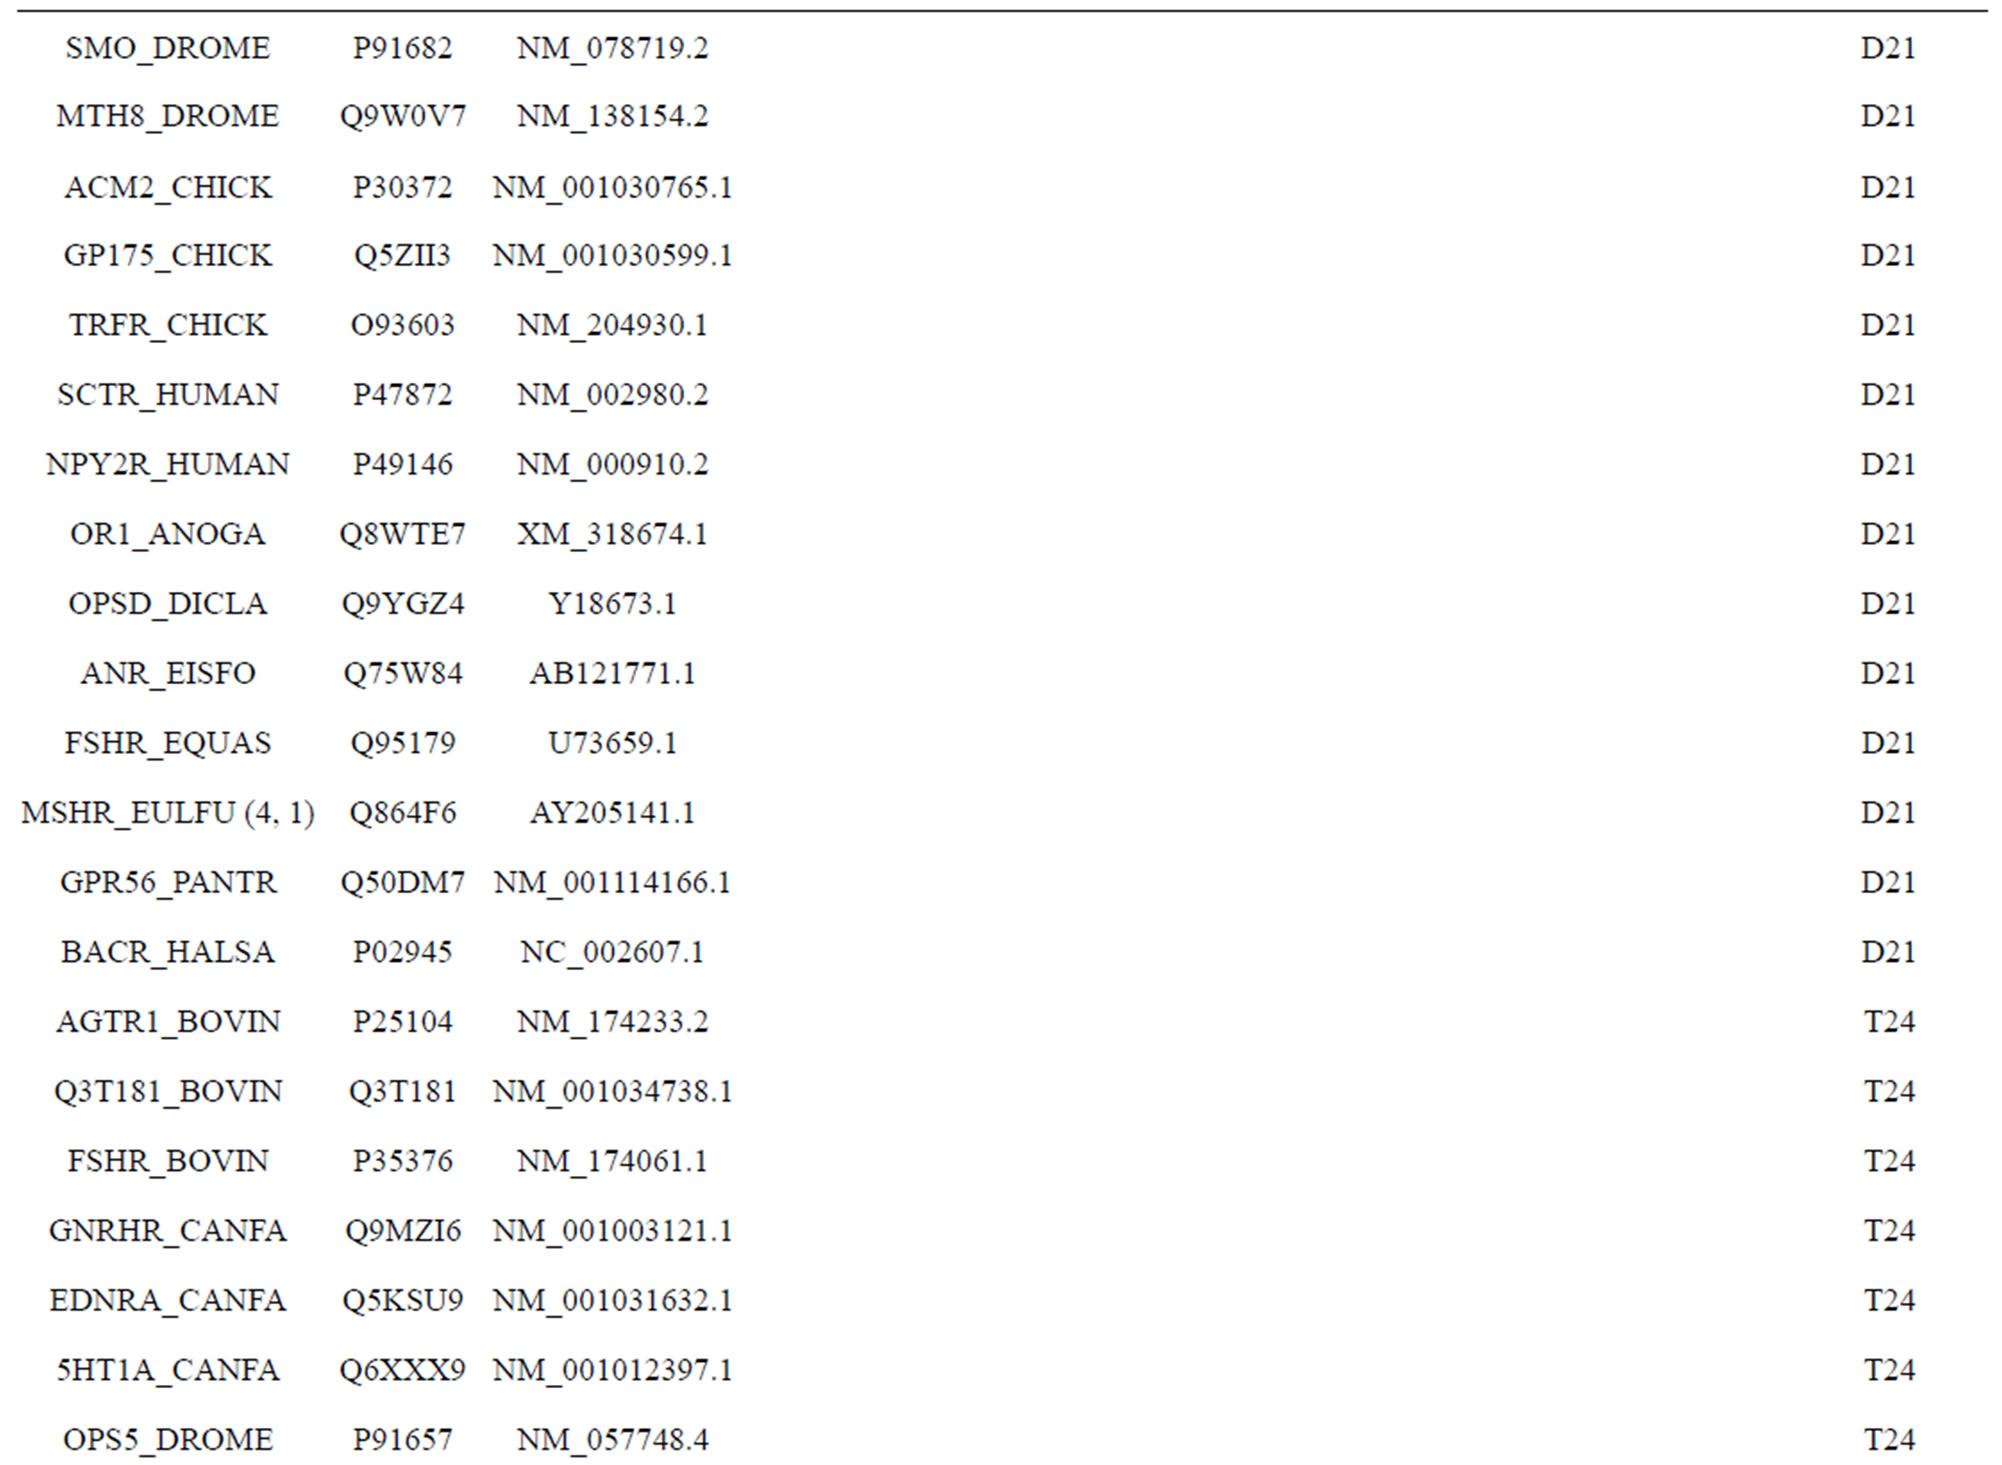
The transmembrane domain regions of 764 known GPCRs were each used as a query I TBLASTEN searches of the National Center for Biotechnology Information human genome database. Sequences were retrieved from the National Center for Biotechnology Information with the accession numbers (Appendix 1). GPCR Class A, B, and C Hidden Markov Model models were also used as queries to search the International Protein Index proteome database [8]. Grouping of the samples was based on the phylogenetic analysis results of Vassilatis and co-worker. Data sets were partitioned into three sets: Training, test, and validation sets. Although protein prediction methodology is almost always reported in terms of training and test sets only, we withheld an external validation set in order to provide an additional rigorous check on model quality. We feel this is necessary since a high statistical correlation on the training and test sets does not necessarily indicate a highly predictive model [41]. To properly partition our data sets so that they each reflect the makeup of the original data set as much as possible, we take into account the distribution of both feature diversity and biological activity as we form our training, test, and external validation sets. In this way, we maintain the original proportions of categorical bins and structural diversity in each of the three sets.
Training dataset is composed of 22 groups in three types of GPCRs (Figure 1) as follows: GPCRs from human different chromosomes ( ), from human same chromosomes (
 ) (such as chromosome 3 and 11), and from different species, based on the phylogenetic trees [8]. The first contains five classes: Class A (
 ), B (
 ), C (
 ), F/S (
 ), and other (
 ). Class A consists of four groups: Group 1 (
 ), Group 2 (
 ), Group 3 (
 ) and Group 4 (
 ), which is abstracted into Group 14 (
 ). Class B, C, and F/S each contain one group (
 ,
,  , and
, and ). The others fall into nine groups
 , which forms one group 17
 . The first is also extracted into one group 18
 . The second consists of
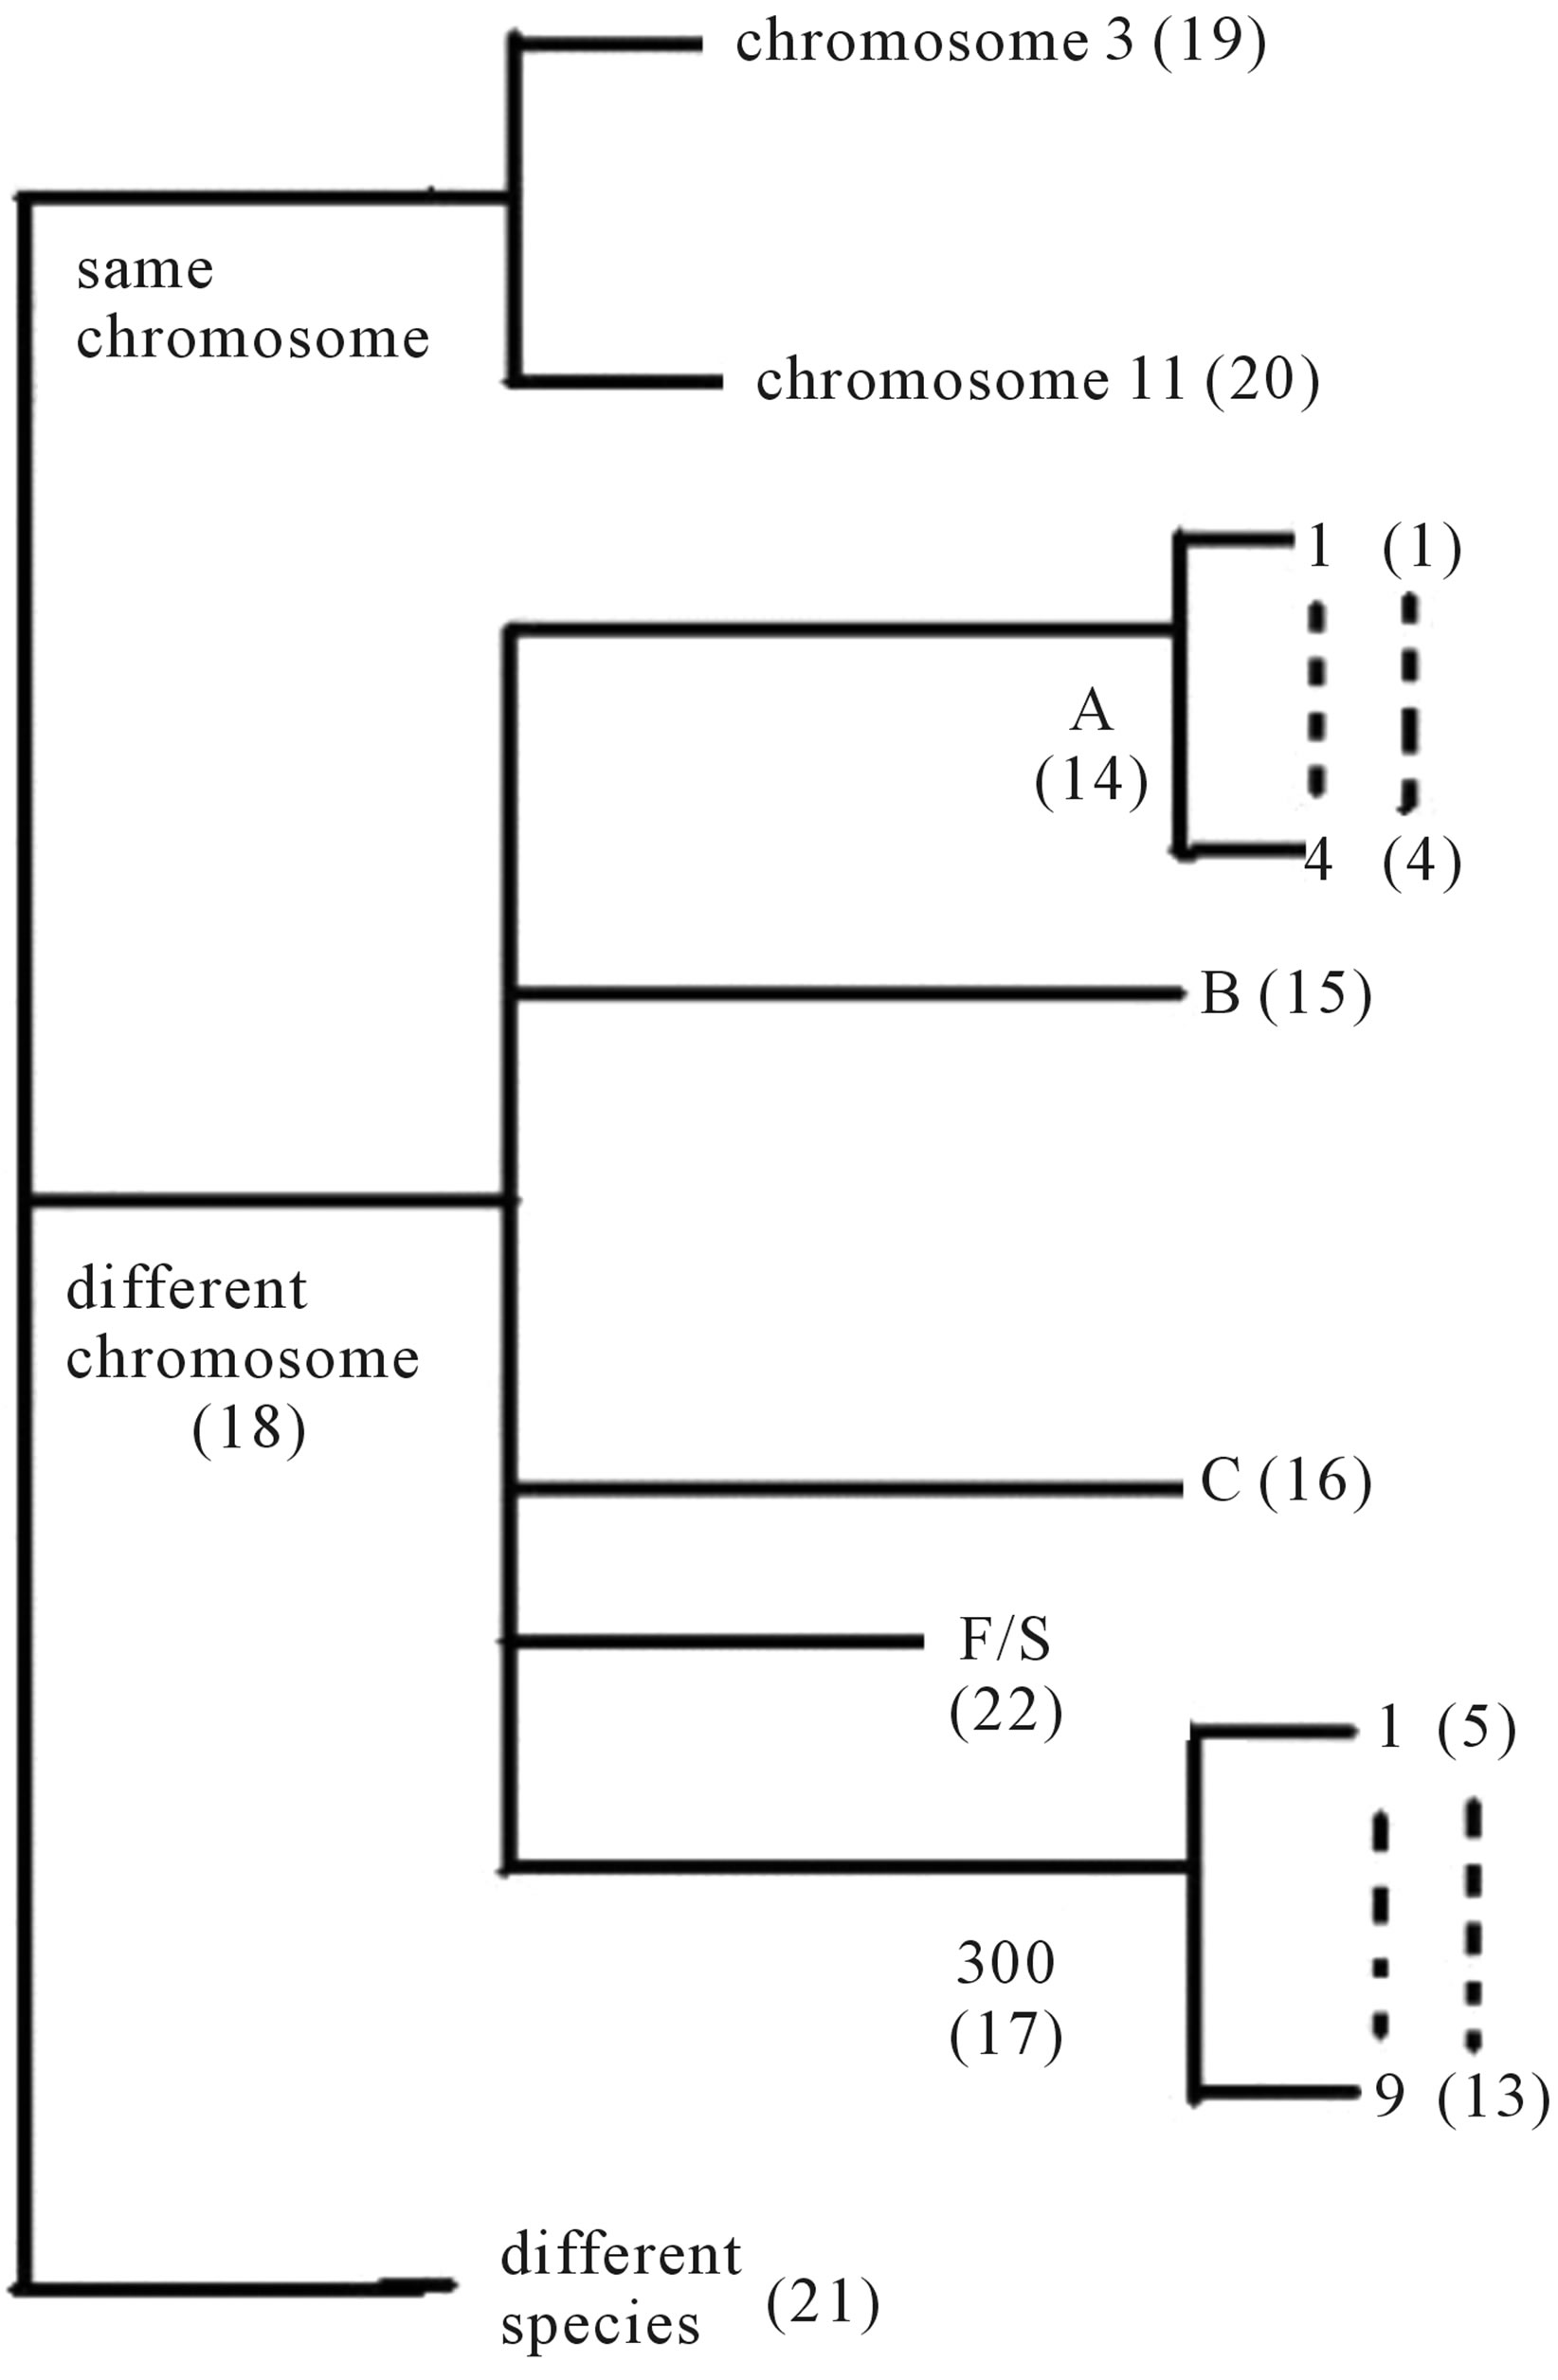
Figure 1. The grouping frame of the different training datasets.
two groups: chromosome 3 (group 19, ) and chromosome 11 (group 20,
 ). The third only includes one group 21 (
 ), consisting of Bovine, Danre, Drome, Chick, Anoga, Dicla, Eisfo, Equas, Eulfu, Pantr, Halsh, besides human, consisting of 3, 2, 3, 3, 1, 1, 1, 1, 1, 1, 1, and 2 GPCRs, respectively. All above 22 groups make up of the training dataset (learning dataset,
 ).
).
The following test datasets  contains two groups of GPCRs, group 23 from human (38 GPCRs,
 ) and group 24
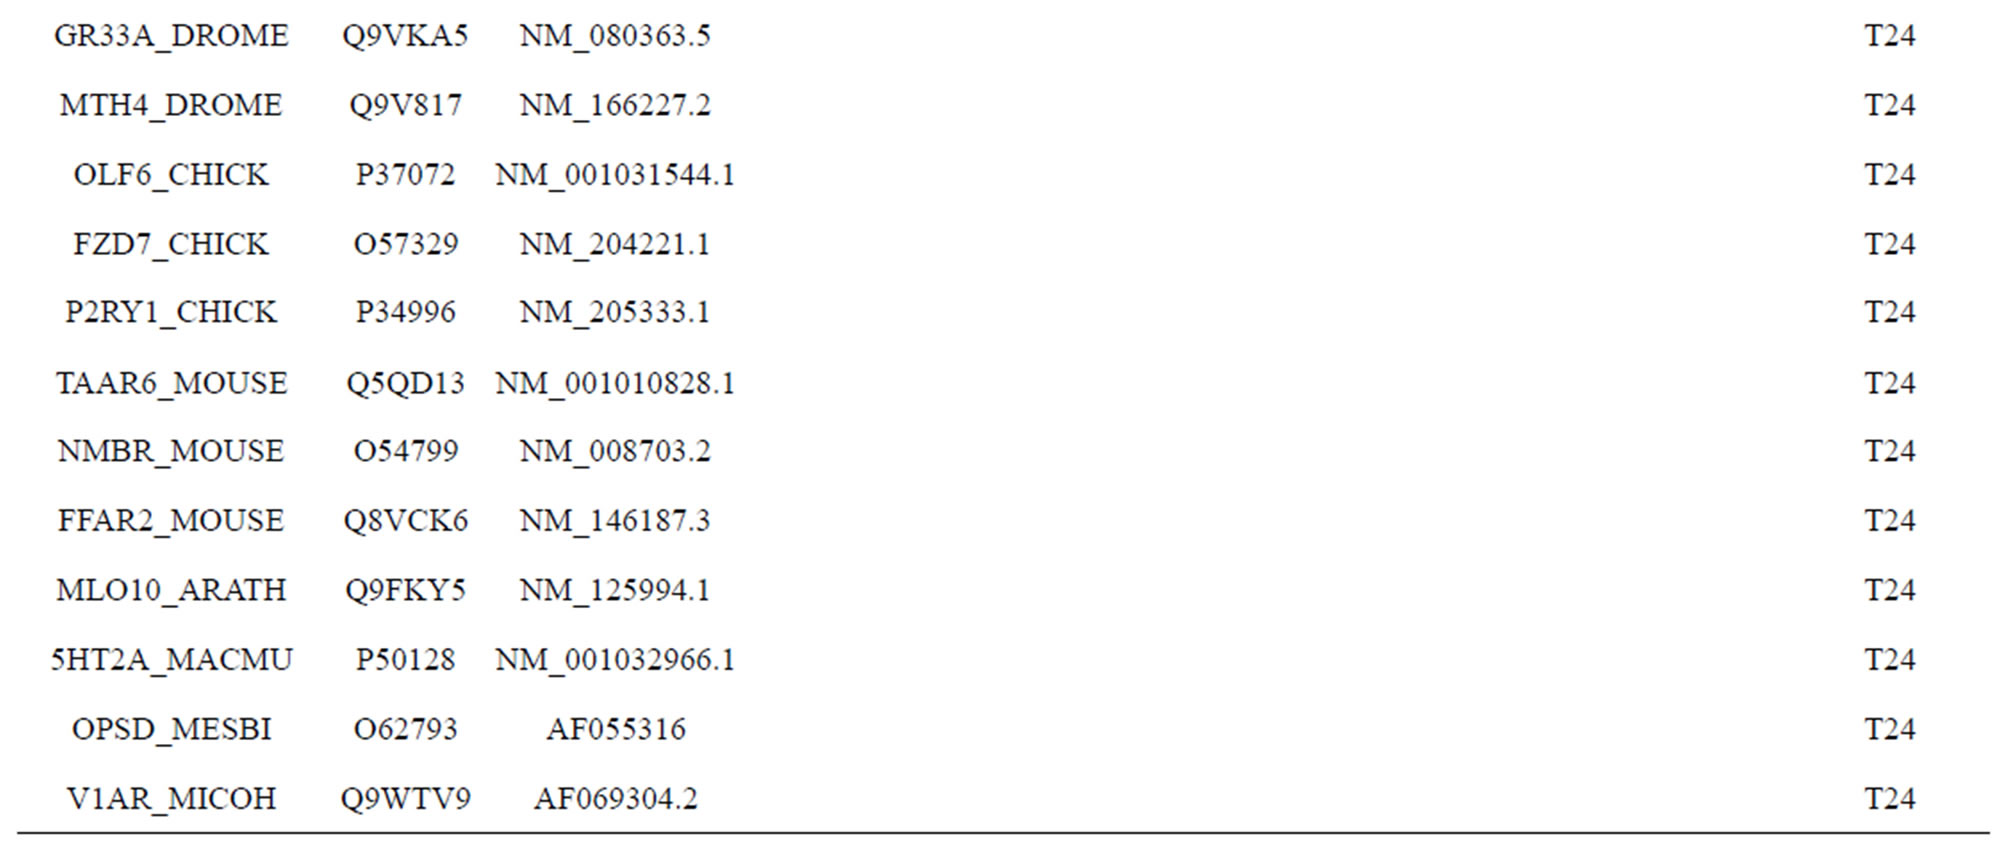
  from different species, consisting of 3 bovine, 3 canfa, 3 drome, 3 chick, 3 mouse, 1 Arath, 1 macmu, 1 Mesbi, and 1 Micoh GPCRs, respectively, besides 19 human GPCRs (Appendix 1). Here,
 ,
,
 ,
,
 ,
,  ,
,
 ,
,  ,
,
 and
and
 .
.
The validation set involves 22 GPCRs from the sense chain of chromosome 19.
2.2. Sequence Analysis of GPCRs using Bioinformatics
2.2.1. The Scoring Matrices of Training Sets
Take Group 1 of Class A for an example. In order to represent the GPCRs’ TM patterns, a representative nonredundant set of high resolution GPCRs’ TMs are chosen as previously reported to build a training set (Tables 1 and 2). The most consistent sequences are picked up to constitute a scoring matrix by alignment that would be used to predict the TM regions. The amino acid sequences of the seven TMs of GPCRs were extracted and aligned using ClustalW; the TM regions cluster in one fragment (motif) which are about 12, 11, 13, 14, 10, 10, and 12 amino acid residues for TM1-TM7 of the Group 1 (Table 2), respectively; and then their coding regions of such amino acid fragments were chosen to constitute the scoring matrix, which contains 4 types of nucleotides (Figure 2).
Take TM1 of GPCRs in Group 1 of Class A for an example. There are 42 GPCR proteins consisting of the training set after alignment (Table 1). Figure 2 means the scoring matrix, which was generated by assigning a value of the stimulatory potential to each of the 4 defined nucleotides in each position of Table 1. Based on the matrix, we designed a simple algorithm to evaluate the relationship significance of any sequence to the GPCRs’ TM patterns. To each nucleotide  (A, T, G, and C) from those 42 proteins
  of TM1 of group 1 (Table 2), the symbol
  stands for how many times it takes place in each position
 , which was calculated as follows:
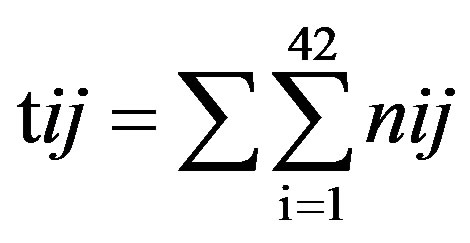 . The score
  of this nucleotide denotes the proportional (weighting) it takes place in each position
 , which was calculated as follows:
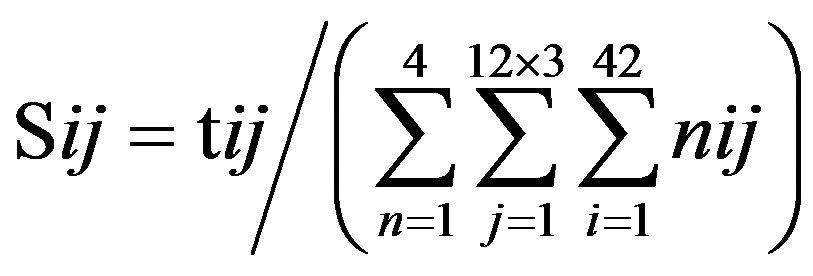 . Take the adenosine
(A) for example. Based on the Table 1, the times of adenosine is  at the position of
  respecttively, and the sum of four nucleotides in the training set is 1512
 . So, the scores
  of adenosine is
  at the position of
  respectively, whereas it is 0 at other position because it does not appear (Figure 2). The rest (Thymine, Cytidine, and Guanosine) may be deduced by analogy. The value of the scoring matrix is 1.
2.2.2. Test Sets
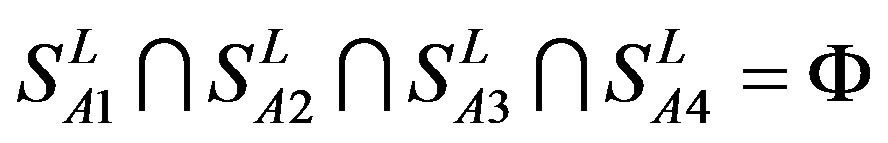
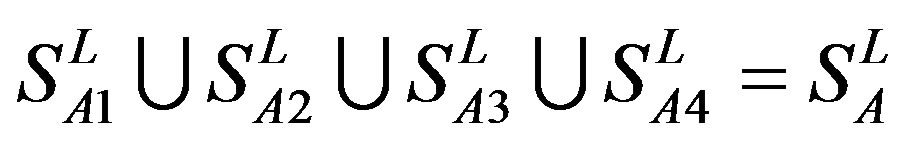
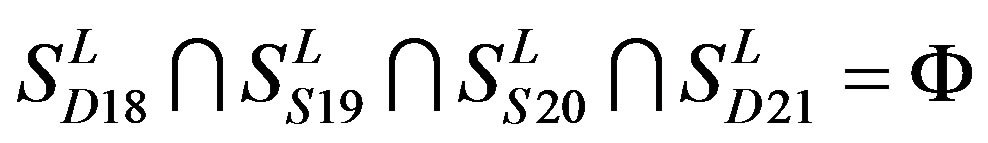
According to the set theory of mathematics [42], the GPCRs chosen above consist of different training sets ,
,  ,
,  ,
,  ,
,  , etc, which composed a union
 , and
, and .
.
Therefore, the test set  (Table 3) comes from the complement of
  for GPCRs aggregate (Appendix 1).
According to our previous methods [40,43], we defined the coding sequence (CDS) of GPCRs’ each TM as TM-CDS unit composed of  nucleotides. At first, the TM-CDS units are obtained using the sliding window method one by one from 5’-terminal of GPCRs’ CDS to 3’-teminal: A sequence of
  nucleotides gives rise to
  TM-CDS units. For example, the coding sequences of TM1 of GPCRs in group 1 are 12 × 3 nucleotides, namely
 .
.
2.2.3. Validation Set
Similarly, we calculate the total scores of the coding sequences of 22 GPCRs located at the sense chain of chromosome 19 using the sliding window method.
2.2.4. Assessment of Model Quality
In this study, training model quality is simply the percent correct classification (binning) of GPCRs’ TM segments for the test set [41]. The overall predictive power of a given model is the percent correct classification for the test set (%test) and for the external validation set (%validation), where the external validation set represents native holdout data. More extensive model assessment was accomplished by a “dynamic partitioning” procedure, which provides a no error rate of the test and external validation sets.
2.2.5. Statistics
Data are expressed as mean±standard deviation (S.D.) through this paper. Statistical analyses were performed with F-test by one-way analysis of variance (abbreviated one-way ANOVA) and by t-test between the means of two groups of the samples. Data was considered significant for  at 95 confidence limit [44]. Tests for normality were performed with Shapiro-Wilk test because of the number of samples less than 2000 [45]. The normality of the data was tested by the Shapiro-Wilk statistic. All statistical testing was conducted at significance level 0.10 and all confidence intervals had confidence level 0.90 unless otherwise noted. All tests and confidence intervals were two-sided. Confidence intervals for normal data were constructed from analysis of covariance models [45]. Here, α = 0.10 requests 90% confidence limits. The default value is 0.05. One wayANOVA, Test of Homogeneity of Variances and Multiple comparisons (LSD and Tamhane’s T2), and tests for normality were performed using SPSS version 11.5 software.
2.2.6. The Prediction Model Algorithm
In general, our prediction model (PreMod) method employs the scoring matrices combined with descriptor
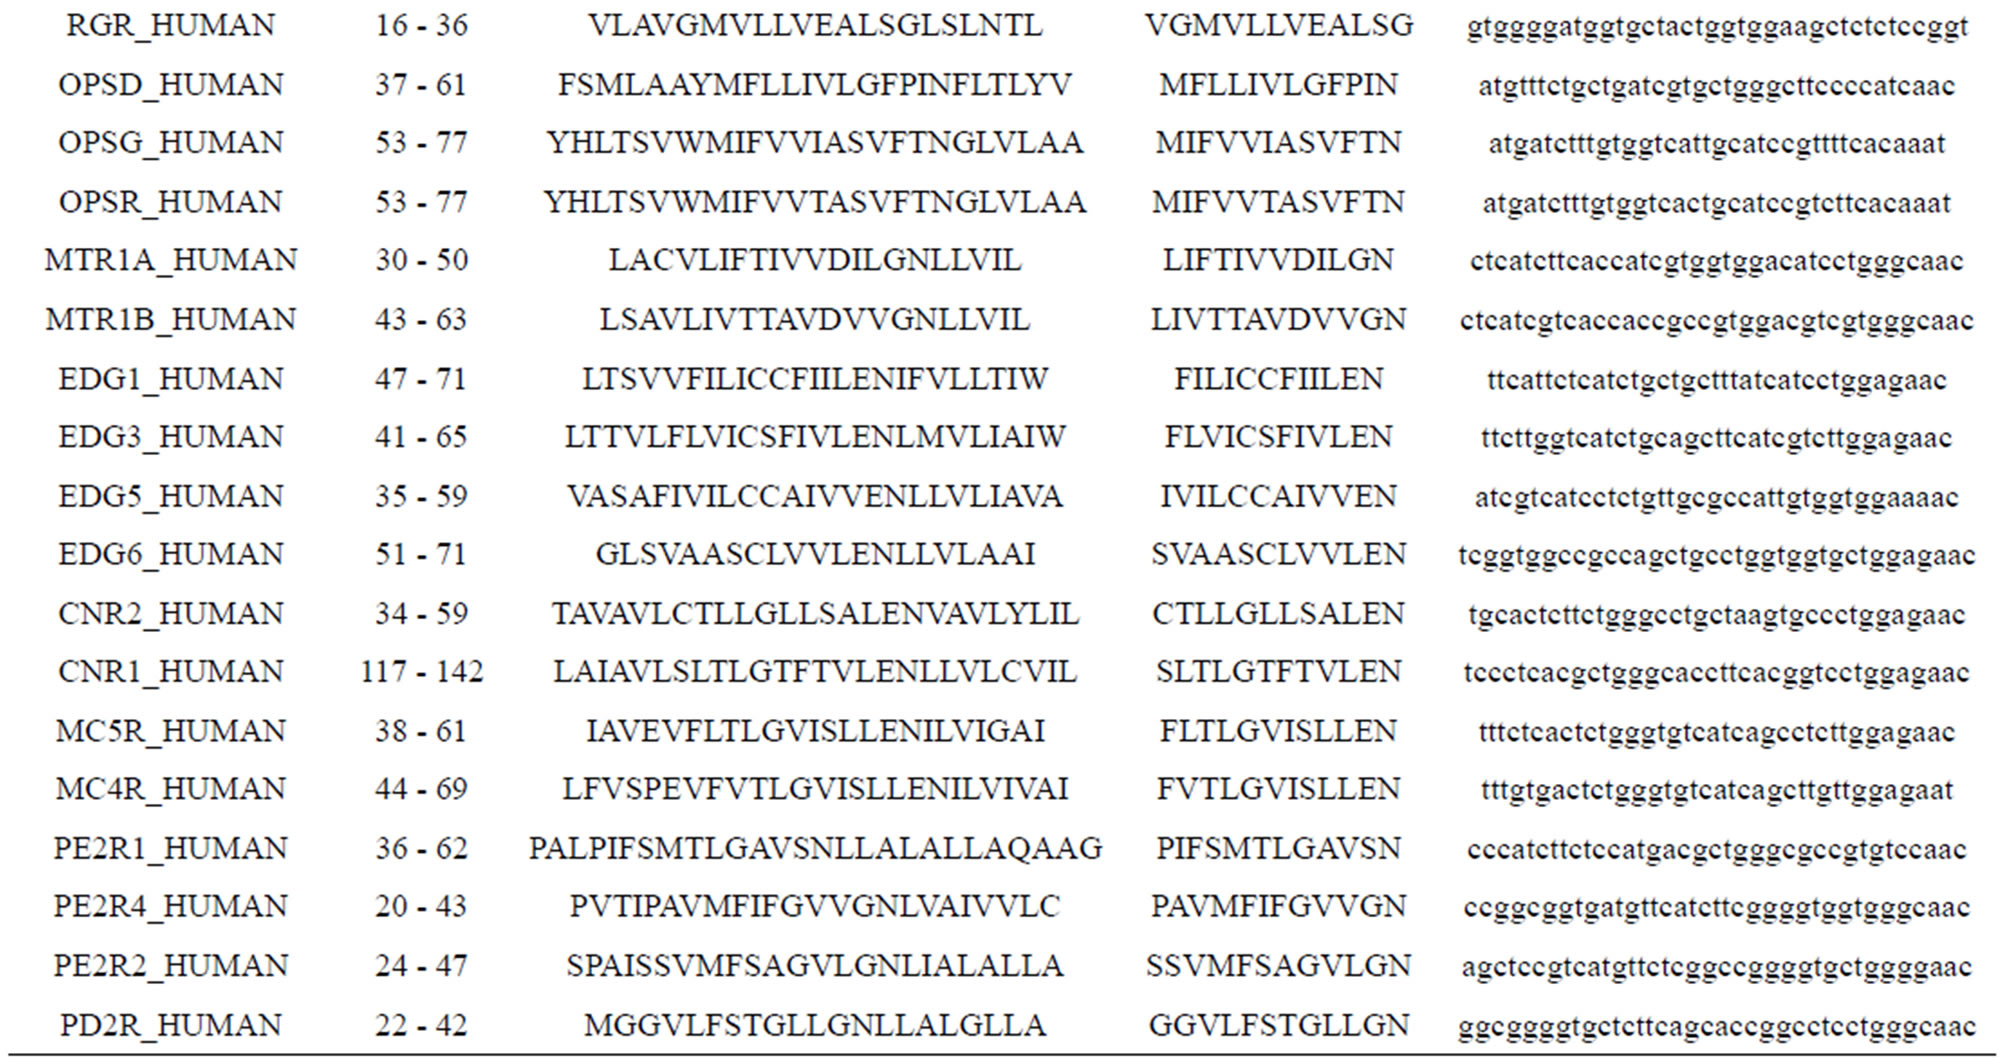
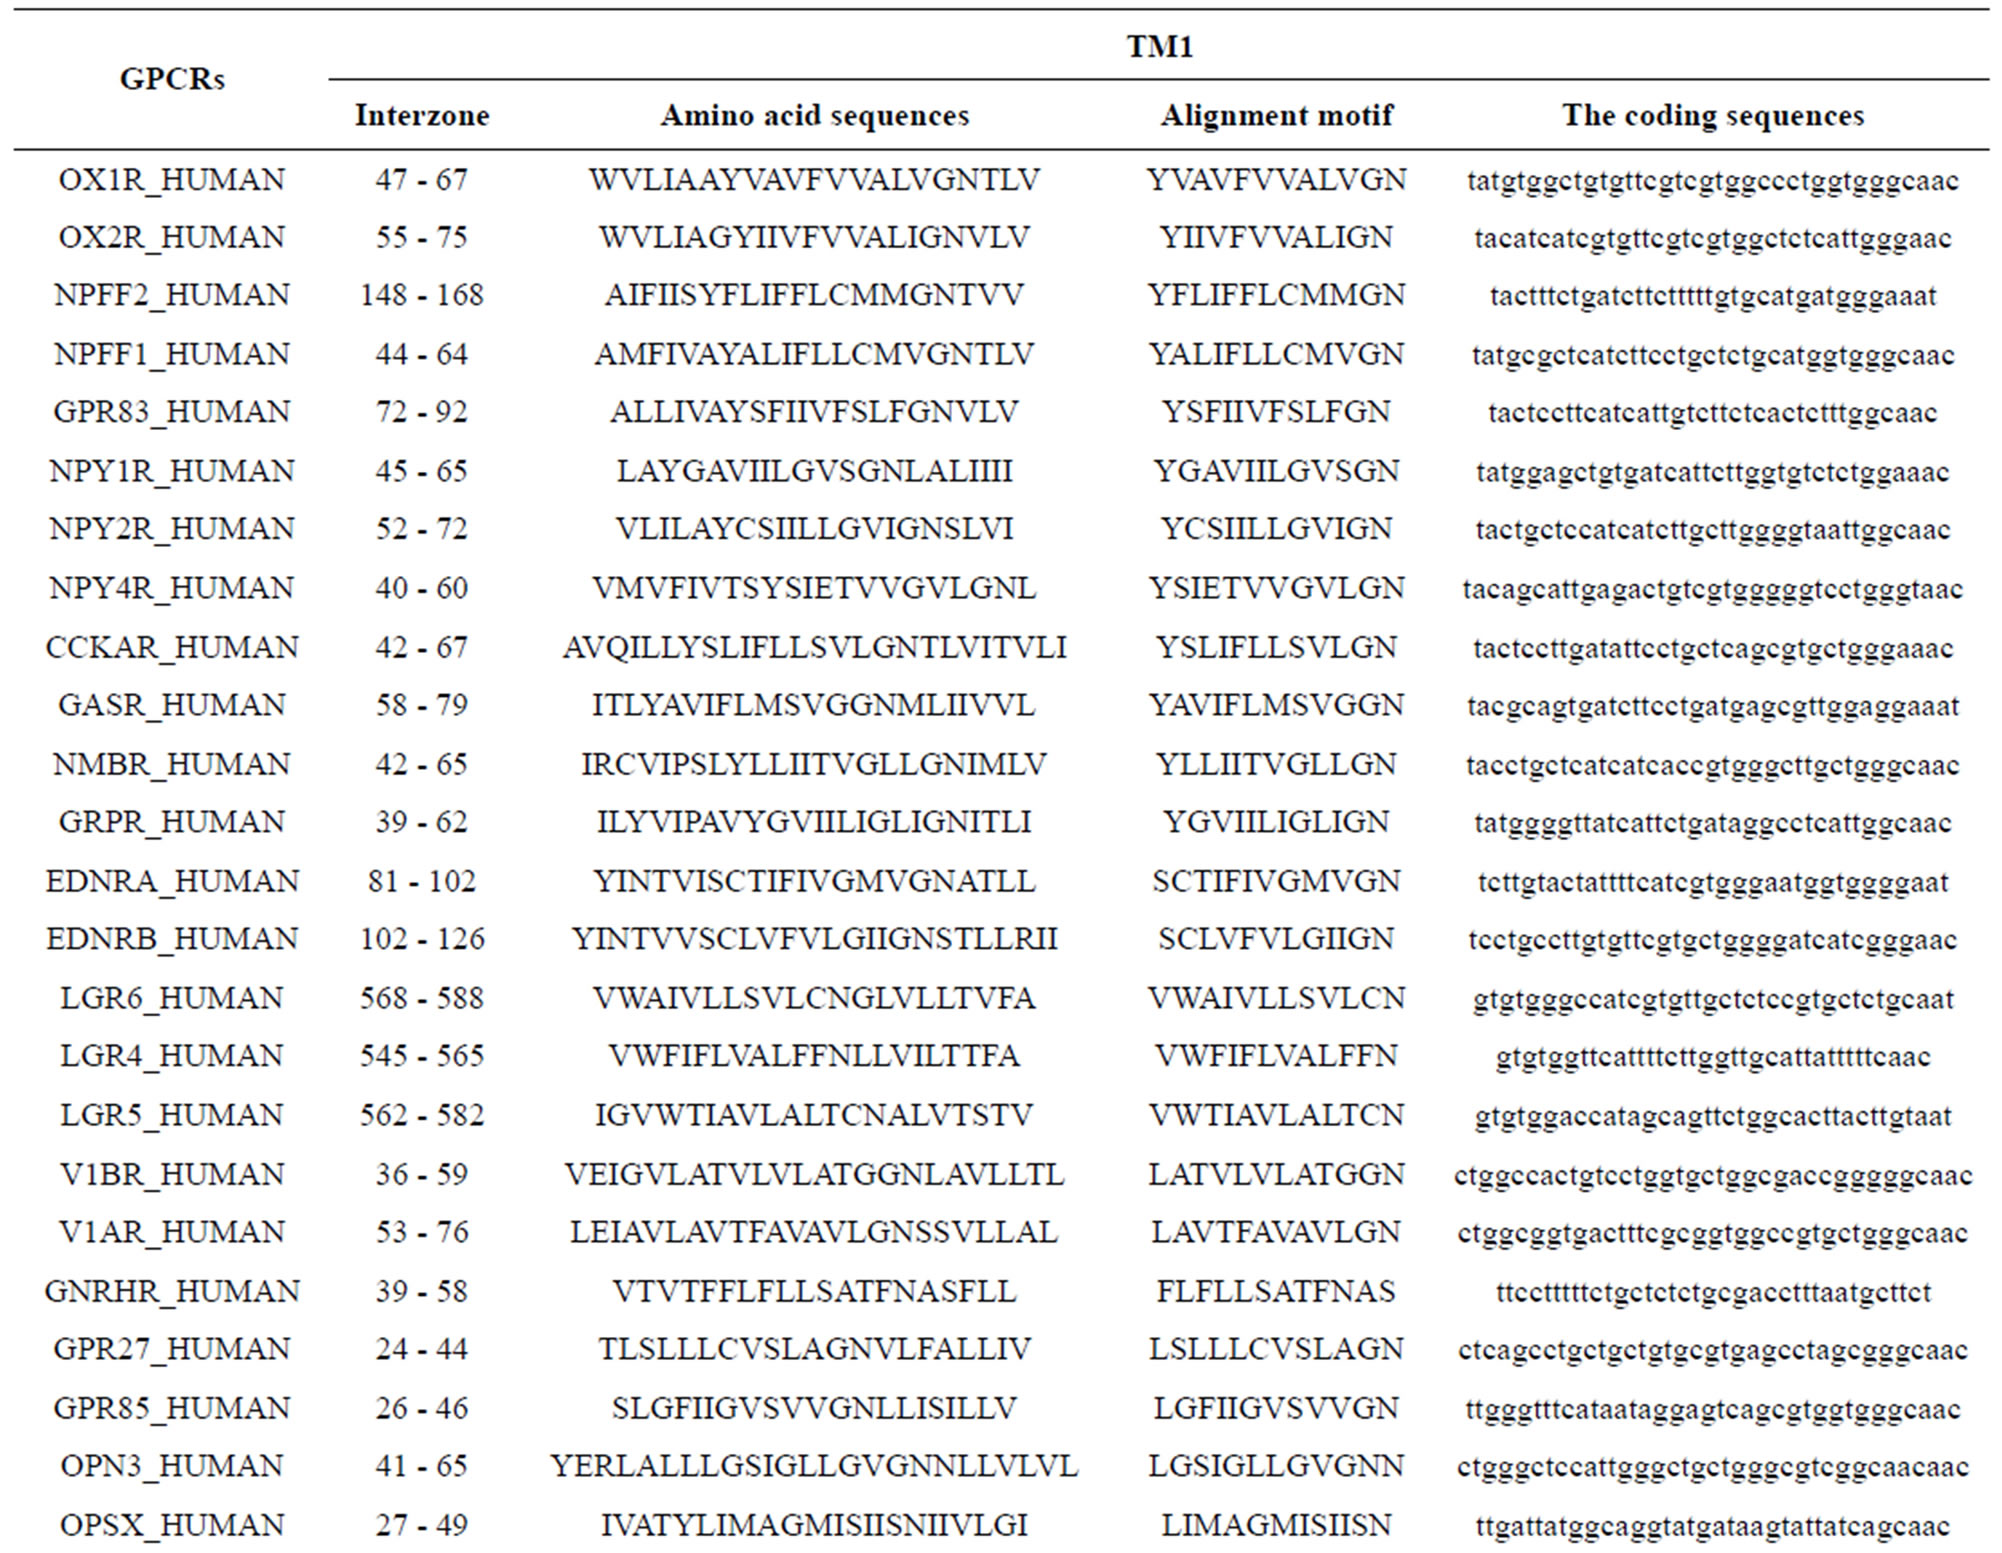
Table 1. TM1 sequence alignment of GPCRs in group 1 of class A by clustal W.
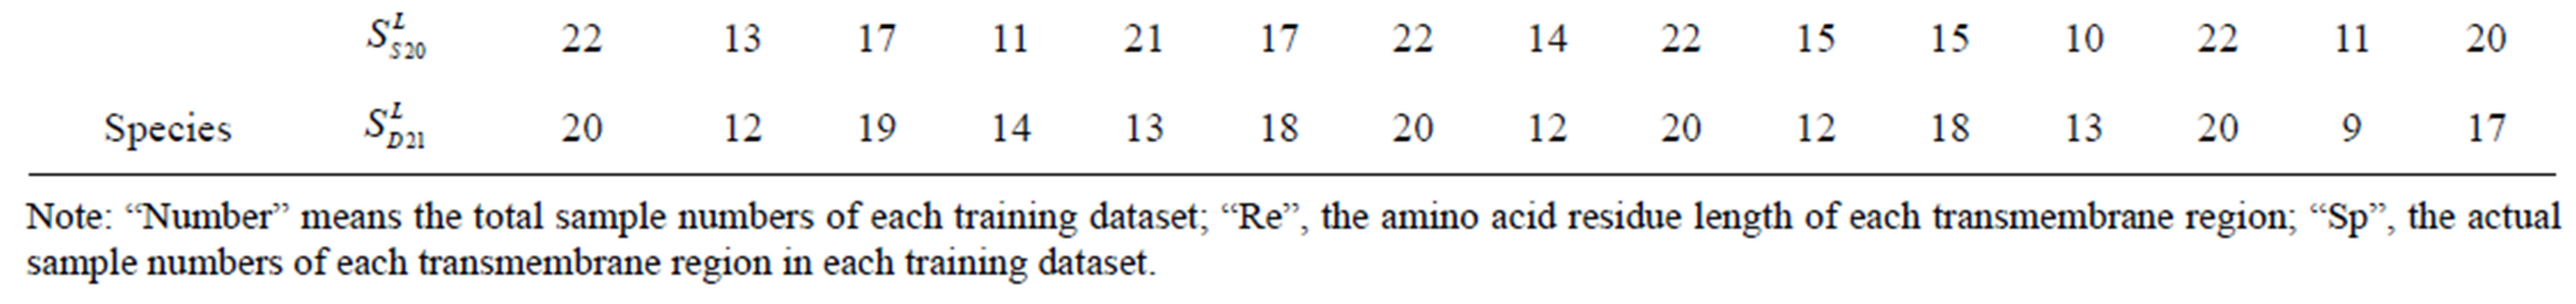
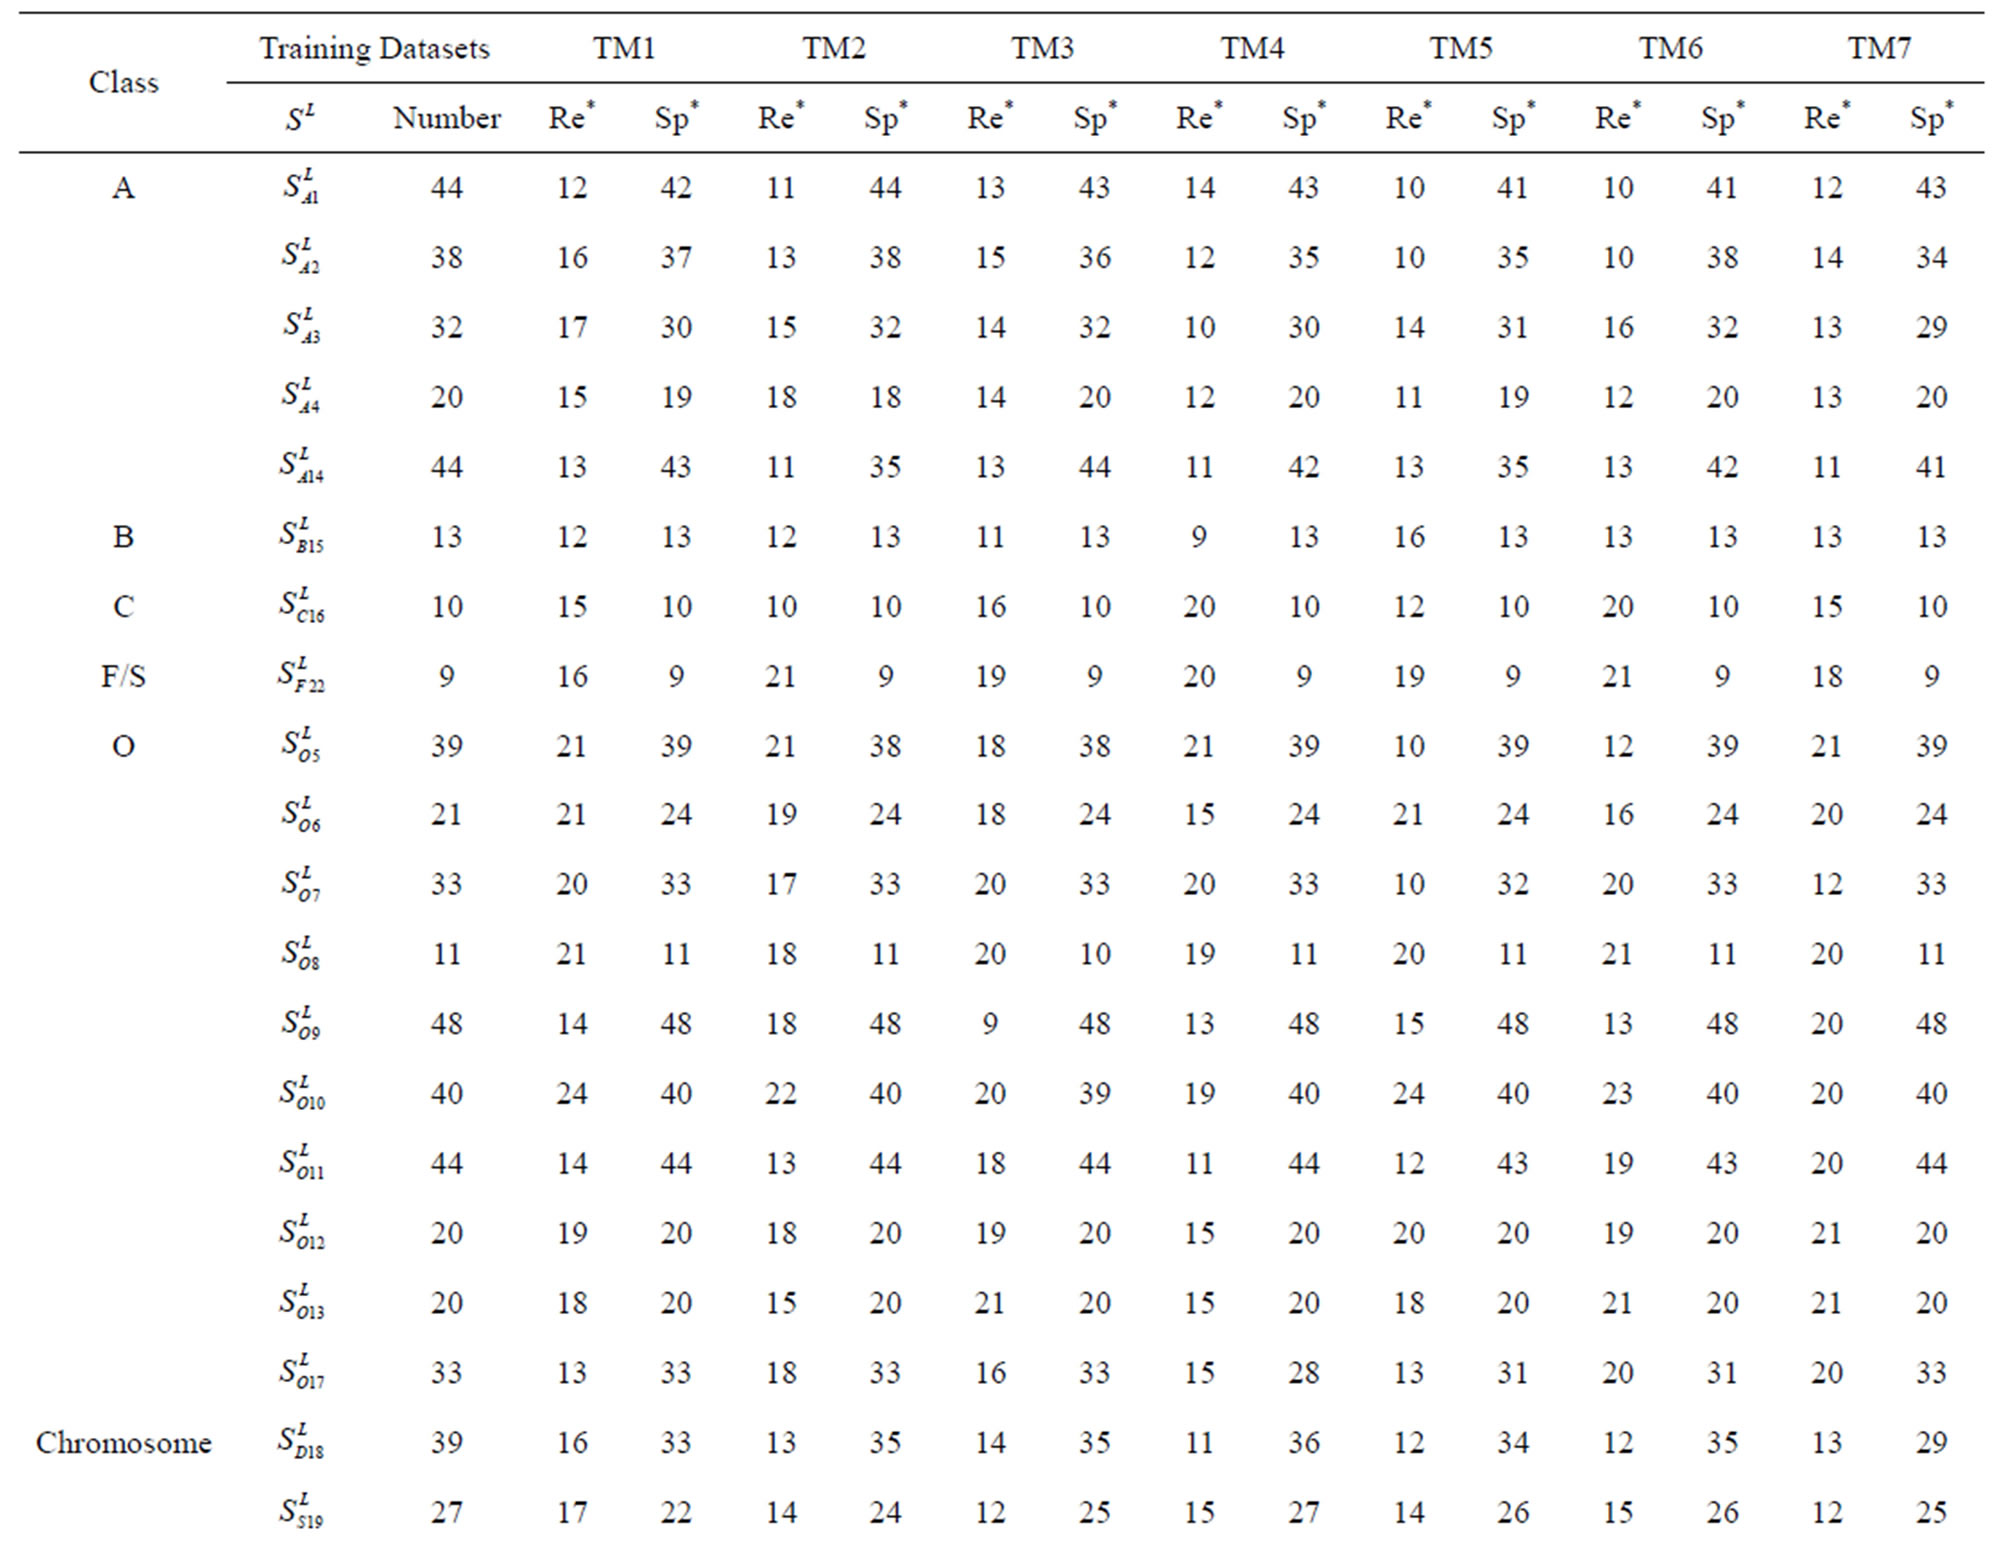
Table 2. The amino acid sequence length and the sample number of the scoring matrix in the training datasets after sequence alignments.
selection procedures (seven TMs) that seek to find the optimal subset of the scoring matrices from the original scoring matrix manifold. Partitioning data sets into training, test, and external validation sets rigorously assesses model quality. We extend this methodology by implementation of the dynamic repeating assessment. A flowchart of the prediction model algorithm is provided in Figure 3, which involves the following steps. 1) Divide each data set into two parts: One used to build models, the other to validate models (external validation set); in our implementation, the external validation set is selected to have a high level of diversity; 2) Further partition the 80% identified for model building to form two more sets: Training (80%) and test (20%) sets; 3) Select seven TMs of GPCRs as descriptors based on phylogenetic evolution of the training set with or without crossvalidation procedure (described above); 4) Calculate the score  of the training set to construct an optimized subset of the scoring matrix based on the CDS of GPCRs’ 7 TMs; 5) Predict the test set target values using the scoring matrix and calculate the percent correct classification of the test set (%test); 6) Merge the training and test sets, and build a new prediction model using statistic analyses; 7) Predict external validation set values using the prediction model (PreMod), and calculate the percent correct classification of the external validation set (%validation); 8) Repeat steps 1-8 a preset number of times (22 times); 9) Assess each model by the accuracy described above, and generate test and external validation veracity.
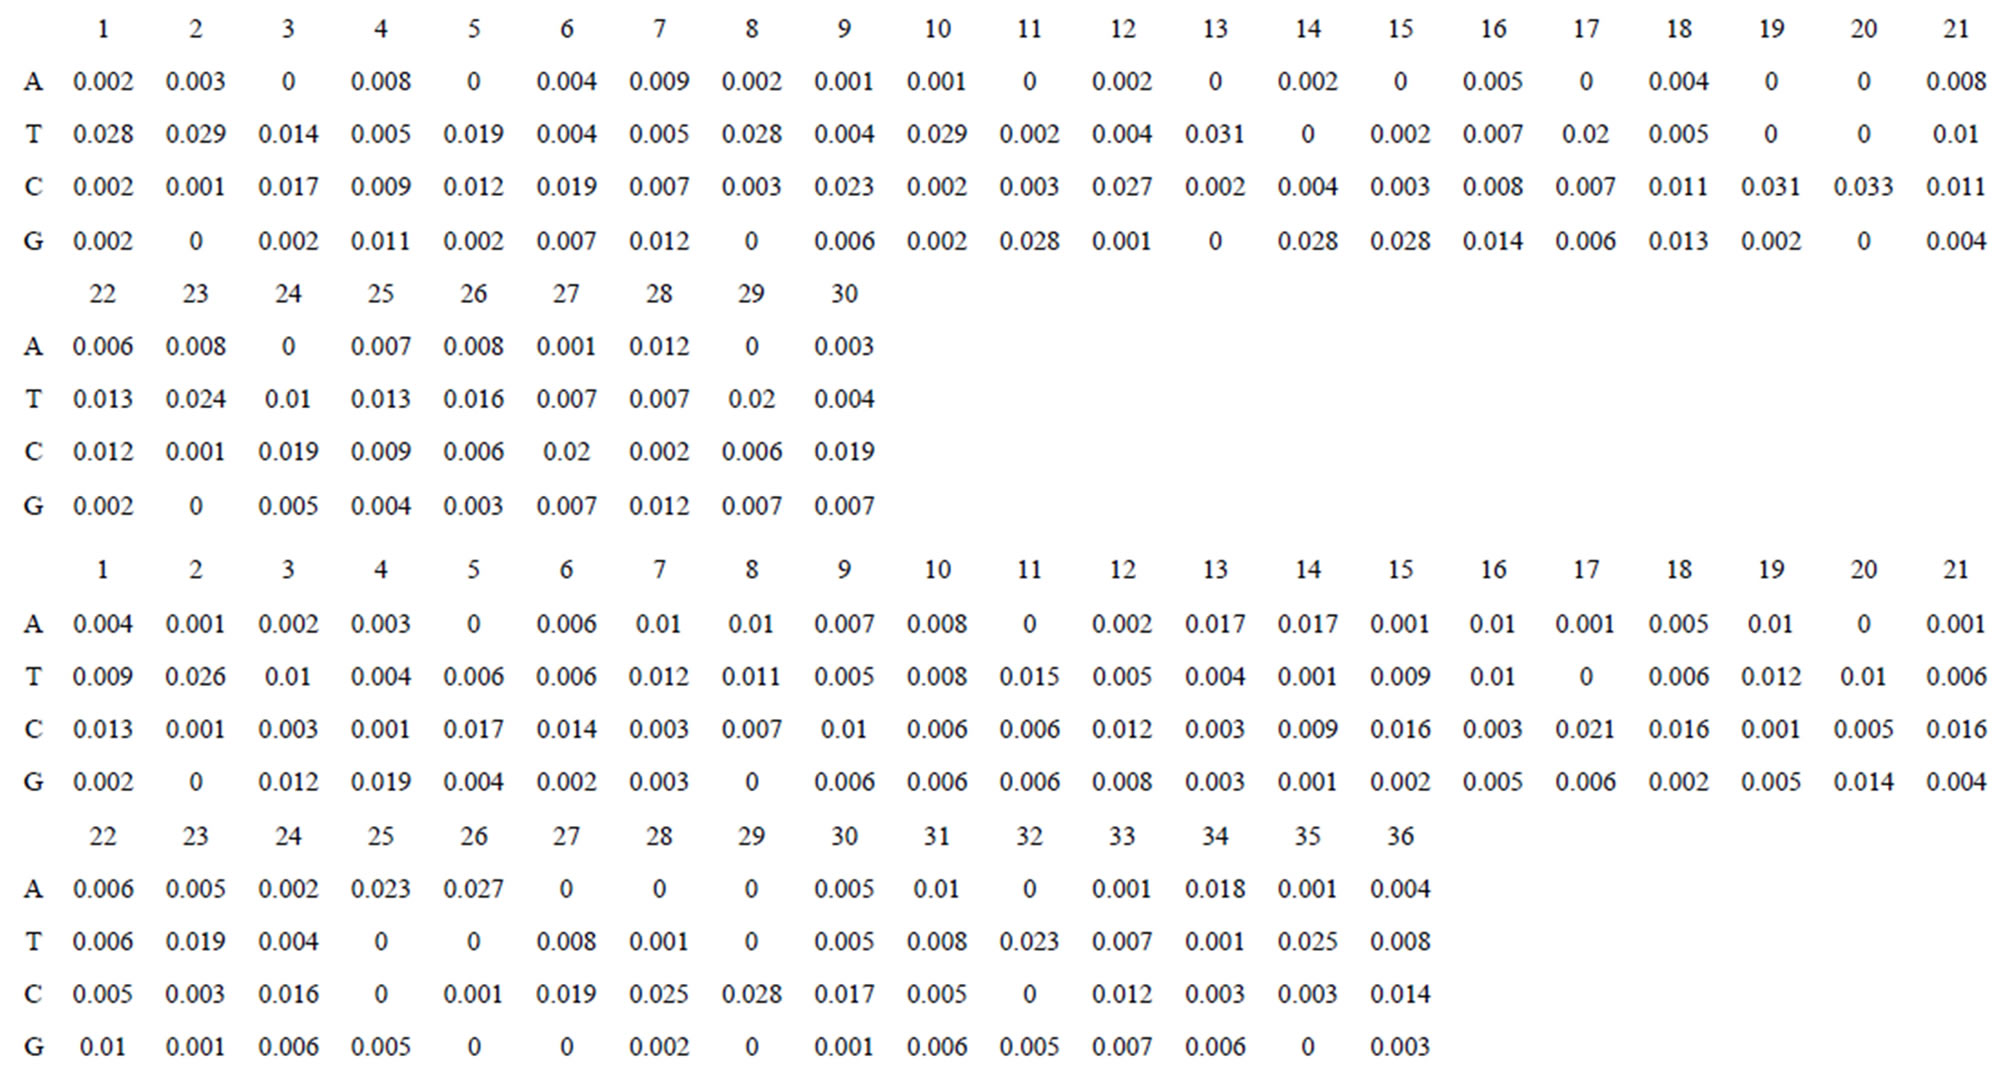
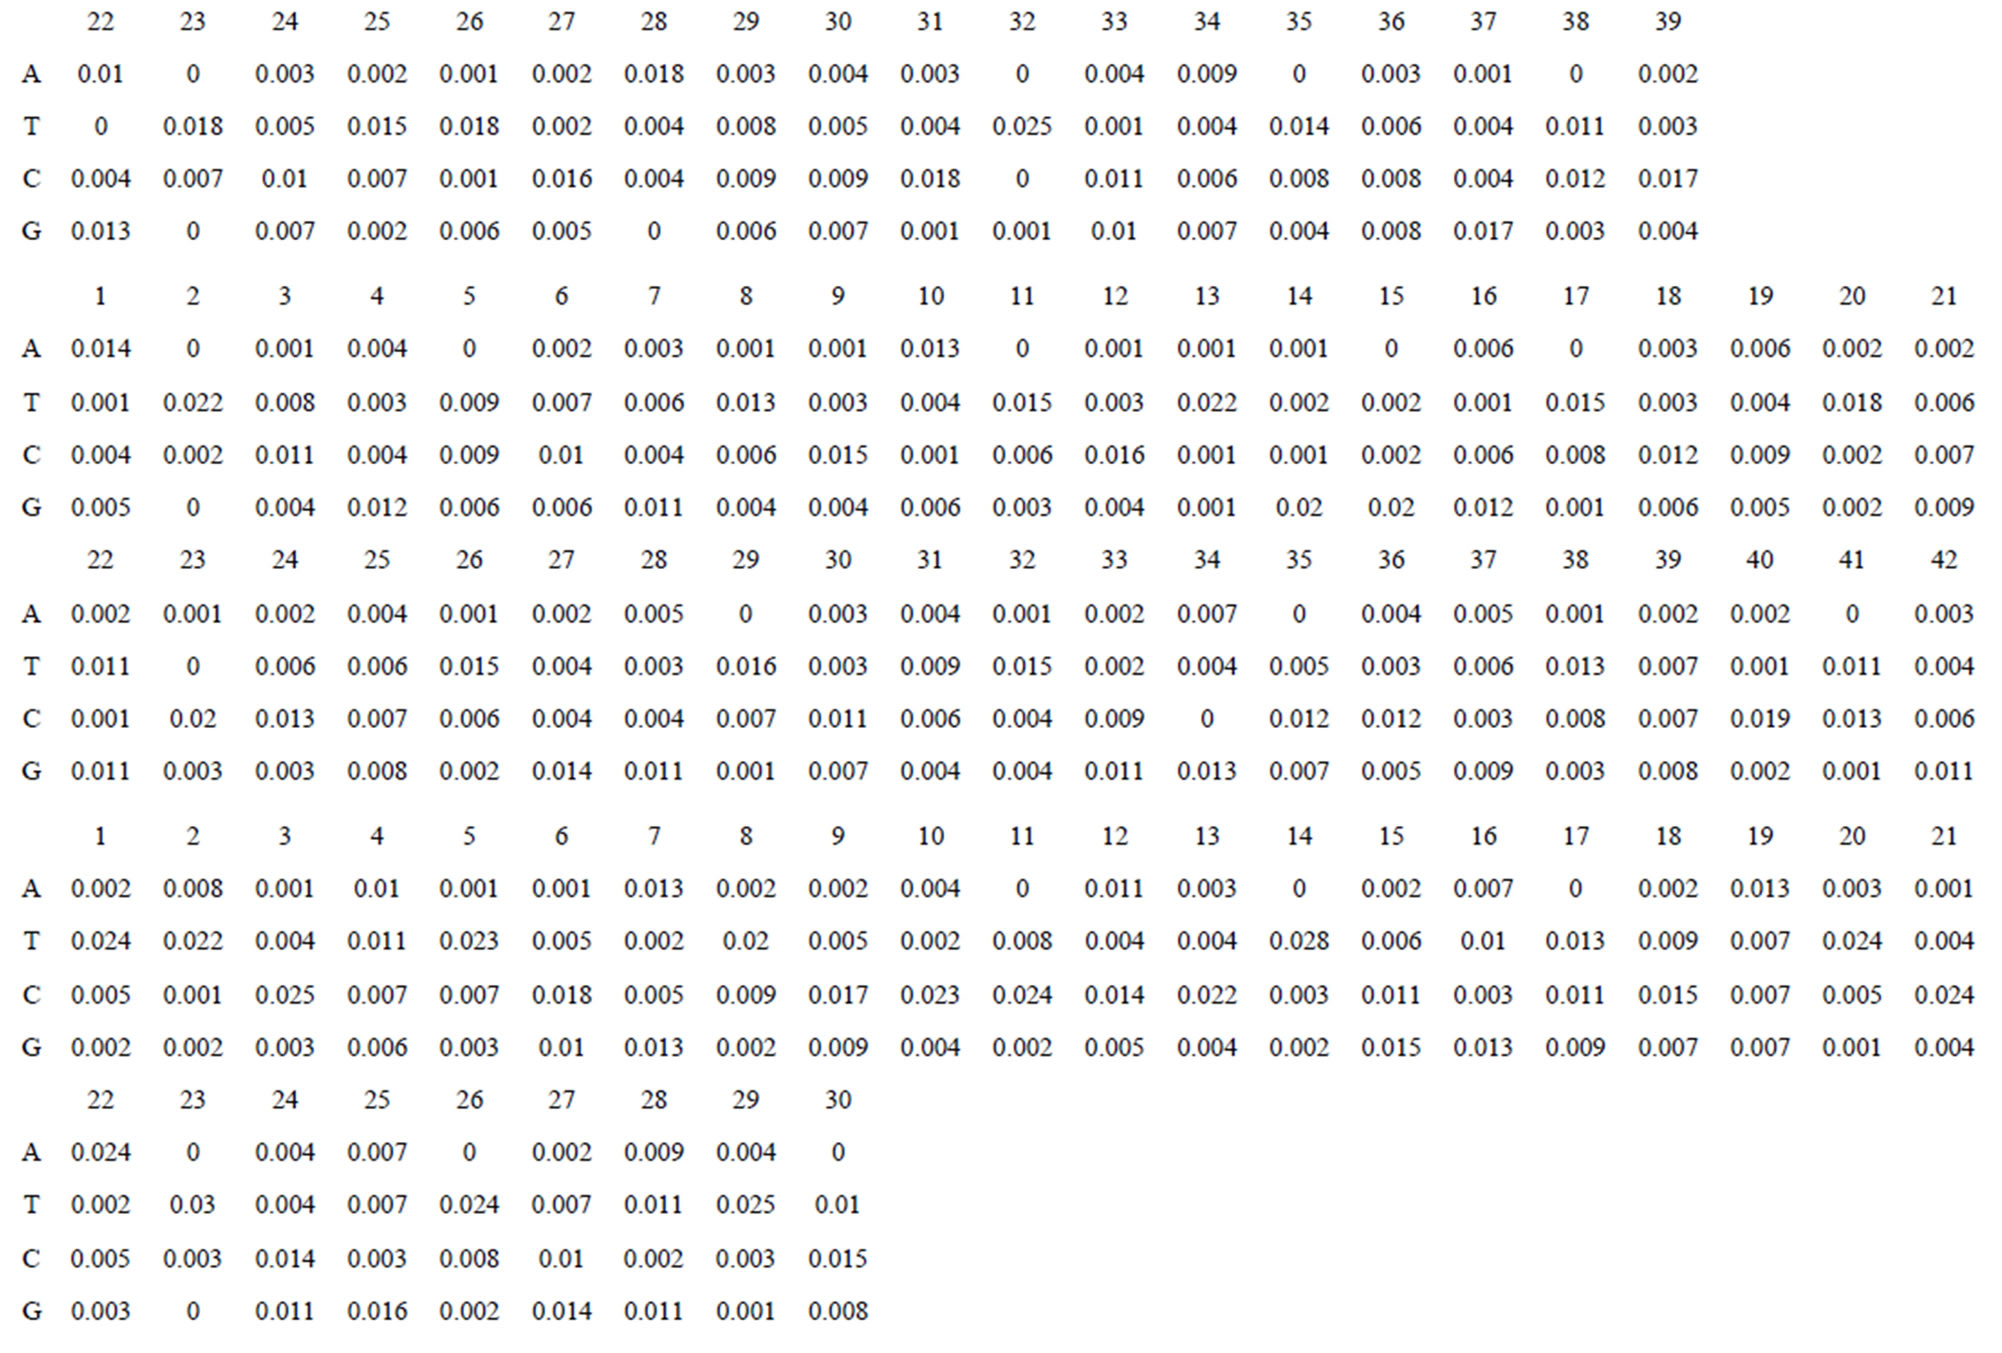
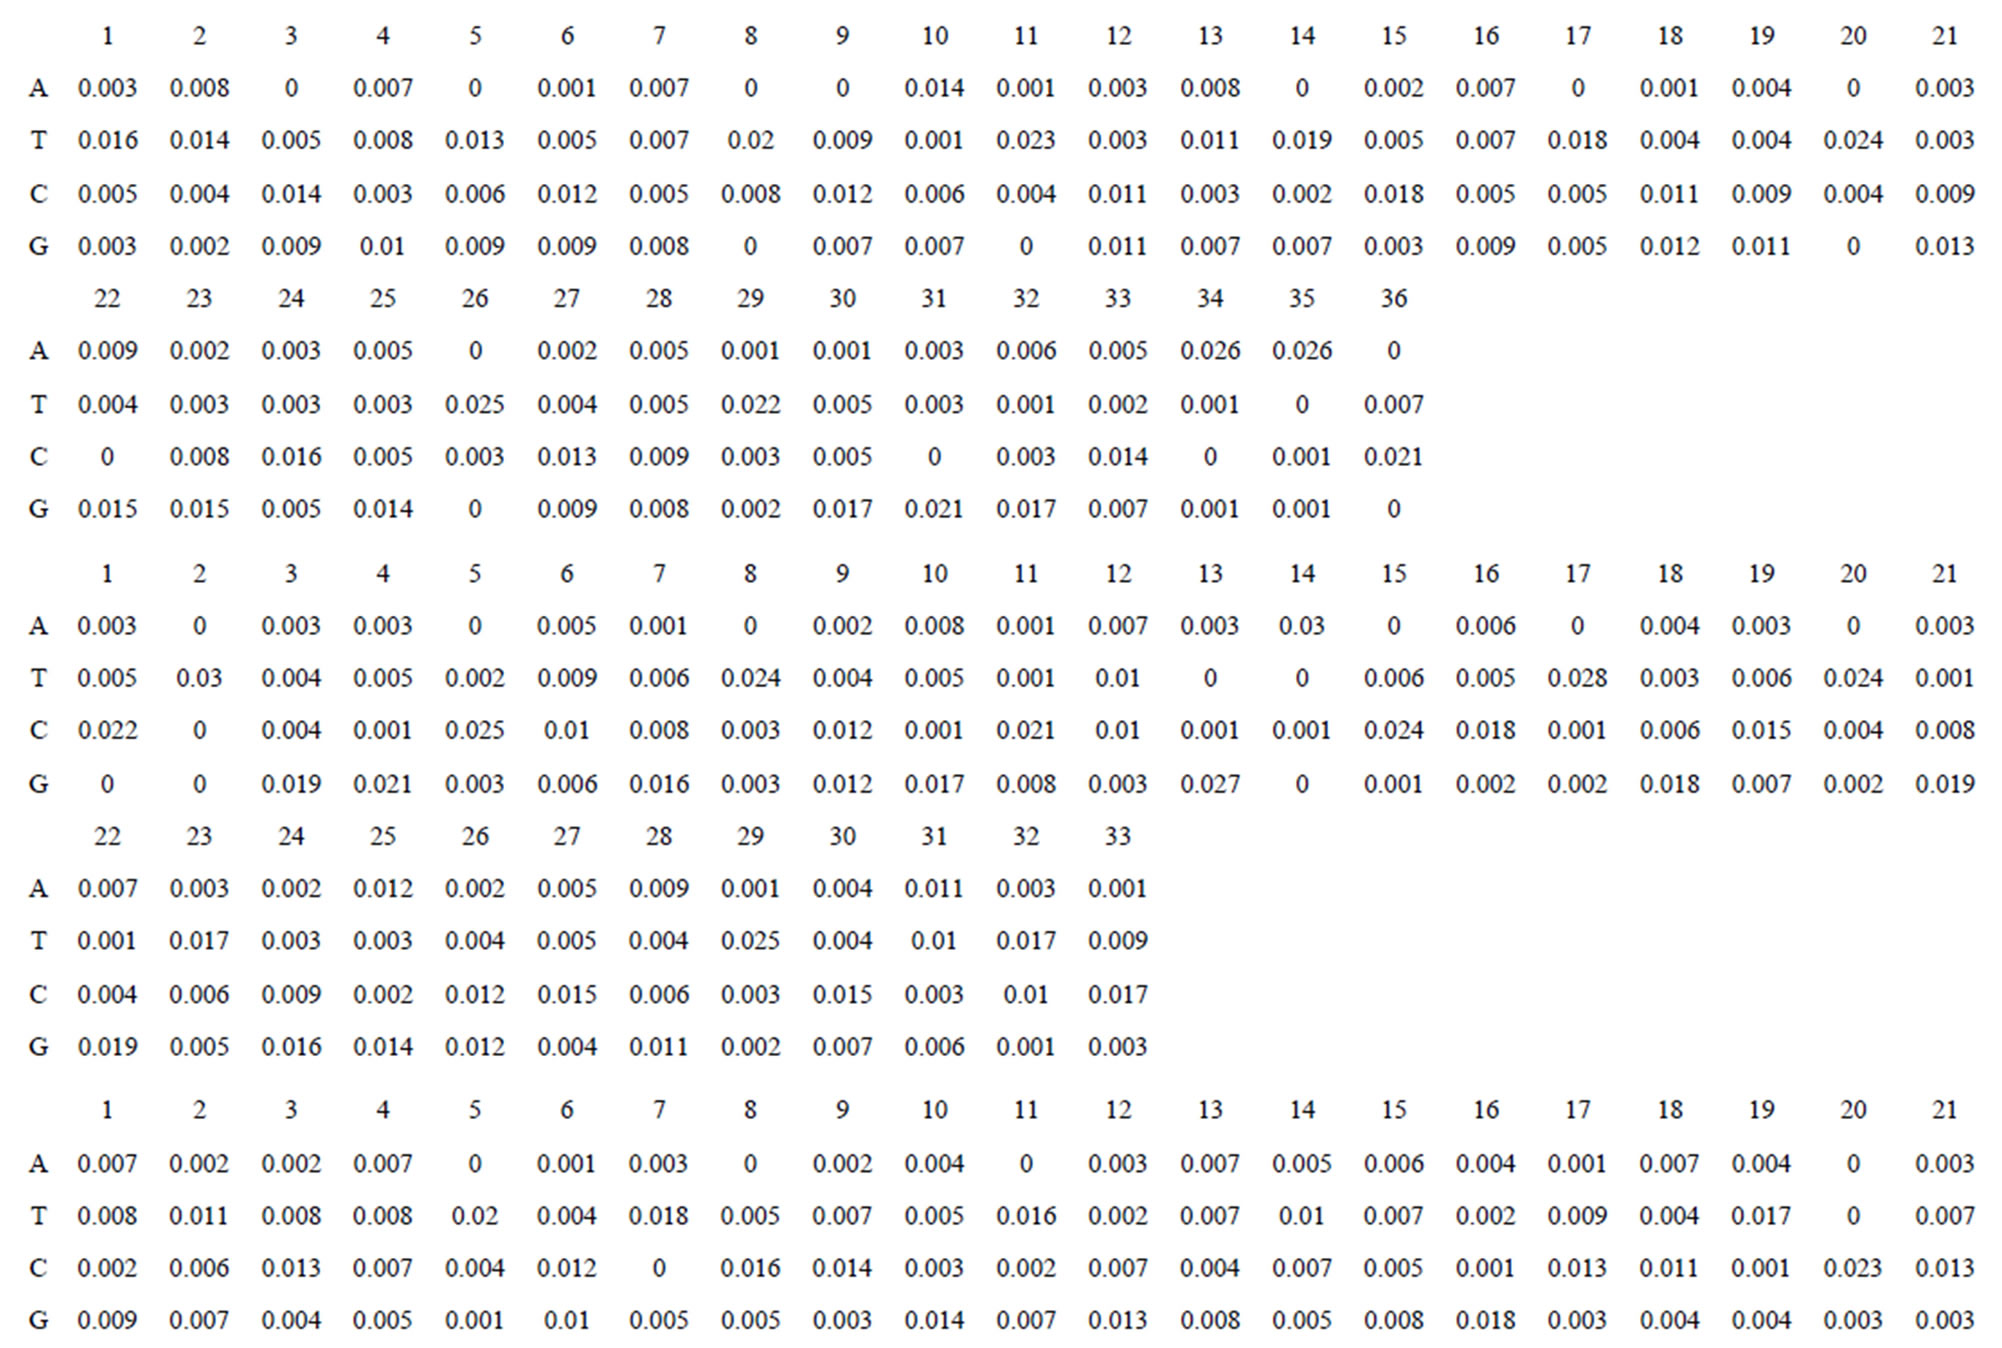
Figure 2. The scoring matrices of seven transmembrane regions of GPCRs in Group 1 of the training datasets (TM1-TM7: From top to bottom).
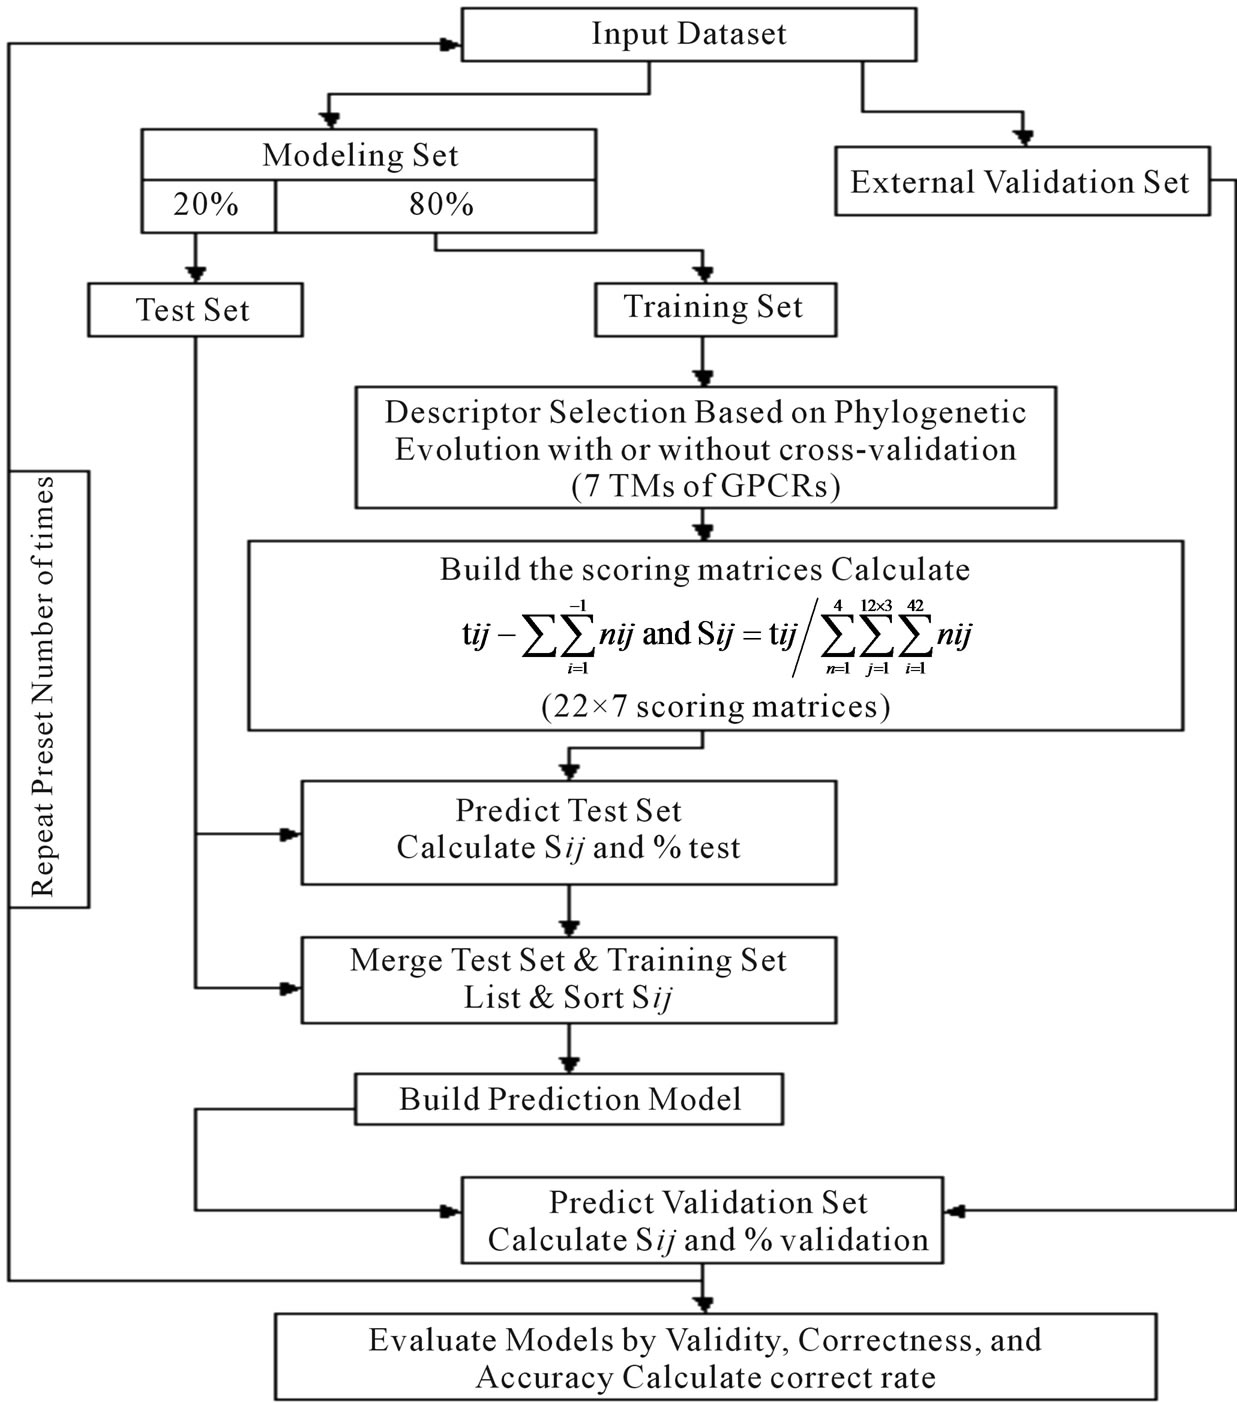
Figure 3. Flowchart of the algorithrm.
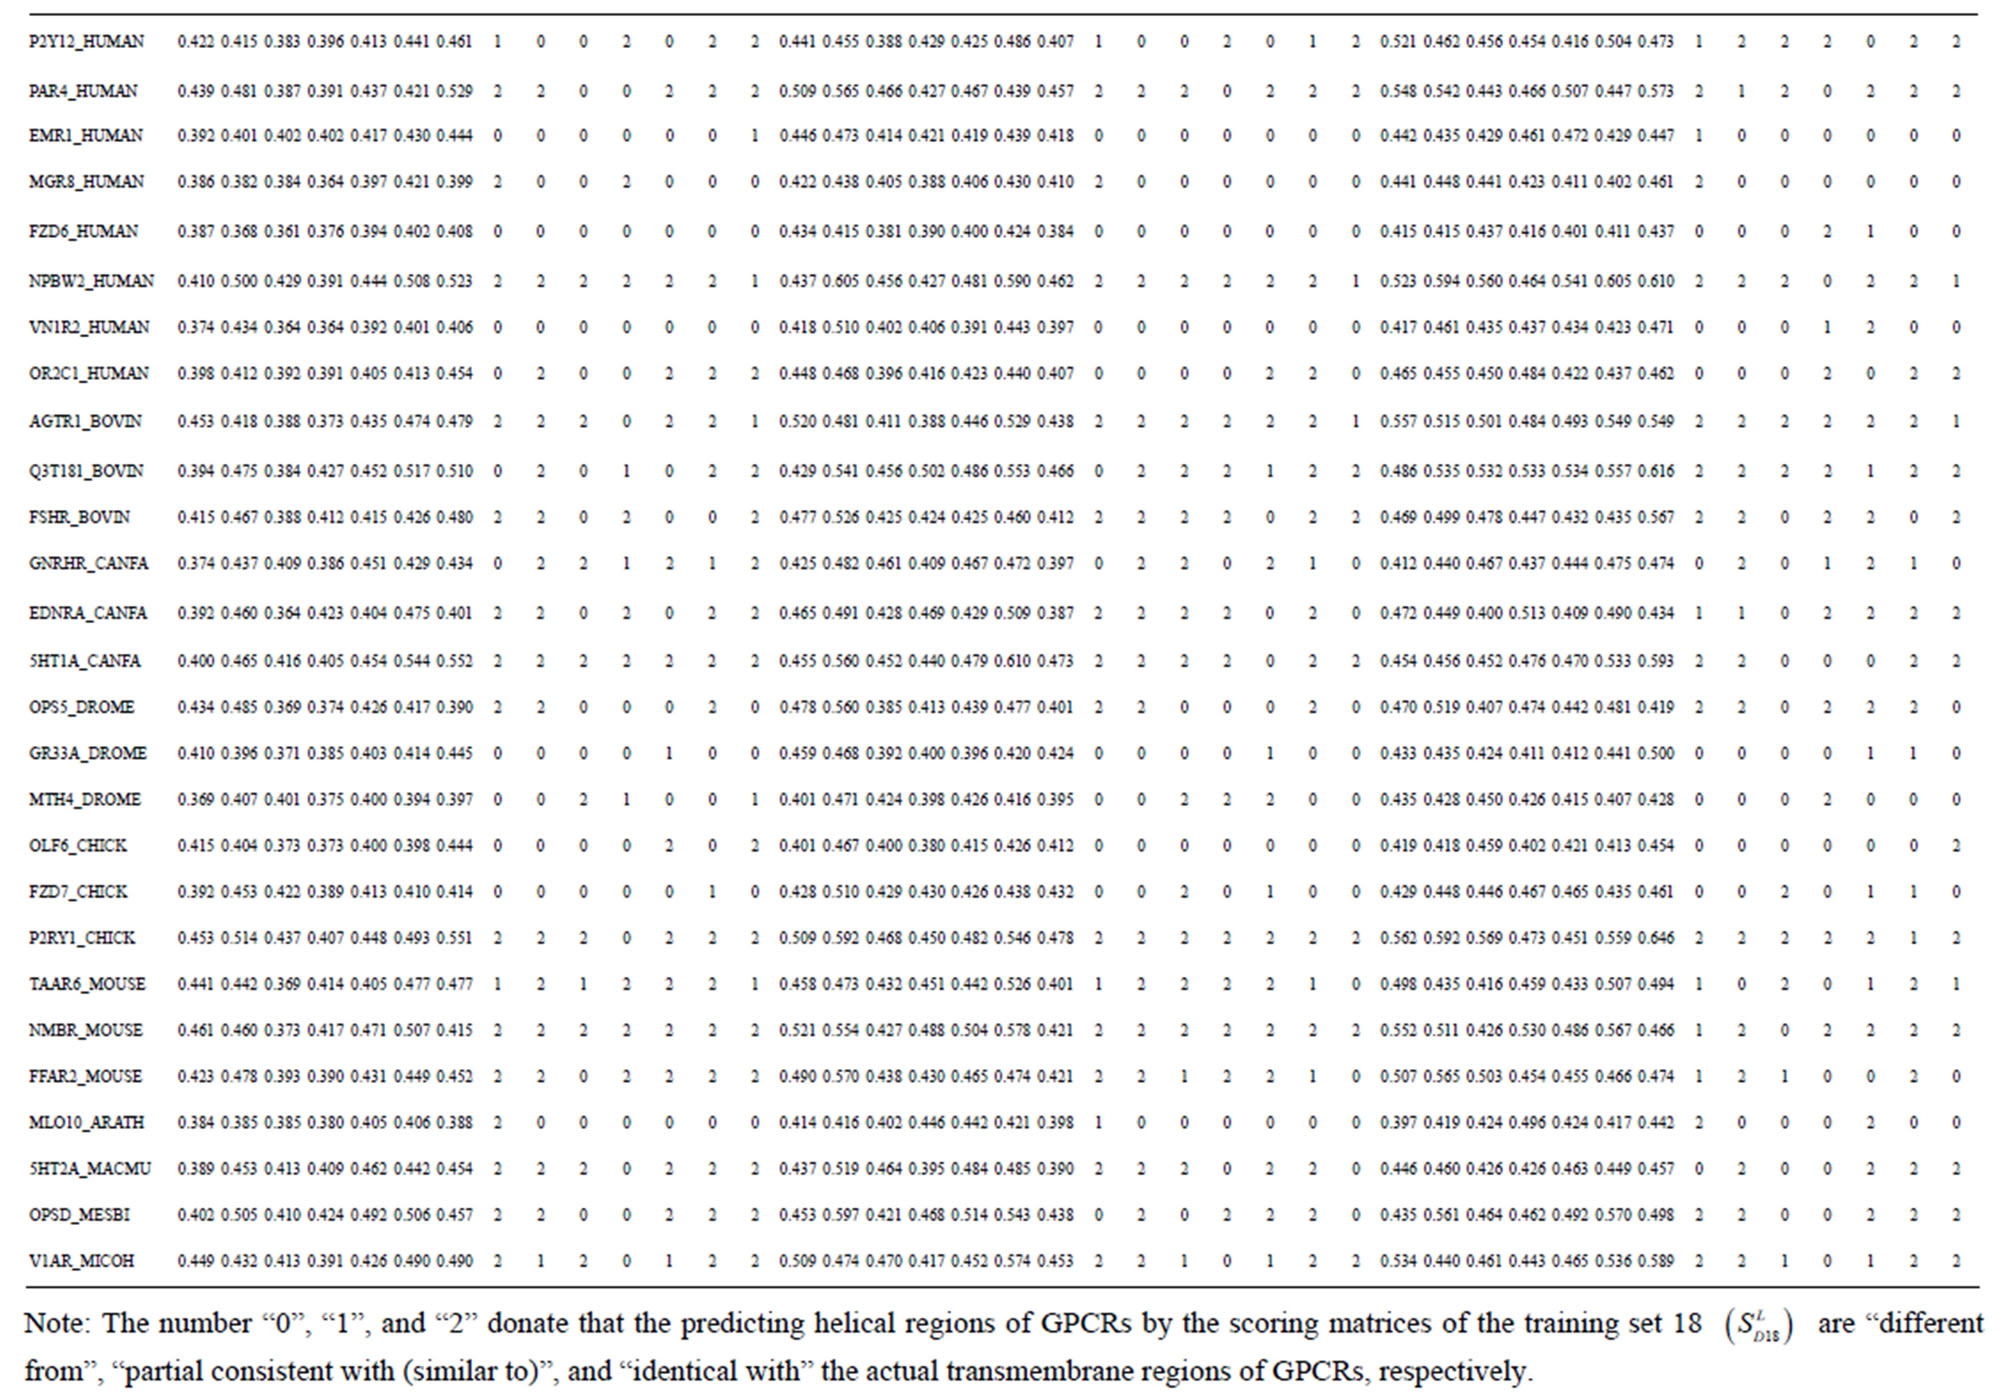
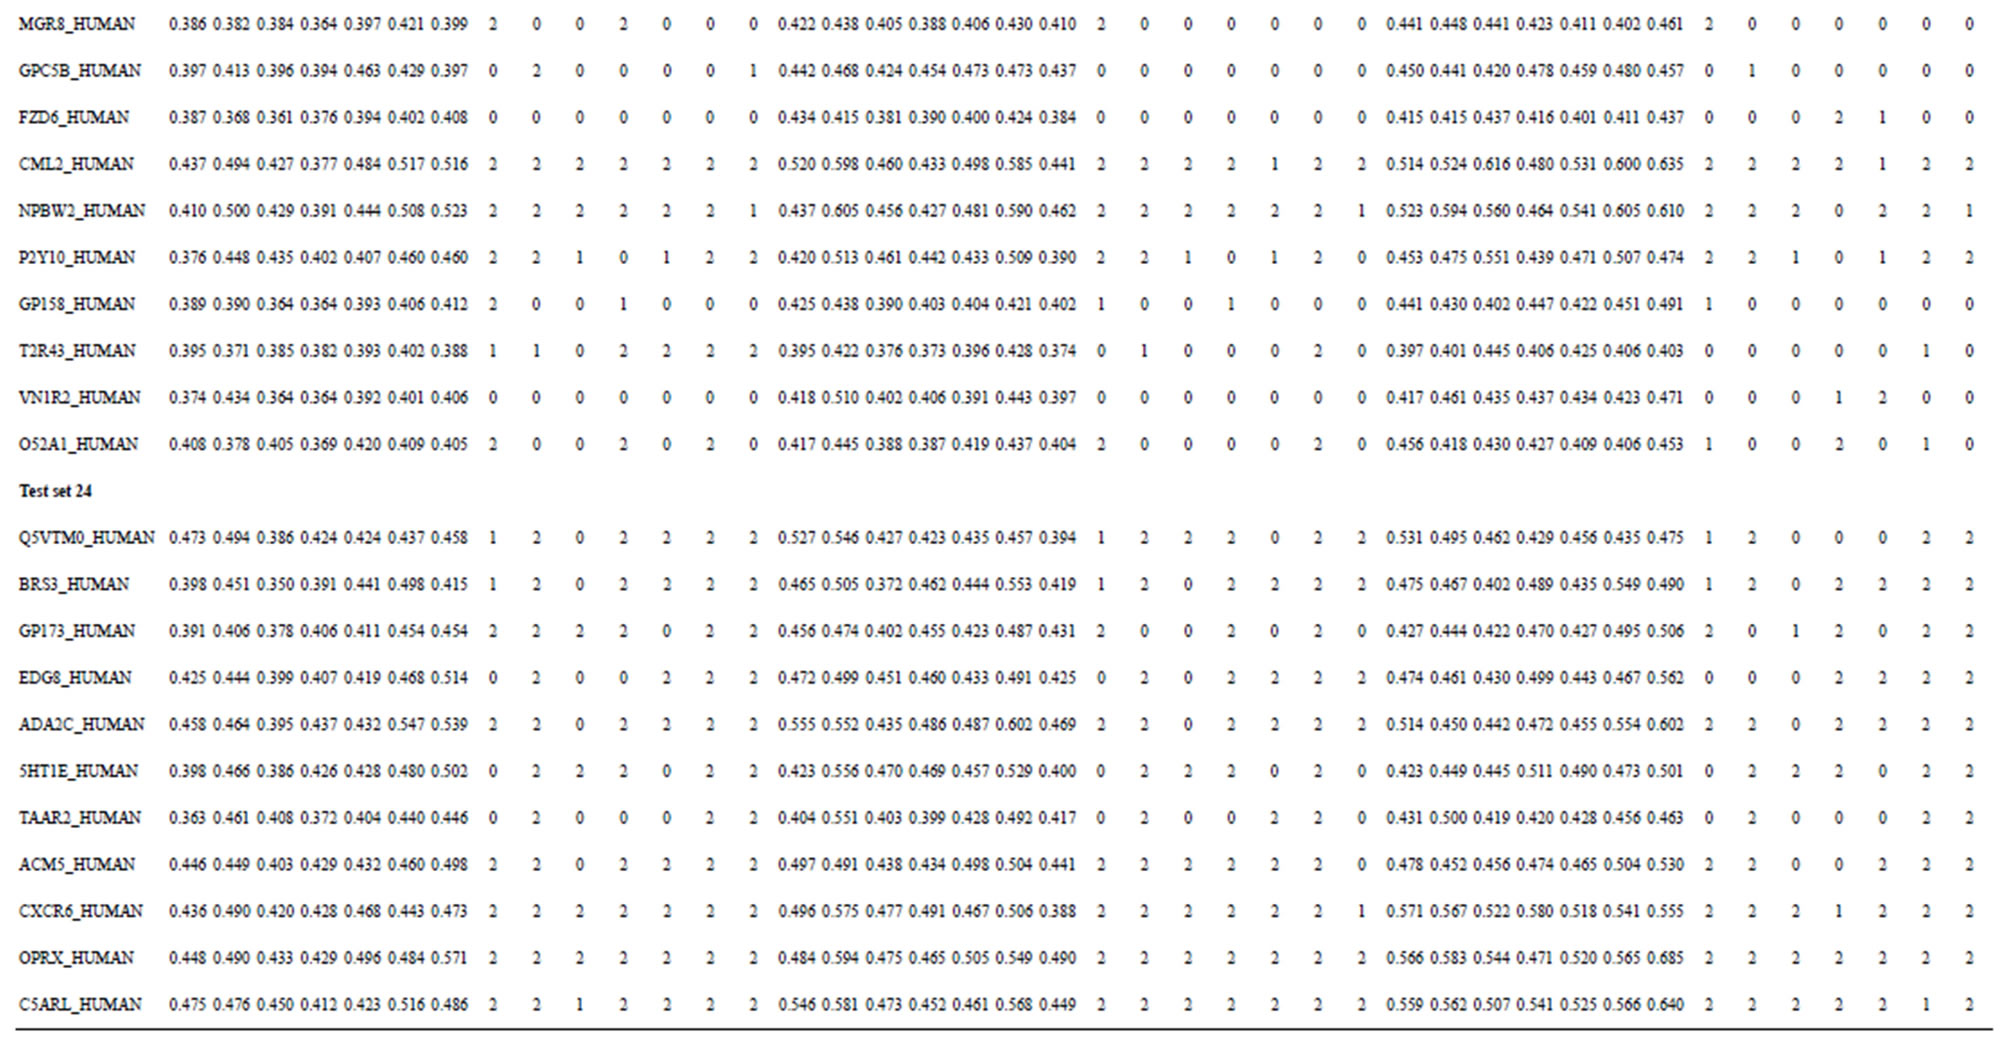
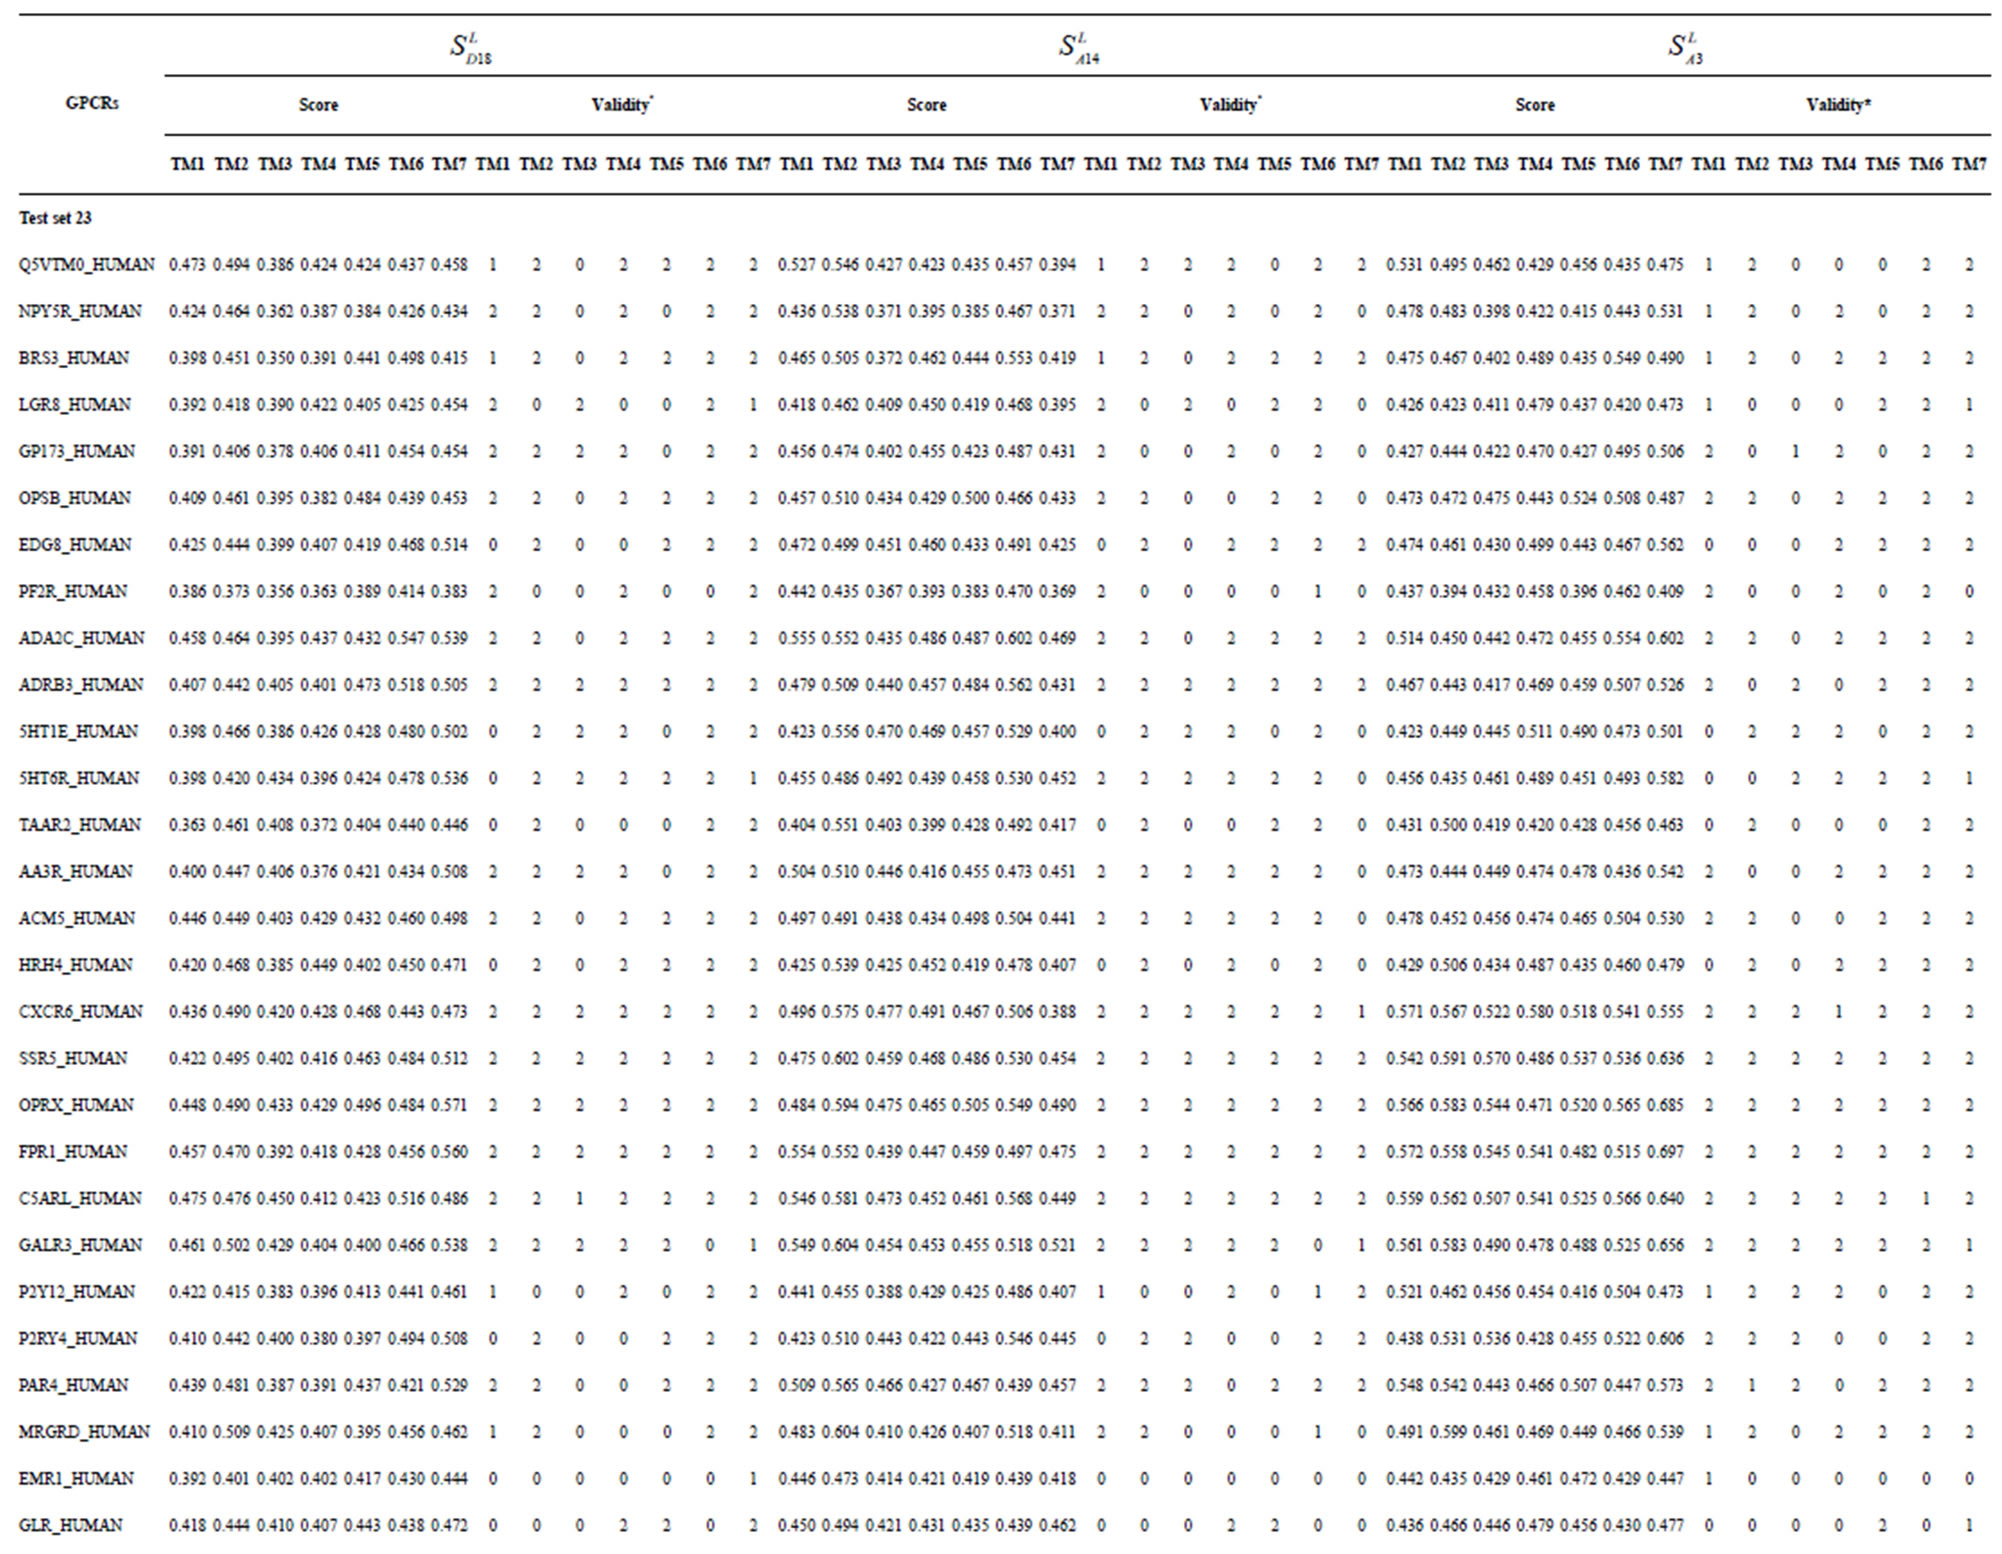
Table 3. The scores and the validity of prediction each transmembrane region of GPCRs in test sets by the scoring matrices of training set 18, 14 and 3.
3. RESULTS
In what follows, we present three primary results, based on application of the methods described above.
3.1. Phylogenetic Analysis and Structural Evolution
Figure 1 displays the grouping frame of the training datasets (learning dataset, ), where 22 groups belong to three types. Of the different chromosome type, there are five classes: Class A (Groups 1-4 and Group 14), Class B (Group 15), Class C (Group 16), Class F (Group 22), and Class O (Groups 5-13 and Group 17). Group 1
 , Group 2
 , Group 3
 , Group 4
 , and Group 14
  of Class A are composed of 44, 38, 32, 20, and 44 GPCRs, respectively. Class B
 , C
, C , and F/S
  contain 13, 10, and 9 GPCRs, respectively. Groups
  and 13
  consist of 39, 24, 33, 11, 48, 40, 44, 20, and 20 GPCRs, respectively; while Group 17
  includes 33 GPCRs. Group 18
 , Group 19
 ,Group 20
 , and Group 21
  contain 39, 27, 22, and 20 GPCRs, respectively. The following test datasets
  are composed of two groups: Group 23
  from human and Group 24
  from different species (Appendix 1, Table 3). Here,
  ,
,  ,
,
 , and
, and ;
; ,
,  ,
,  ,
,  ,
,  ,
,  ,
,  ,
,  and
and ;
; ,
,  ,
,  ,
,  and
and .
.
Table 1 lists the amino acid sequences of TM1 in Group 1 GPCRs, the common 12-residue regions of TM1 by alignment, and the corresponding coding sequences consisting of 36 nucleotides. Table 2 displays the amino acid sequence length and the sample number consisting of the scoring matrix of each transmembrane region of GPCRs in the training datasets after sequence alignments. Different the training sets, different the amino acid sequence length and the sample number consisting of the scoring matrix to same TMs; the same the training sets, different the amino acid sequence length and the sample number consisting of the scoring matrix to different TMs. Figure 2 illustrates the scoring matrices of seven TMs (TM1-TM7) of GPCRs in Group 1 of Class A in the training datasets. This is the core of prediction system of GPCRs.
3.2. Validation of the Models (Scoring Matrix)
22 scoring matrices are built based on the 22 groups of training datasets  from GPCR superfamily and validated by two groups of test sets
 . Tables 4 and 5 display the score and the prediction accuracy of the coding sequences of GPCRs’ trans-membrane segments in test sets by the scoring matrices of the different training datasets. All the data can be clearly divided into four categories:
  -“2”,
-“2”,  -“1 + 2”,
  -“2” and
  -“1 + 2”. The number “2” donates that the predicting helical regions of GPCRs by the scoring matrices of the training set are identical with the actual TM regions of GPCRs, while the number “1” donates the predicting helical regions of GPCRs are partial consistent with their actual TMs. “1 + 2” means the combination of “2” with “1”, namely the positive prediction results. There are 22 examinations (corresponding 22 training sets) in each category. For instance, if we use test set
  to examine Group 1
  of training set, and then get seven “all hit” (“2”) correctness rates (validity) (TM1 to TM7). These 7 correctness rates as a whole can be deemed as examination 1 in
  -“2”. Under this situation, mean of one examination’s correctness rate is the mean of the seven correctness rates (Table 5). The rest may be deduced by analogy.
3.3. Statistics Analysis
One way-ANOVA, a powerful and common statistical procedure, is used to figure out whether there are significant differences among means of correctness rate of the examinations. As one way-ANOVA requires, all data that does not obey normal distribution are eliminated, such as Groups 1, 6 and 10 of  -“2”, group 16 of
  -“1 + 2”, groups 12, 16 and 22 of
  -“2”, and groups 15, 19 and 22 of
  -“1 + 2”. The four results of one way-ANOVA, with F values of 21.931, 9.308, 22.807 and 7.488 for
  -“2”,
-“2”,  -“1 + 2”,
  -“2” and
  -“1 + 2”, respectively, indicate that there are significant differences between means of correctness rate of examinations at the 0.01 level in each category. Then Test of Homogeneity of Variances is applied in order to find a suitable method for multiple comparisons. Actually,
  -“1 + 2” and
  -“1 + 2”, with P values of 0.7673 and 0.7121, respectively, has homogenous variances at the 0.05 level, and LSD method of multiple comparisons will be used. On the other hand, variances of
  -“2” and
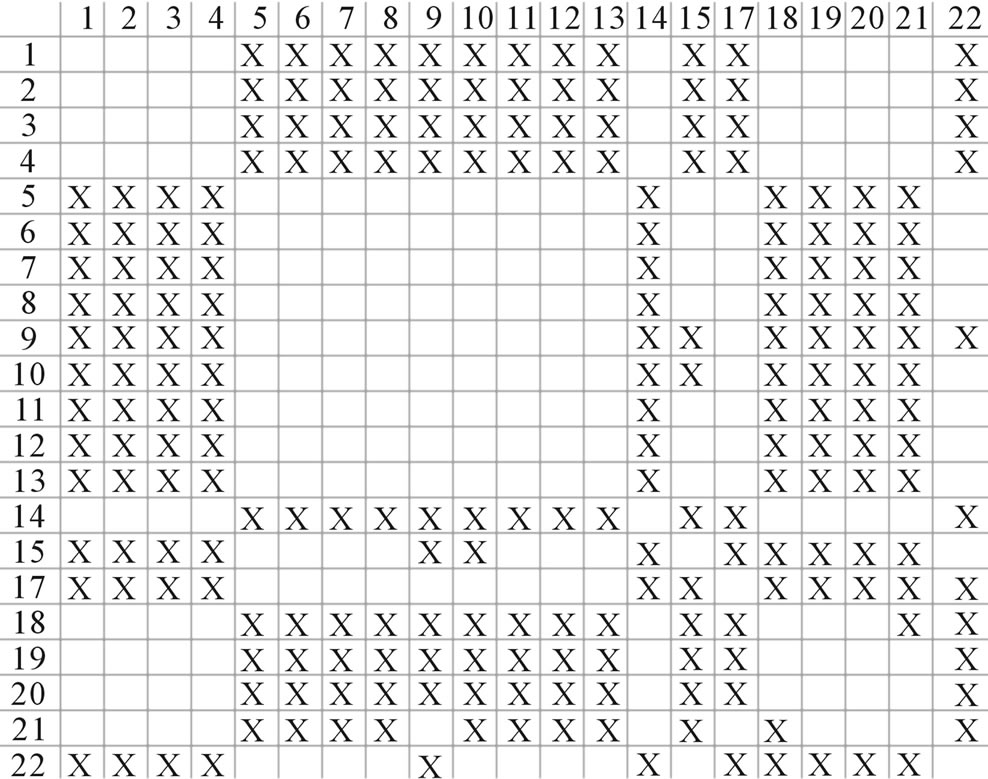
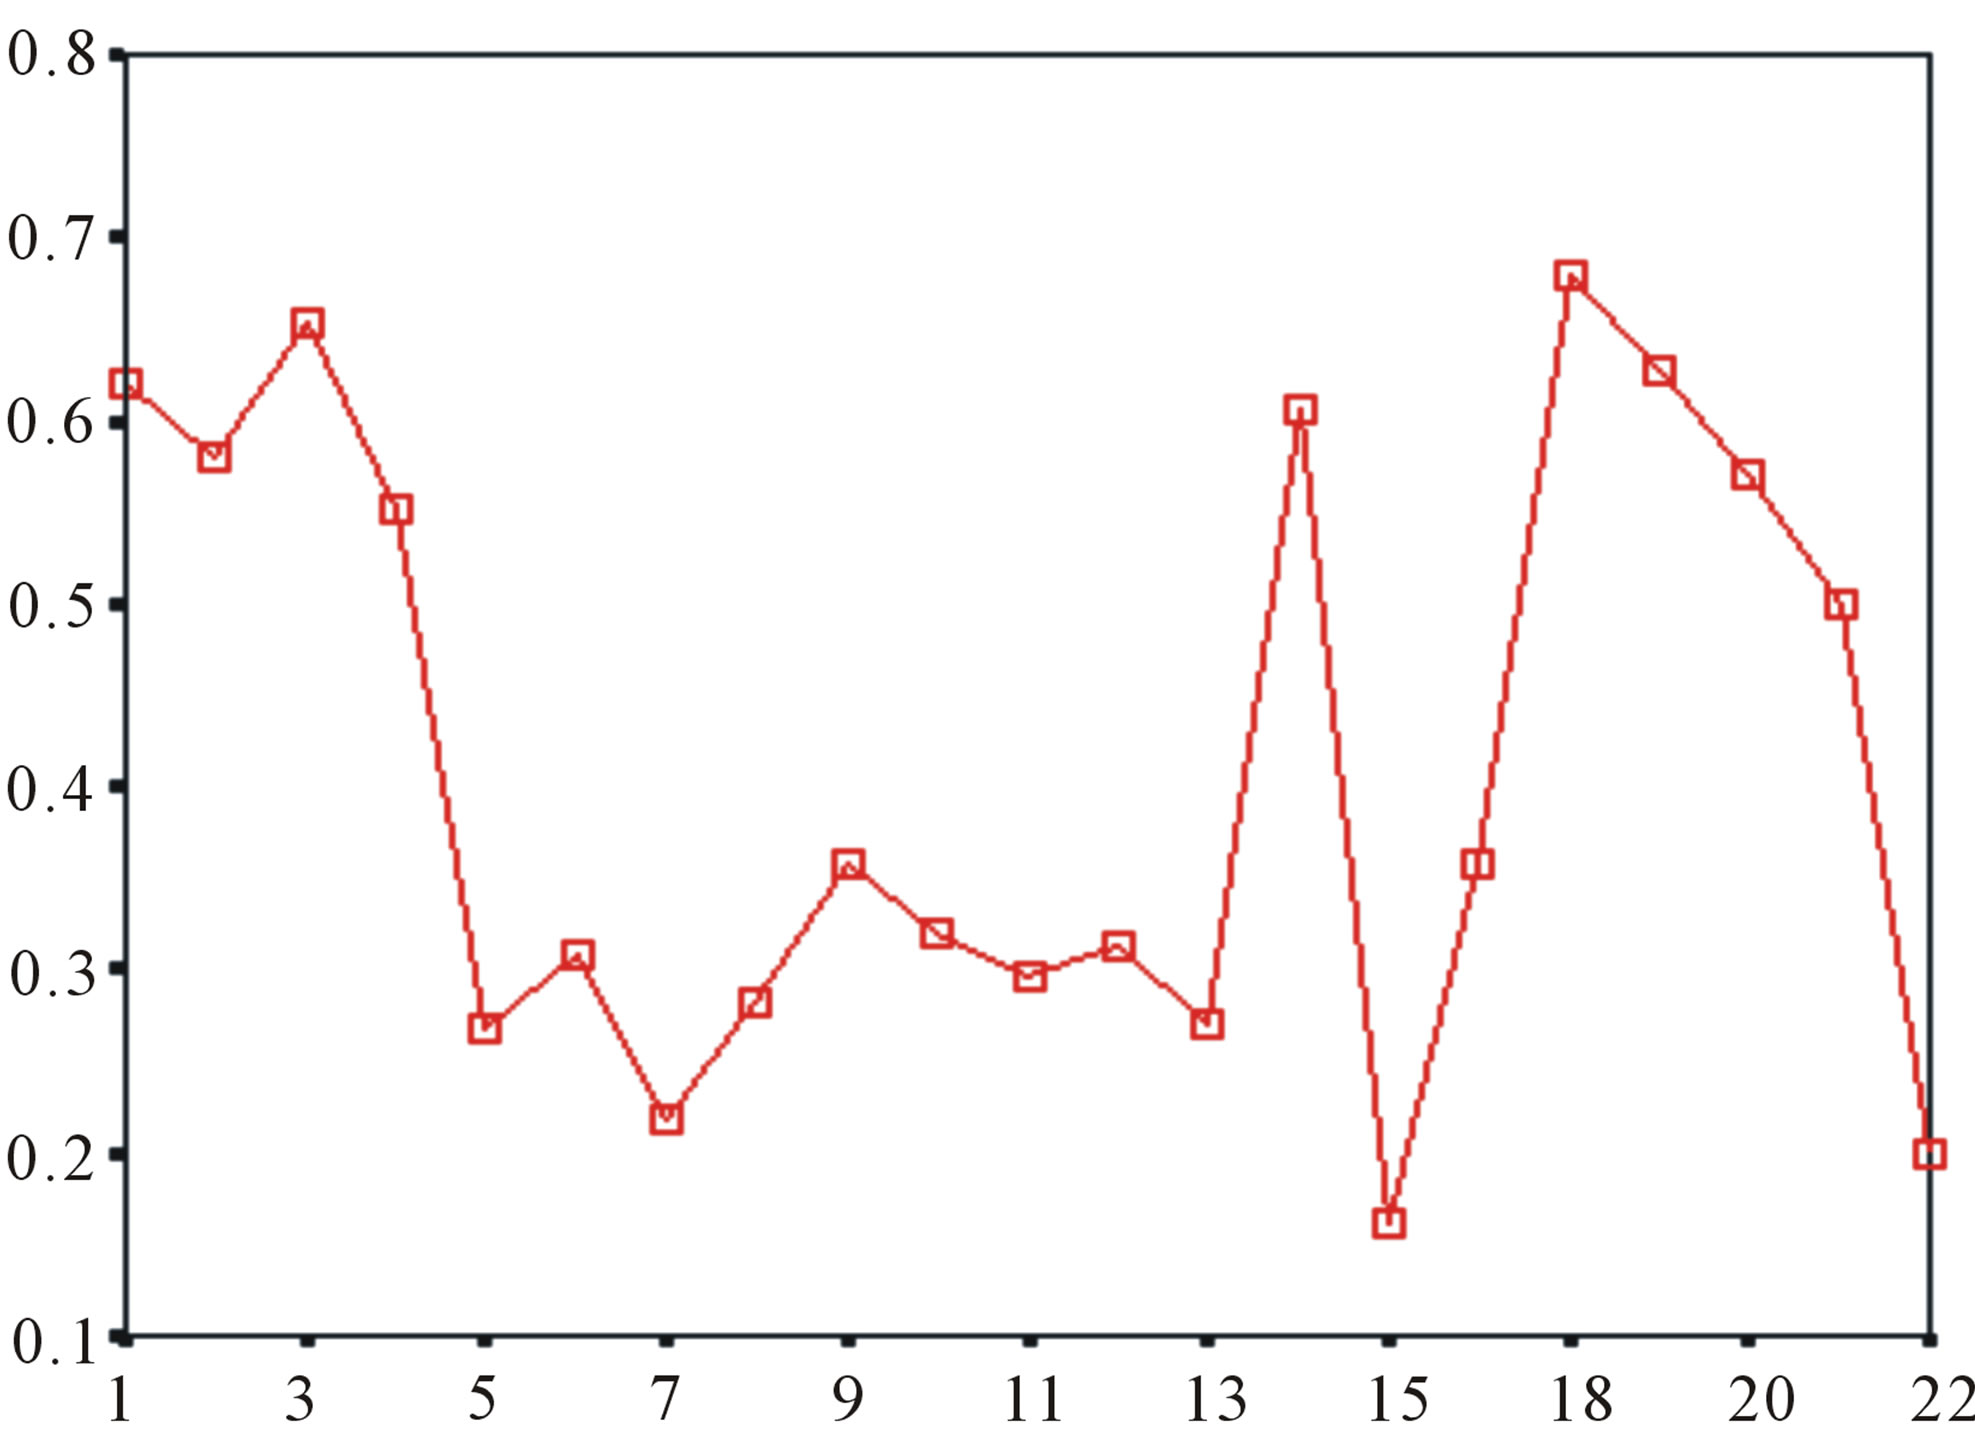
  -“2” with P values of 0.0032 and 0.0418, respectively, are not homogenous, which means that Tamhane’s T2 should be chosen as multiple comparisons method. The results of multiple comparisons are respectively visualized in Figure 4, where “X” shows there are significant differences (at the significant level of 0.05) between the two examinations indicated by corresponding column and line (specific value of multiple comparisons can be found in supplemental data). Finally, the average of correctness rate of examinations of each category are plotted respectively on Figure 5, from which we can see that the training set of 18 has the highest mean of correctness rate when examined by test set in each of the four groups although training set 18 and other training sets such as 2, 3, 4, 14, etc. has not statistical difference. ANOVA results reveal that there are three scoring matrices significant, from three training datasets, Group 3
 , 14
, 14 , and 18
 , respectively (Figure 5).
The following t-test results reveal that the mean difference of the scores between two groups, “2”/“2 + 1” and “0”, are statistically significant (P < 0.05) with the exception of TM4 and TM5 (Table 6) based on the scores and the validity of GPCRs in test sets ( and
and ) by the scoring matrices of training set
 ,
,  and
and  (Table 3). Especially to TM2, TM3, TM6, and TM7, the mean of two groups between “2”/“2 + 1” and “0” is statistically significant (P < 0.01), which means that the probability of the difference being due to chance is less than 0.01. Of the seven TMs, there is significant different between the scores of two groups in TM2 with the t values from 4.494 to 6.959 (P < 0.001), where the degrees of freedom of a set of data are more than 30 but less than 40 (the critical value of t for the 0.001 level of significance at 30 of df is 3.646). On the other hand, t-values show that there are significant different between the scores of two groups by the scoring matrix of
  (P < 0.001) except in TM1, TM6, and TM7 of
  and TM5 of
  (P < 0.01). But the probability that the difference between samples in TM4 of
  and TM5 of
  is more than 0.05 due to sampling error.
Comparison of t-values in  with those in
  reveals that different scoring matrices have different statistical significance. To the scoring matrix of
  and
and , the mean differences between the scores of two groups in
  are more than those in
 ; whereas the mean differences in
  are more than those in
 . The reason may be the homology of samples consisting of training sets and test sets. The samples of
  and
and  come from different GPCR sub-families whereas those of
  come from the same GPCR subfamily. Similarly, the members of
  belong to human GPCR proteins whereas those of
  are GPCR proteins from different species.
Statistical graphs reveal that the mean scores of the predicting coding sequences of GPCRs’ 7 TMs in test sets ( and
and ) by the scoring matrices of
  is higher than those by
  except TM2 and TM6, while the predicting scores by
  are higher than those by
  except TM7 (Figure 6). Figure 7 shows the histo-
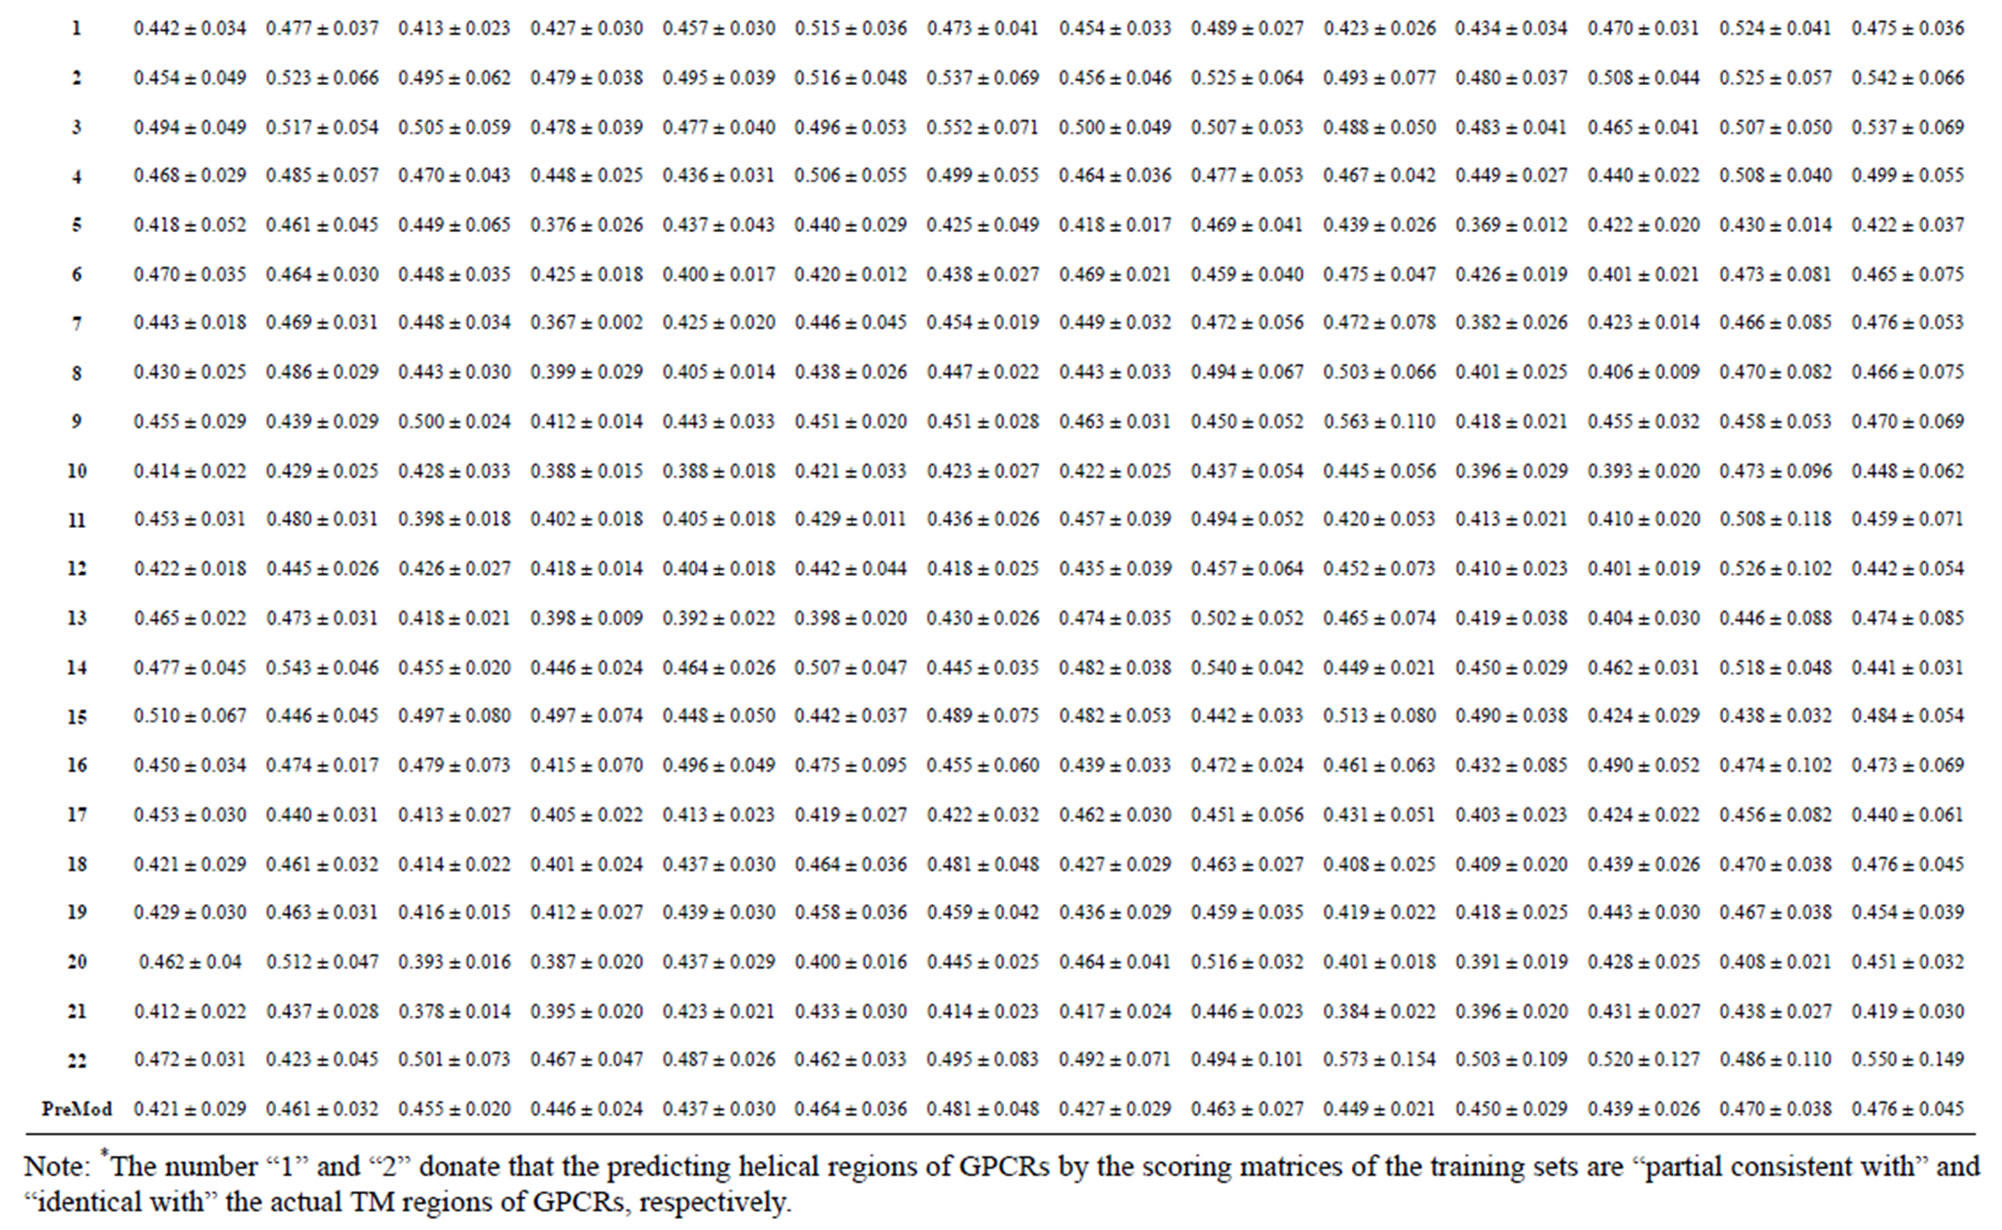
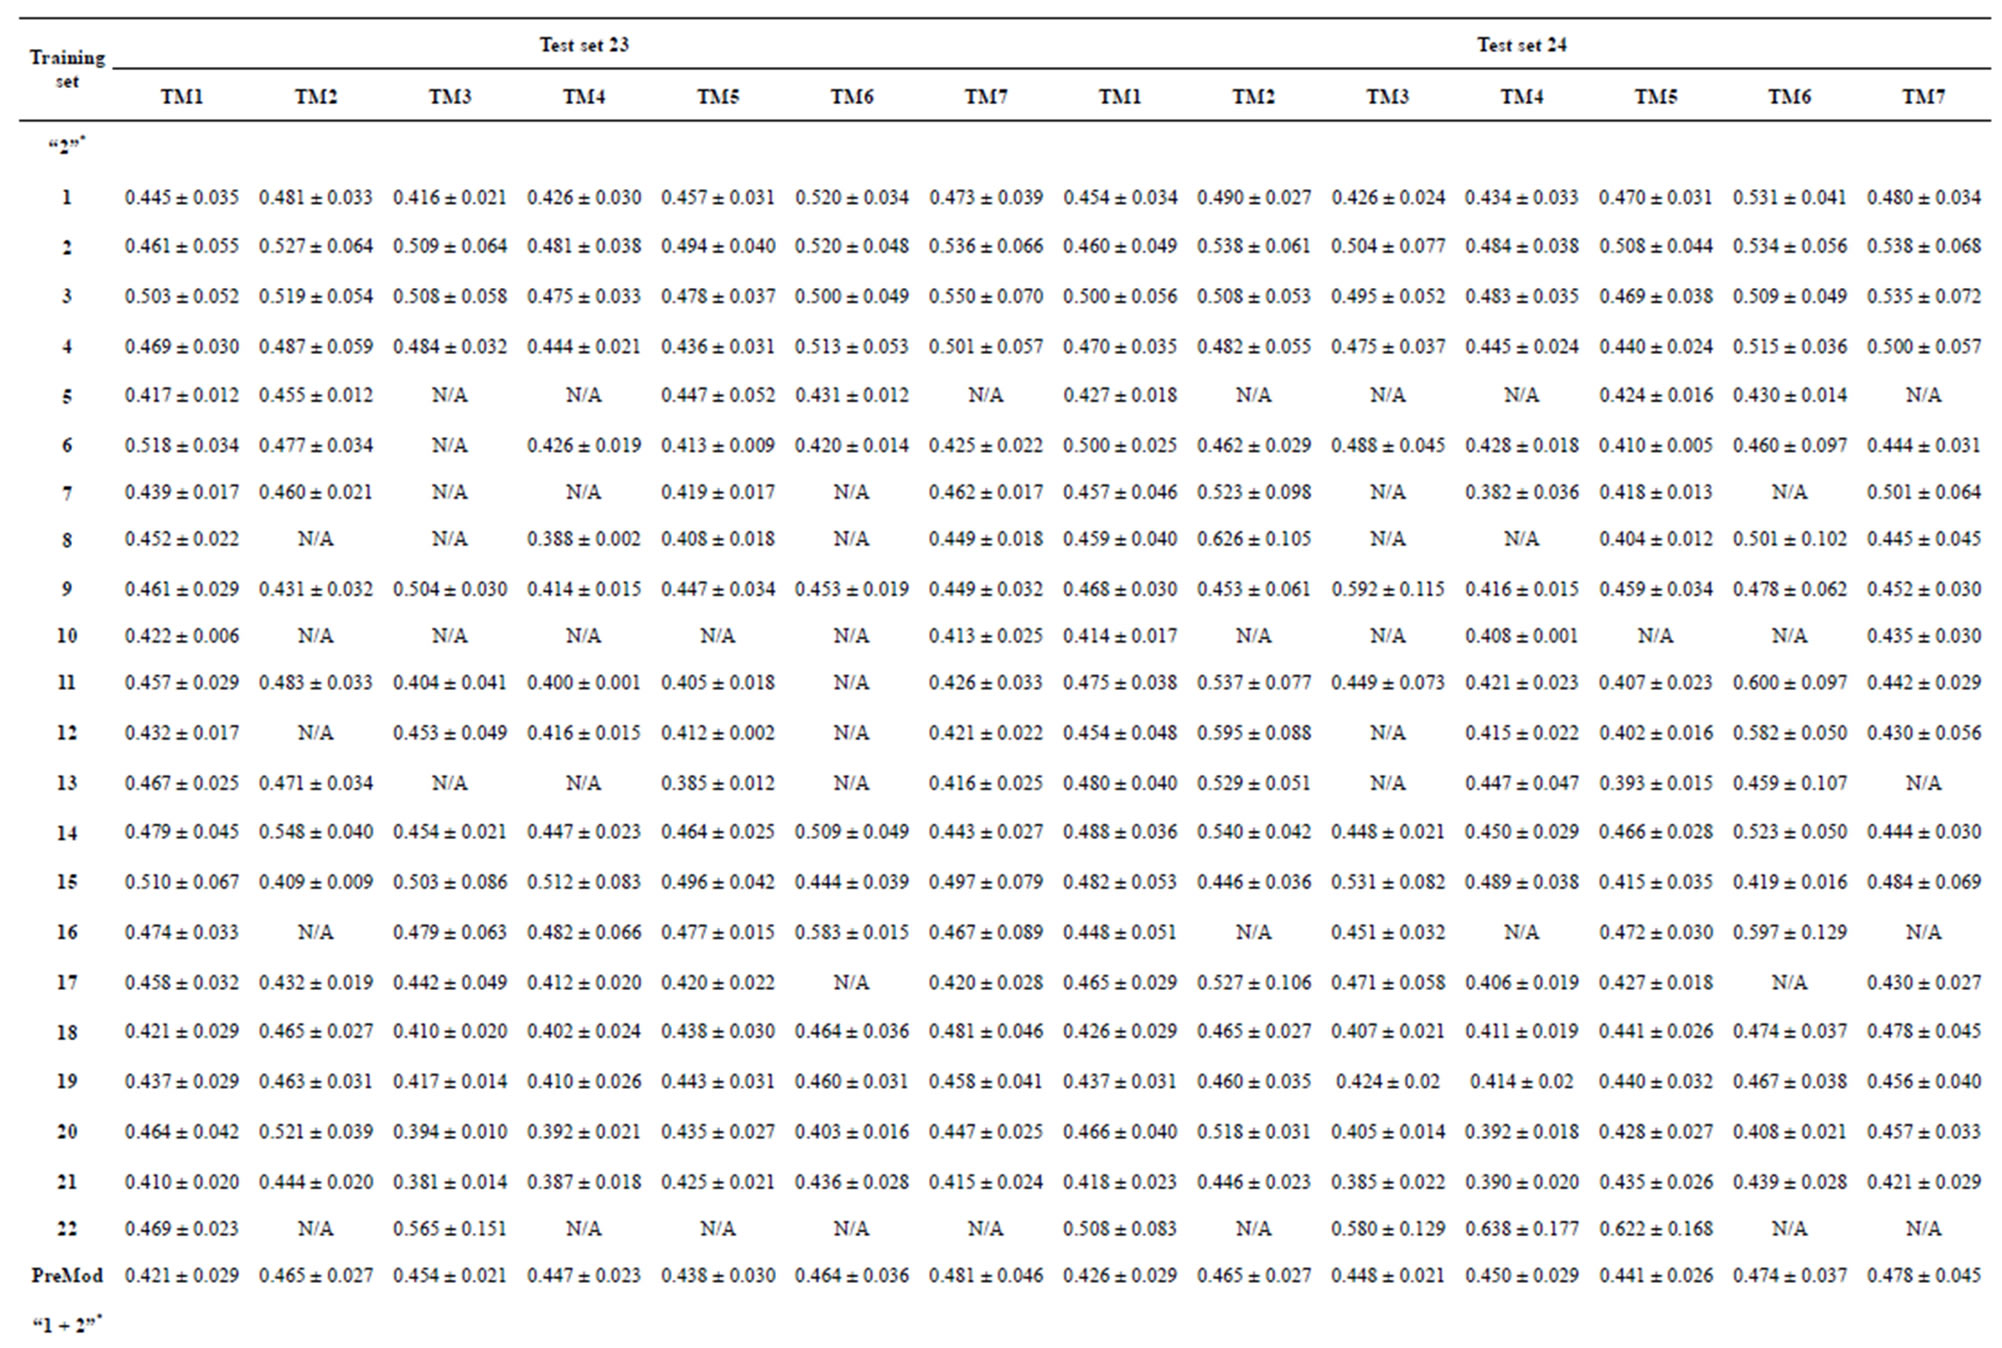
Table 4. The score of the coding sequences of GPCRs’ each trans-membrane segment in test sets by the scoring matrices of the different training datasets.
Table 5. The validity of prediction the coding sequences of GPCRs’ each TM segment in test sets by the scoring matrices of the different training sets.
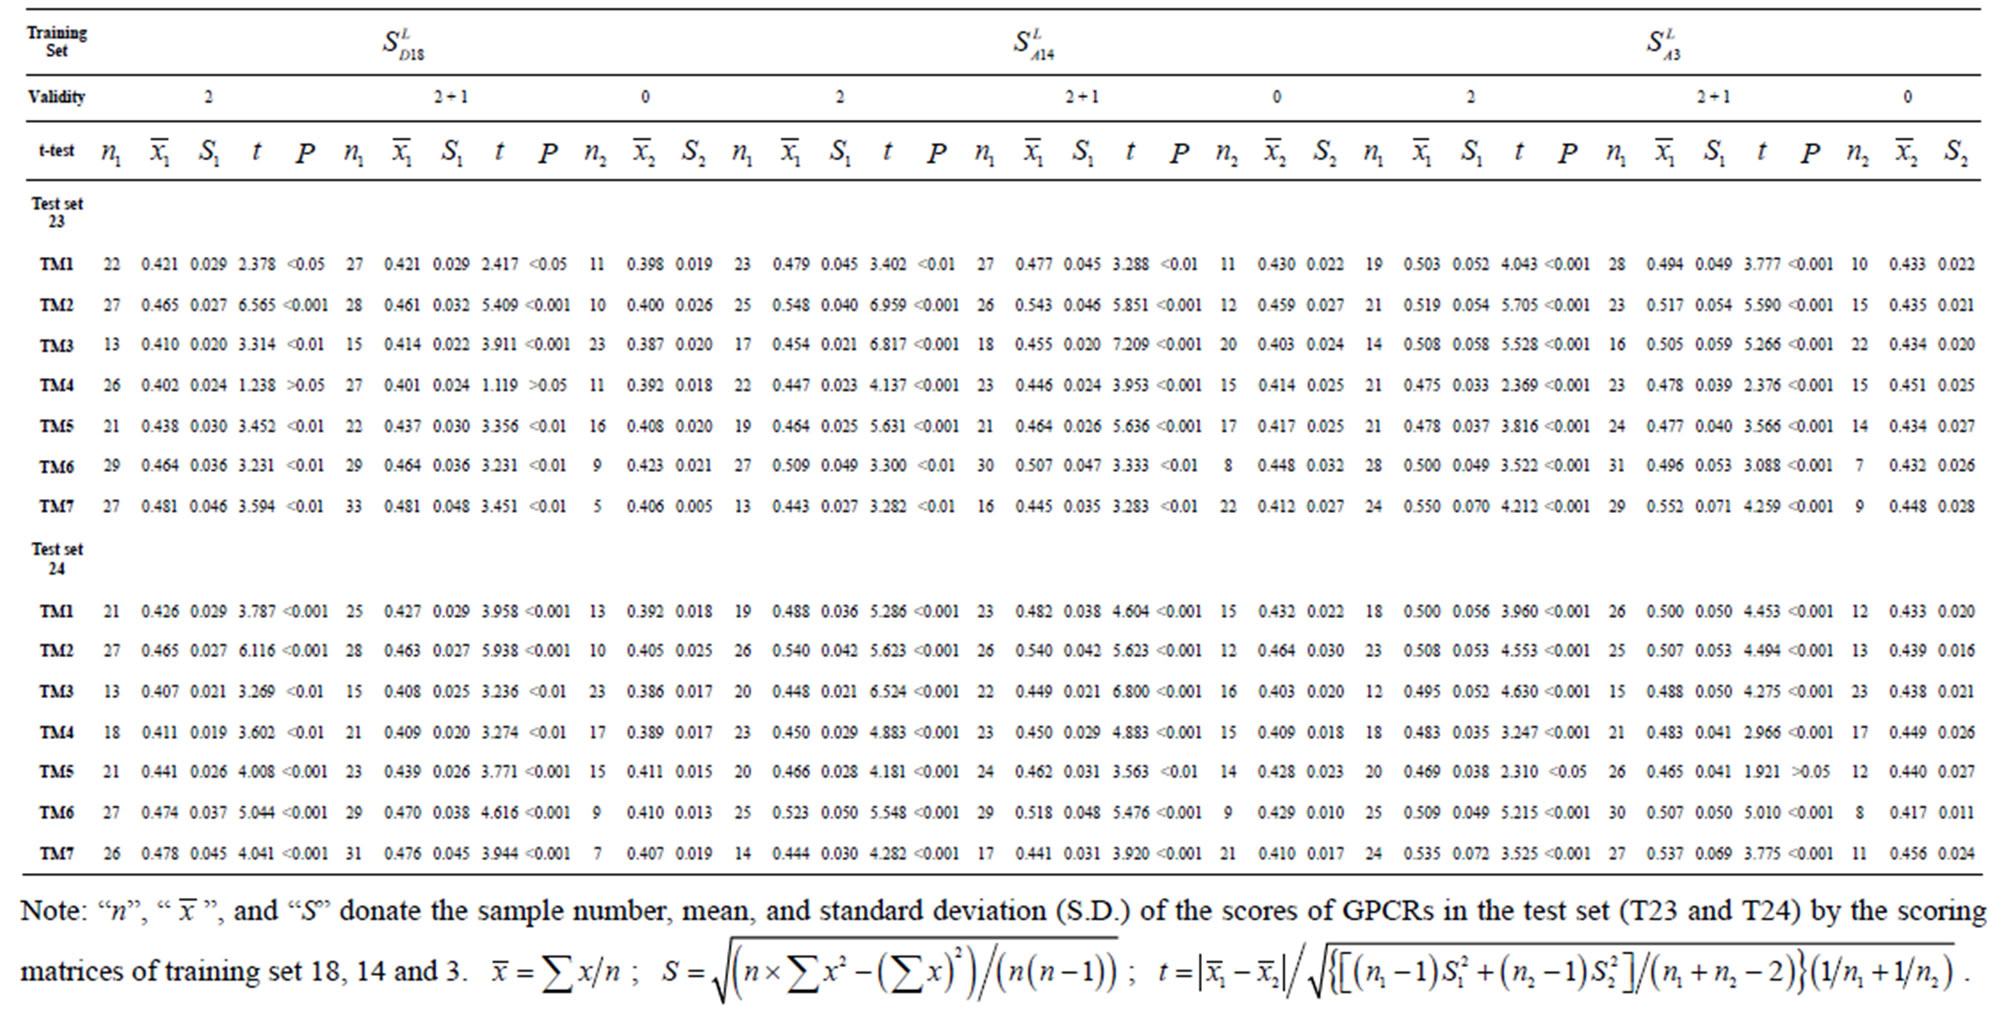
Table 6. The t-test results based on the scores and the validity of GPCRs in test sets by training set 18, 14 and 3.
 (a)
(a)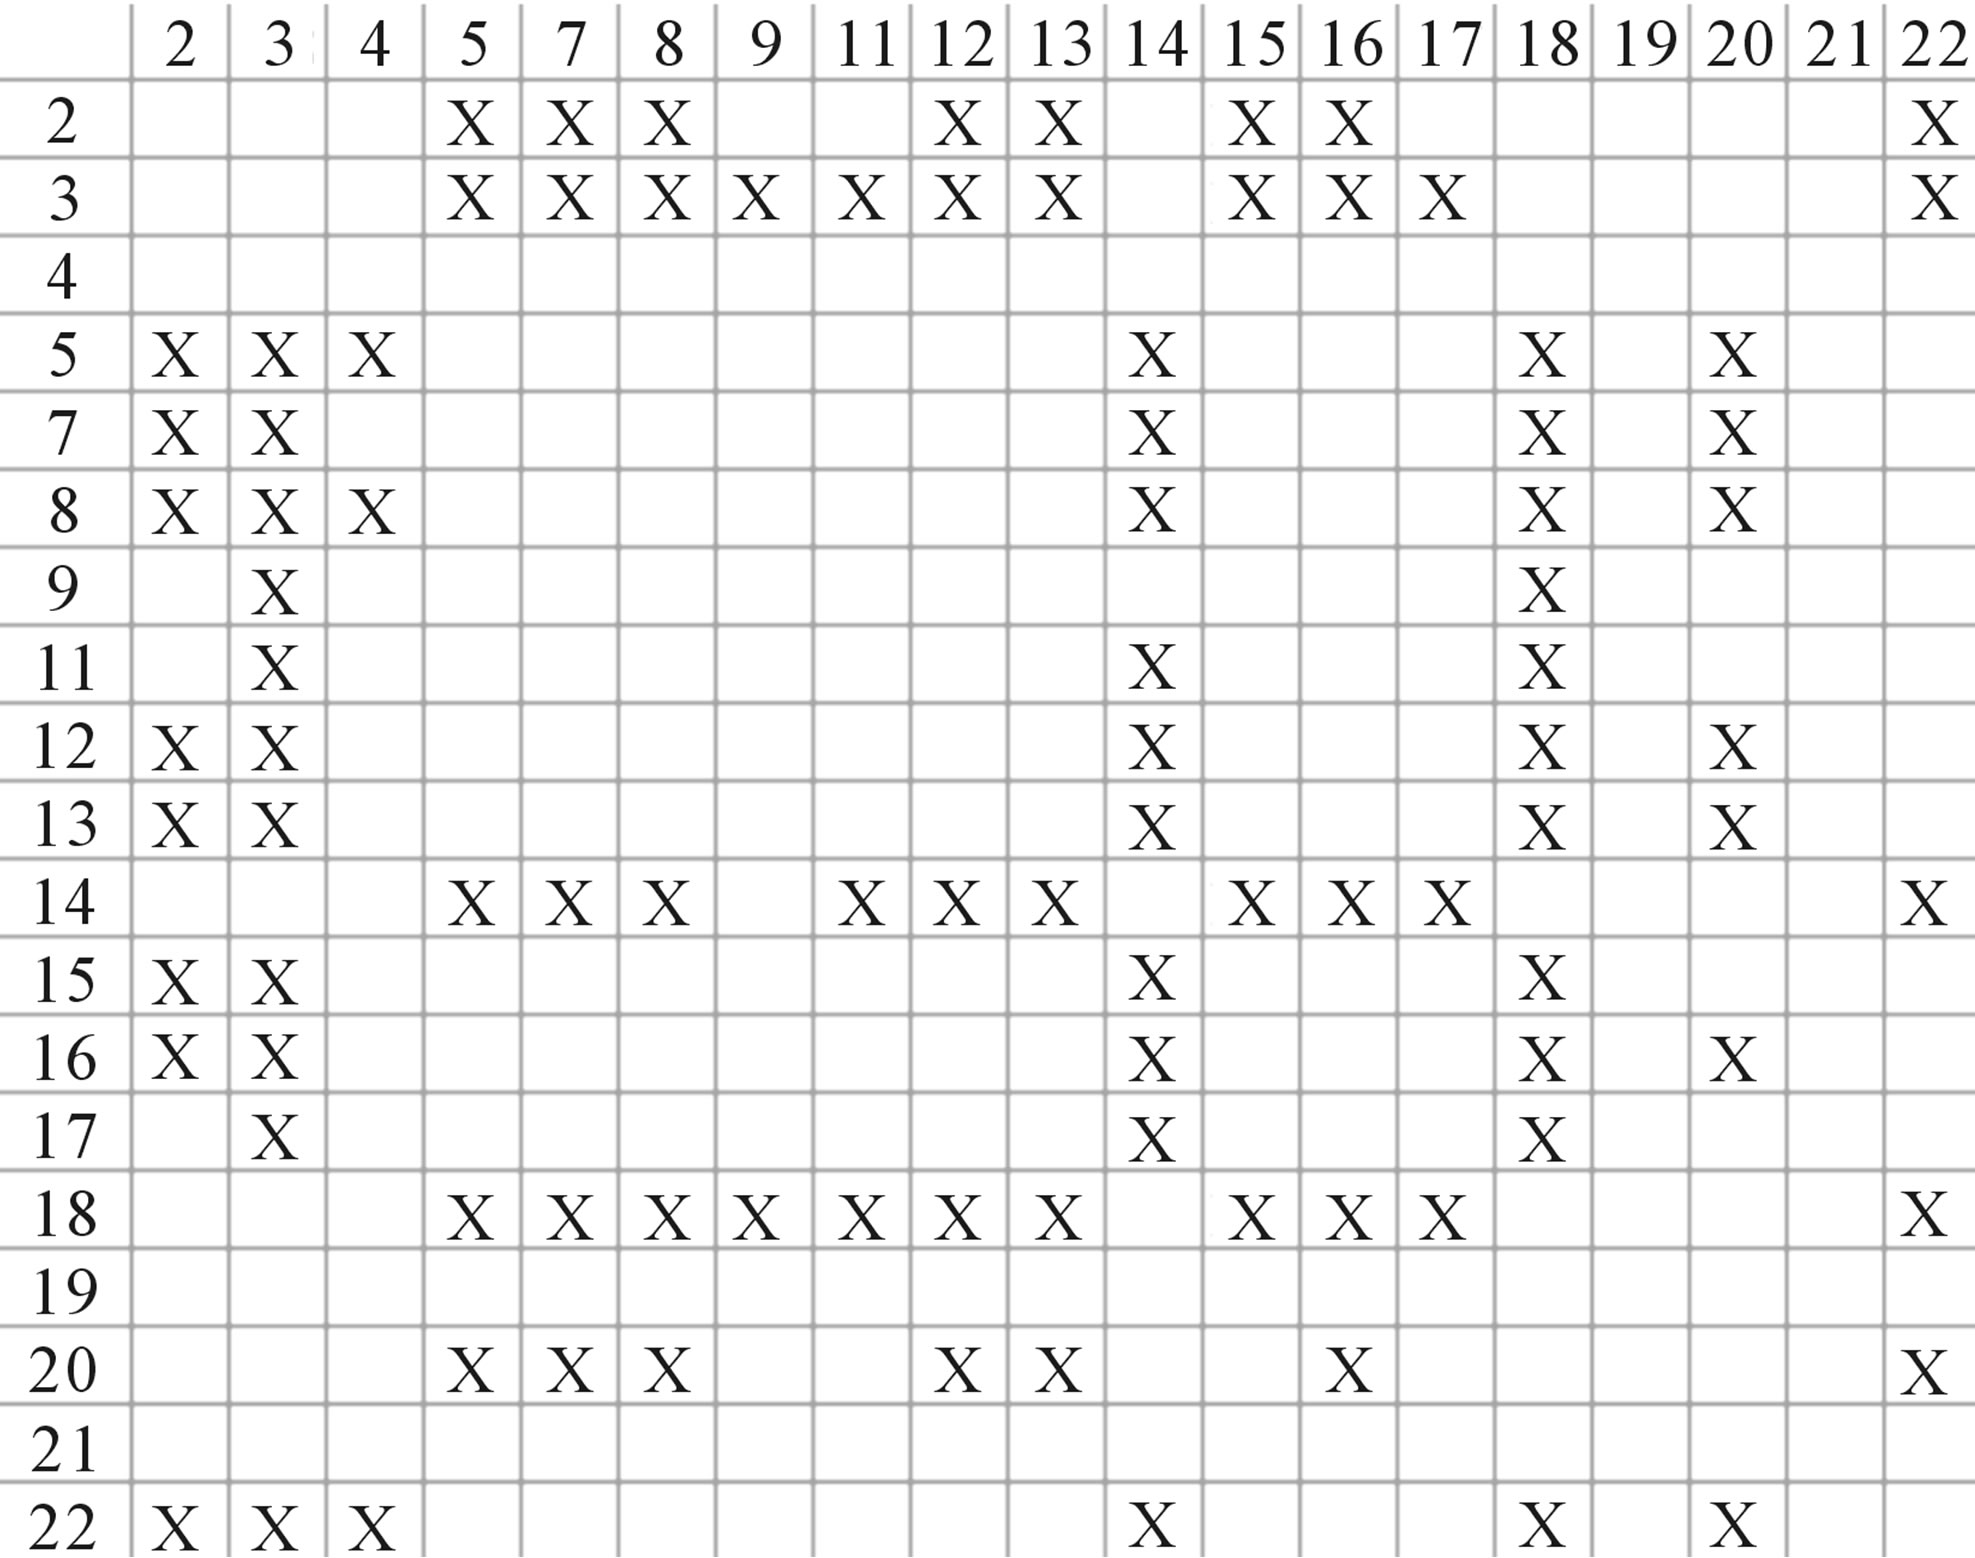 (b)
(b)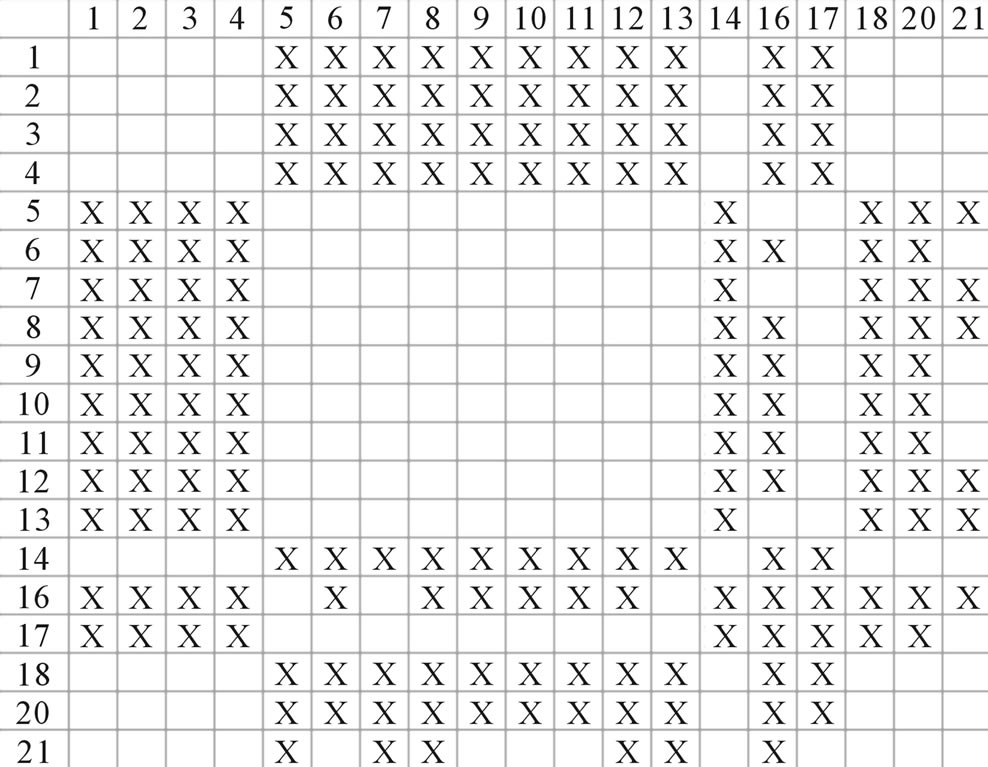 (c)
(c)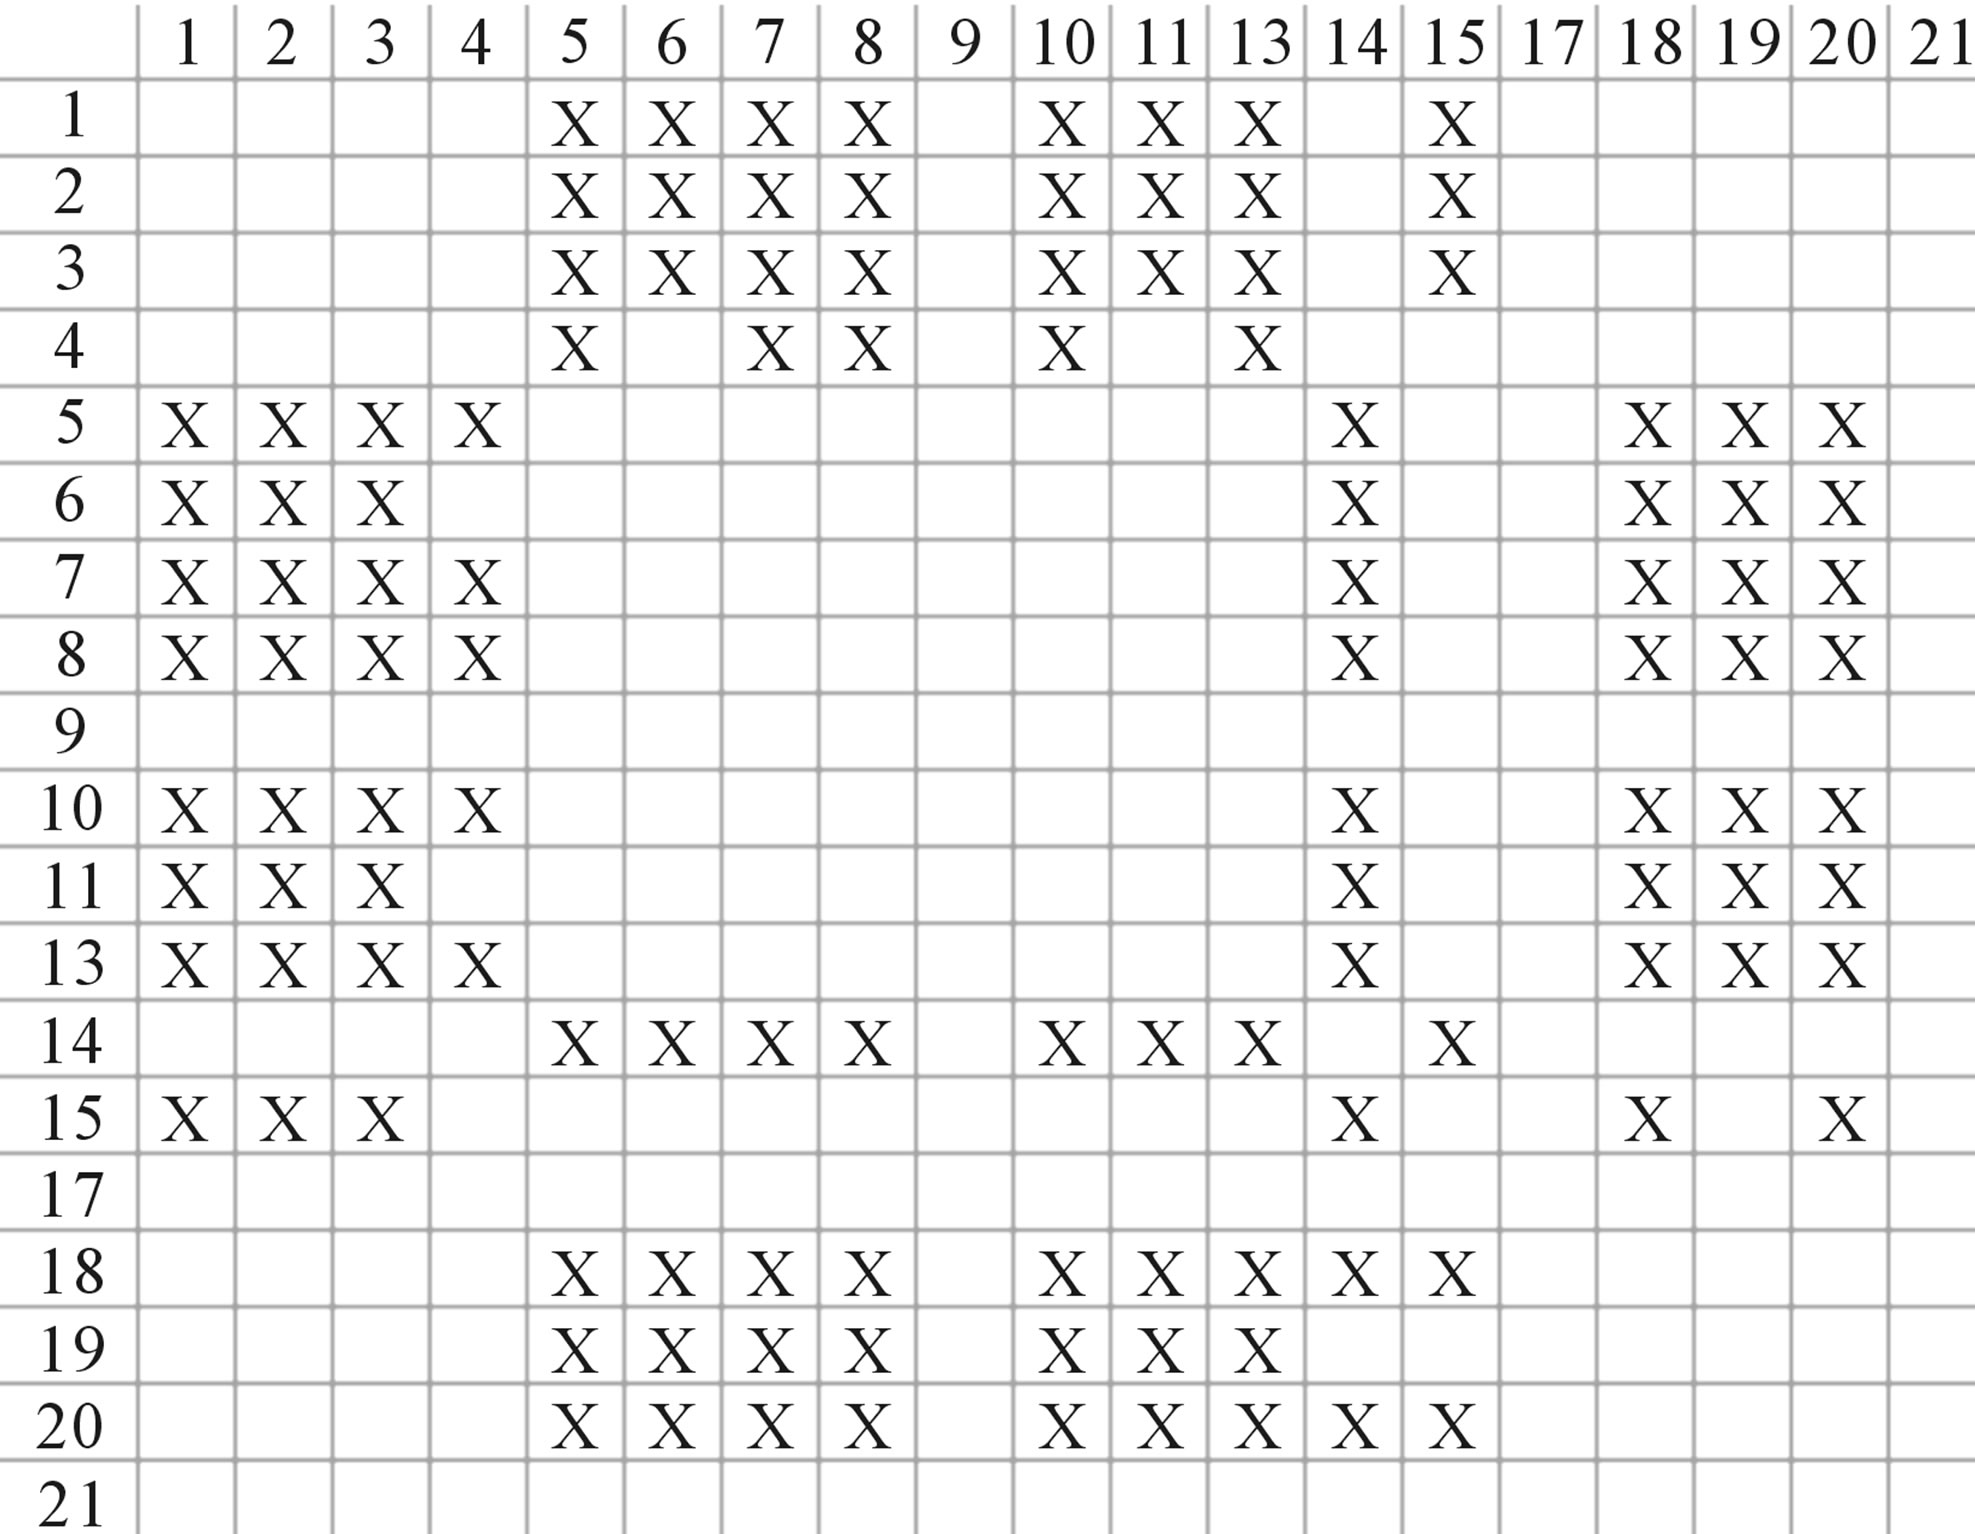 (d)
(d)
Figure 4. The results of multiple comparisons, where “X” shows there are significant differences (at the significant level of 0.05) between the two examinations indicated by corresponding column and line. (a) 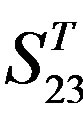 -“2”; (b)
  -“1 + 2”; (c)
  -“2”; and (d)
  -“1 + 2”.
gram of the accuracy of the coding sequences of GPCRs’ TMs in test sets ( and
and ) by the scoring matrices of the different training datasets (
 ,
,  , and
, and ). At the complete consistent “2” state, the accuracy of TM1, TM2, TM5, TM6 and TM7 of GPCRs in
  by
by  are higher than others, while that of TM3 and TM4 by
  are higher than others; the accuracy of TM2, TM4, TM5, TM6 and TM7 of GPCRs in
  by
by  are higher than others while that of TM1 and TM3 by
  are higher than others. At the crossover “2 + 1” state, the accuracy of TM2 and TM7 of GPCRs in
  and
and  by
by  are higher; that of TM1, TM5, and TM6 of GPCRs in
  and
and  by
by  are higher; and that of TM3 of GPCRs in
  and
and  by
by  is higher, but that of TM4 of GPCRs in
  by
by  and in
  by A14 are higher. Moreover, the accuracy of TM1-TM7 of GPCRs in
  by
by ,
,  and
and  are higher than that of GPCRs in
 , respectively.
Considering the mean scores, the accuracy, and t-test values mentioned above, the scoring matrices of seven TMs of GPCRs is composed of the scoring matrices of TM1, TM2, TM5, TM6 and TM7 from  and those of TM3 and TM4 from
 . So we constructed a prediction model (PreMod) based on the combined scoring matrices for prediction of potential GPCR proteins and further helpful to discovery of potential drug targets belonging to GPCR families. Comparison the prediction values of two test sets using PreMod (Table 7) with those of other models (
 ,
, and
and ) (Table 3) reveals that the prediction seven TMs’ accuracy of the former is more than the latter’s whereas the hit rate of the former (94.74% and 97.37%) is less than that of
  (100%) but bigger than that of
  and
and  (Table 8). This is the reason that we choose PreMod to predict
 (a)
(a)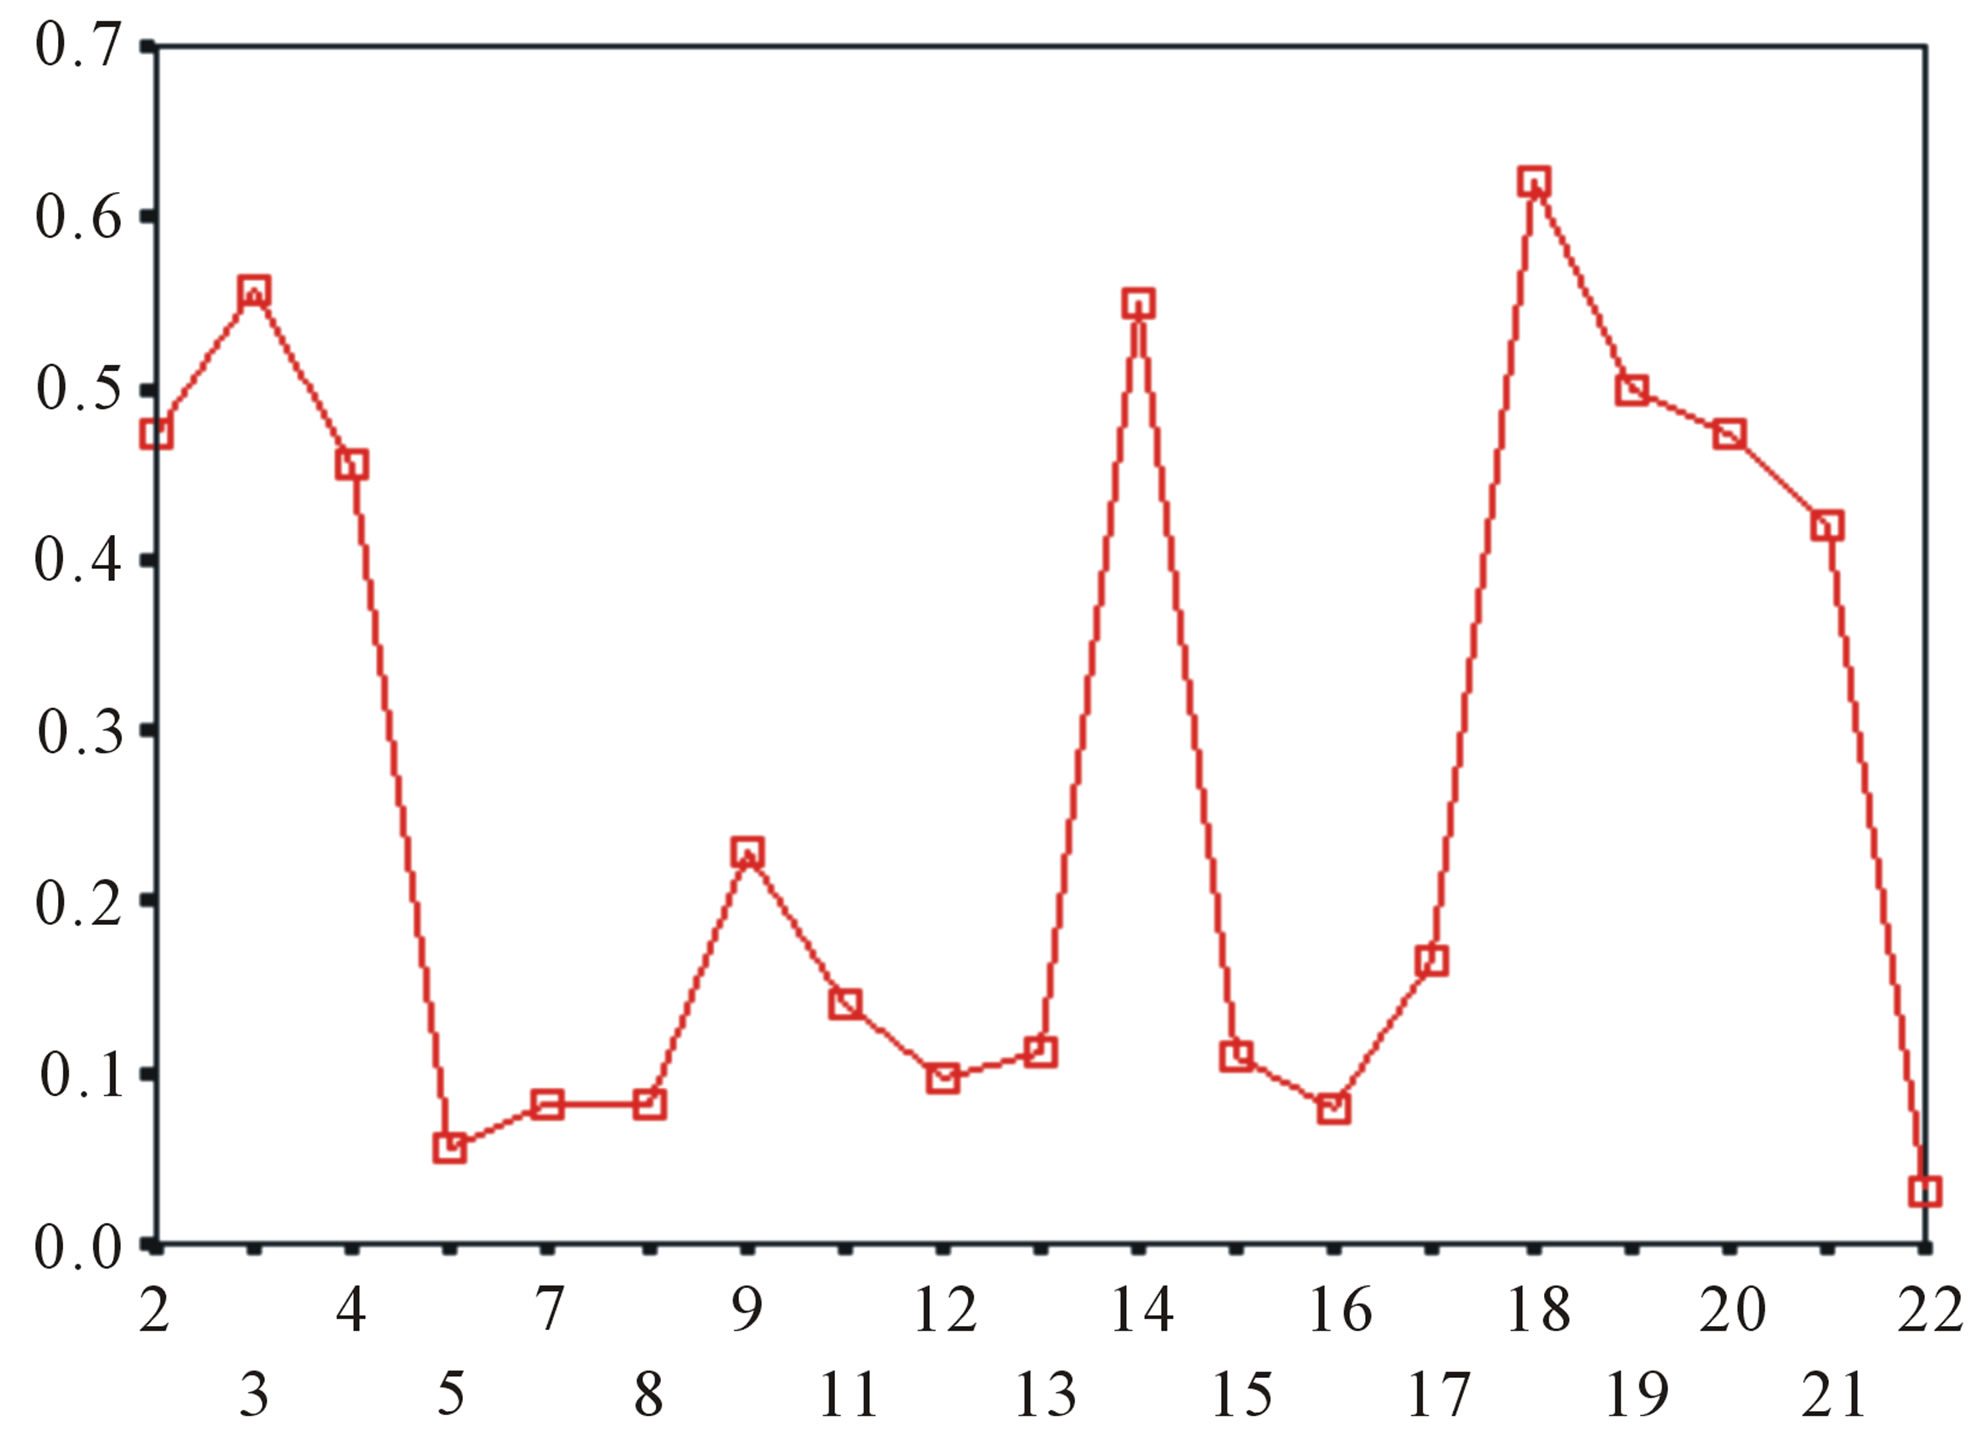 (b)
(b)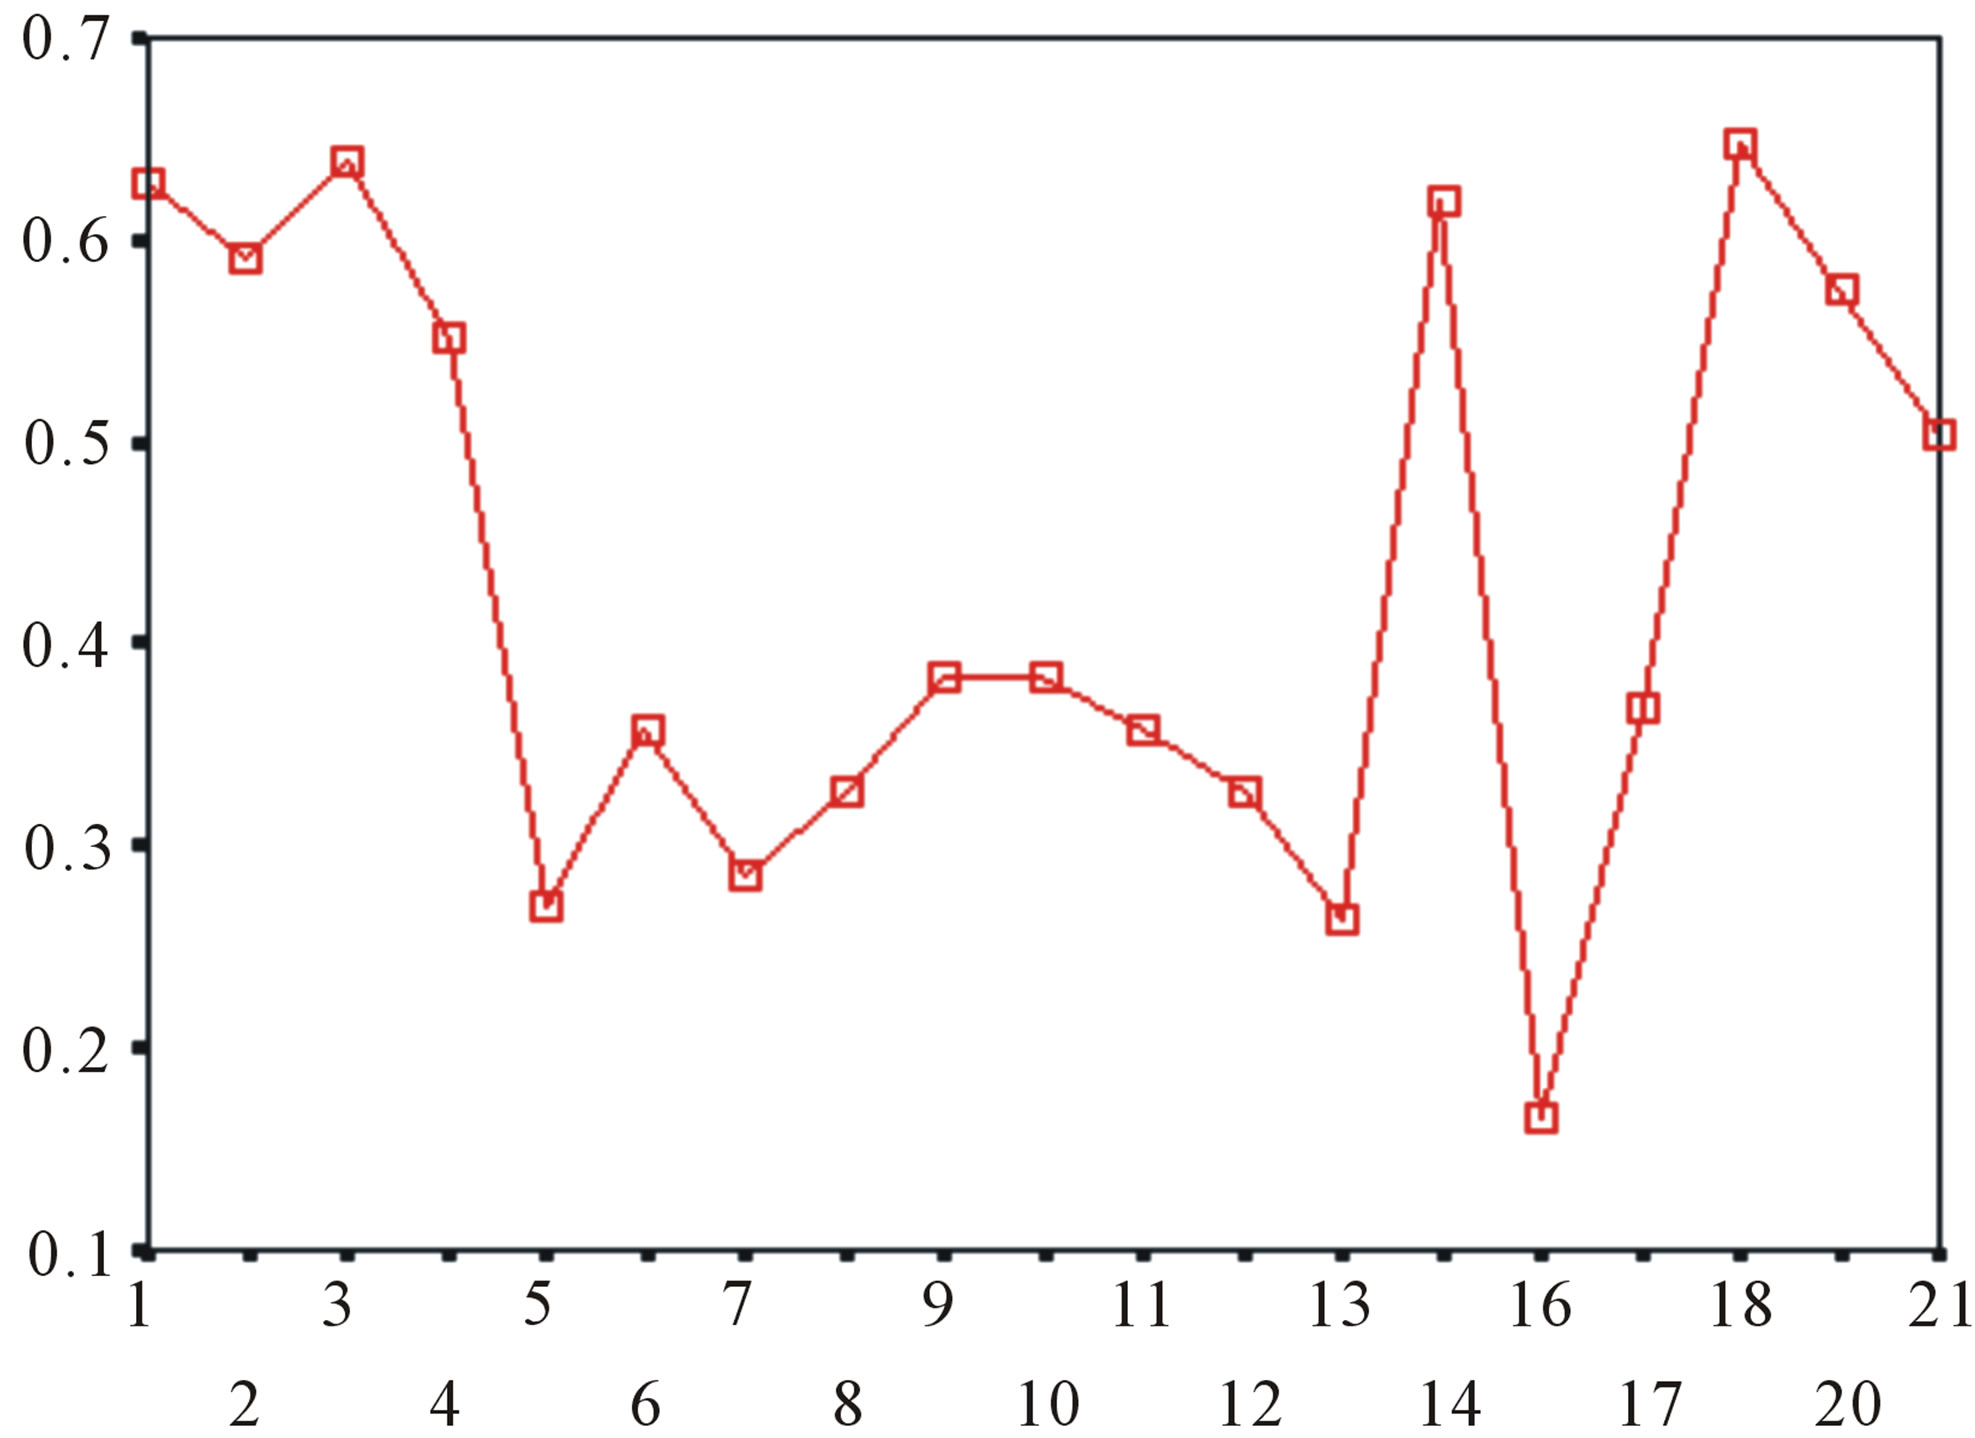 (c)
(c)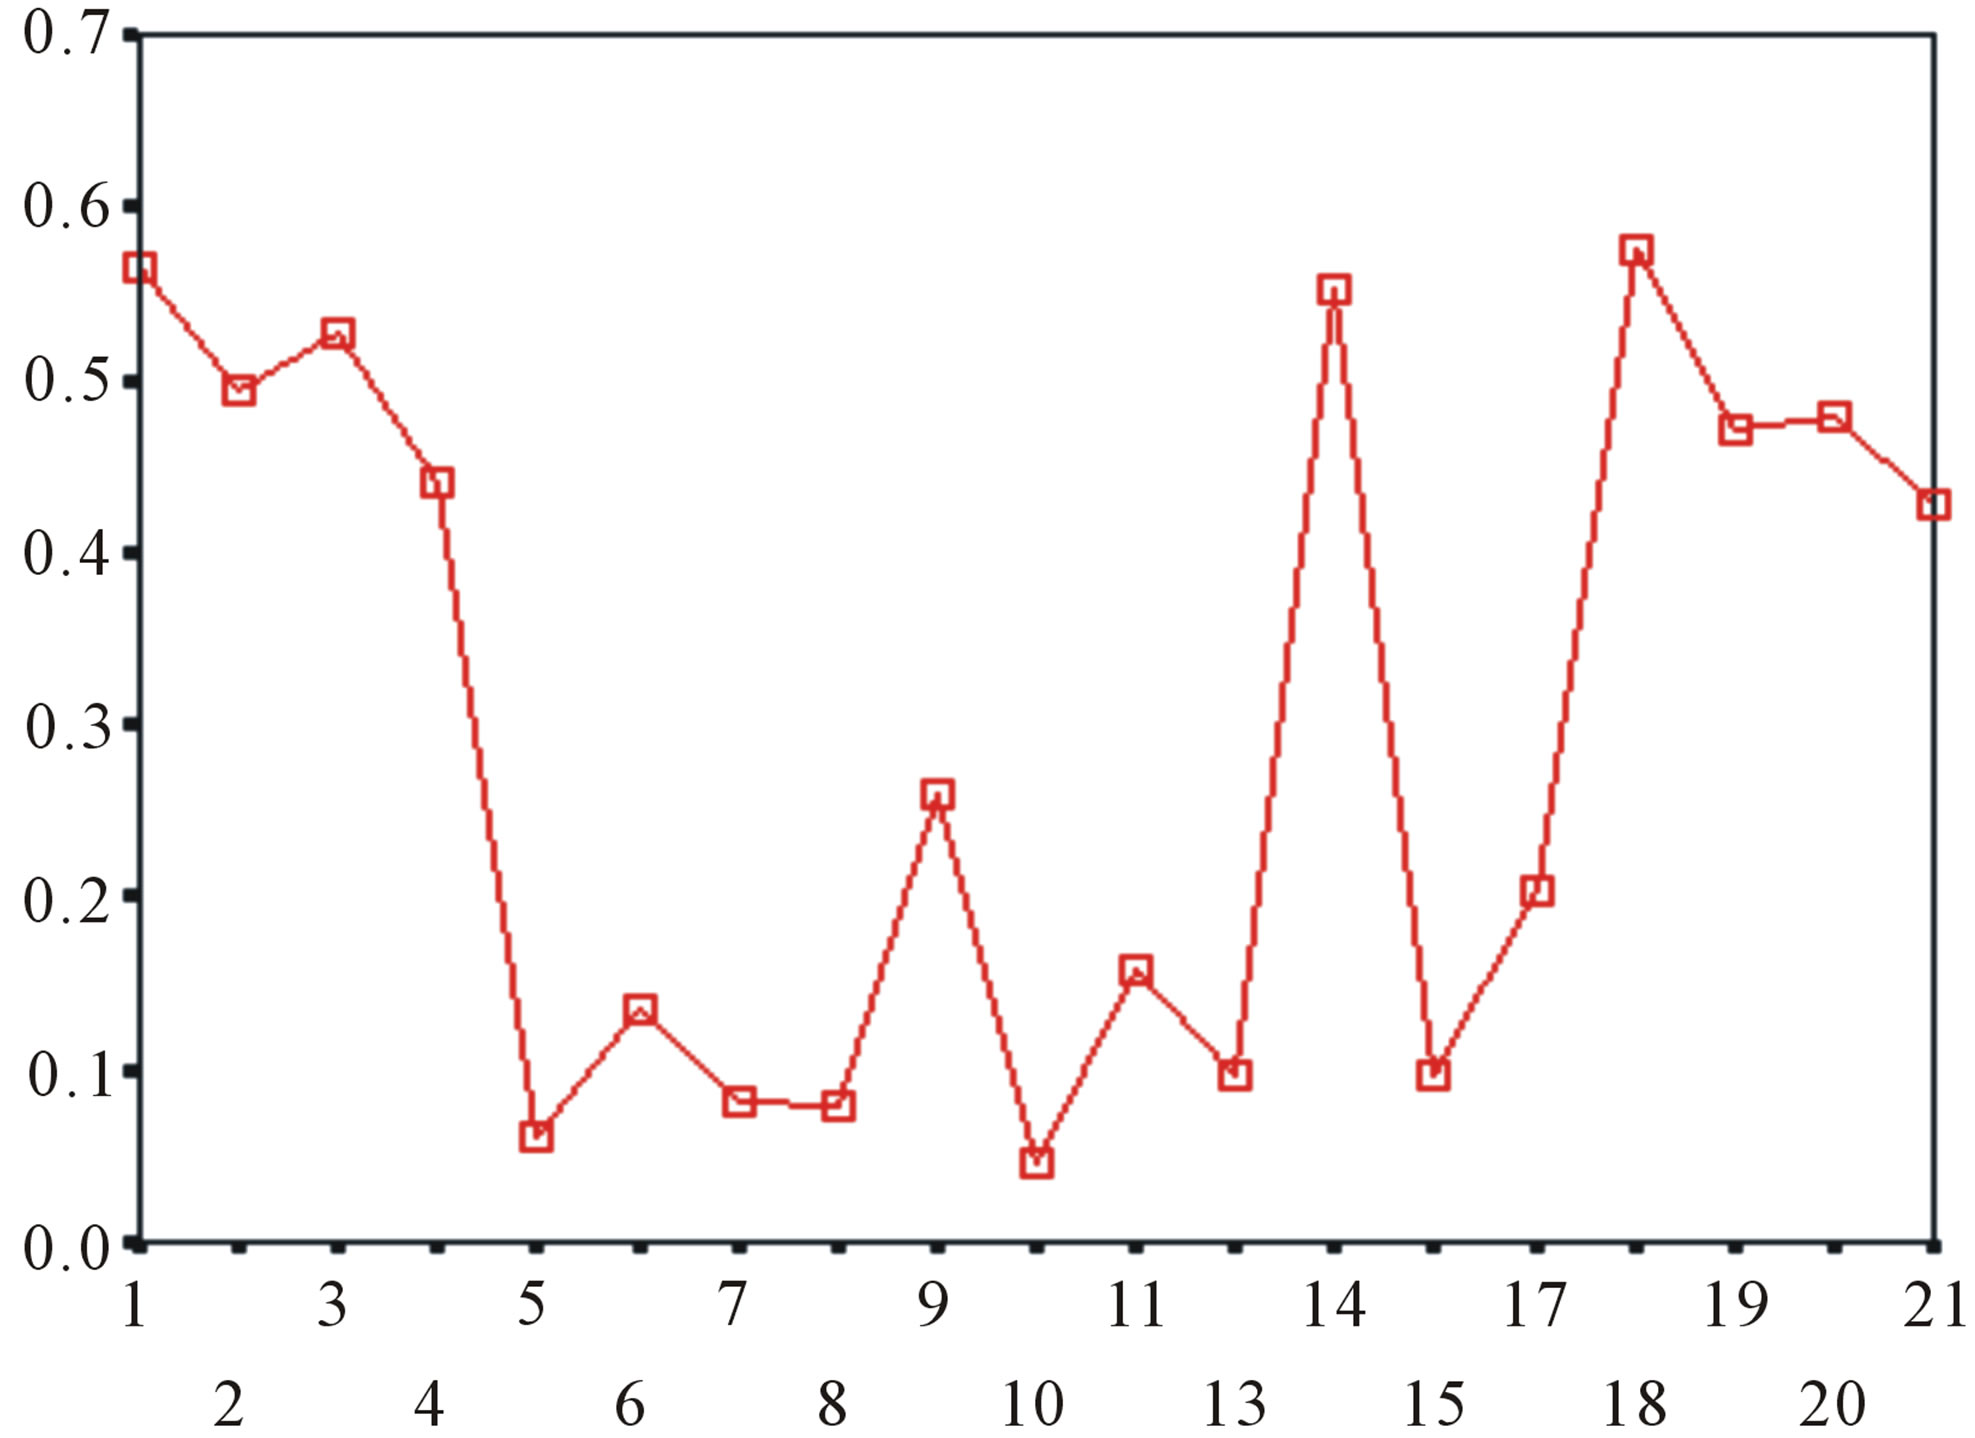 (d)
(d)
Figure 5. The plot of the averages of validity of prediction each training set (examinations of each category) by two test sets ( and
and ), where X-coordinate and Y-coordinate axes means examinations and the averages of validity of prediction, respectively. (a)
  - “2”; (b)
  -“1 + 2”; (c)
  -“2”; and (d)
  -“1 + 2”.
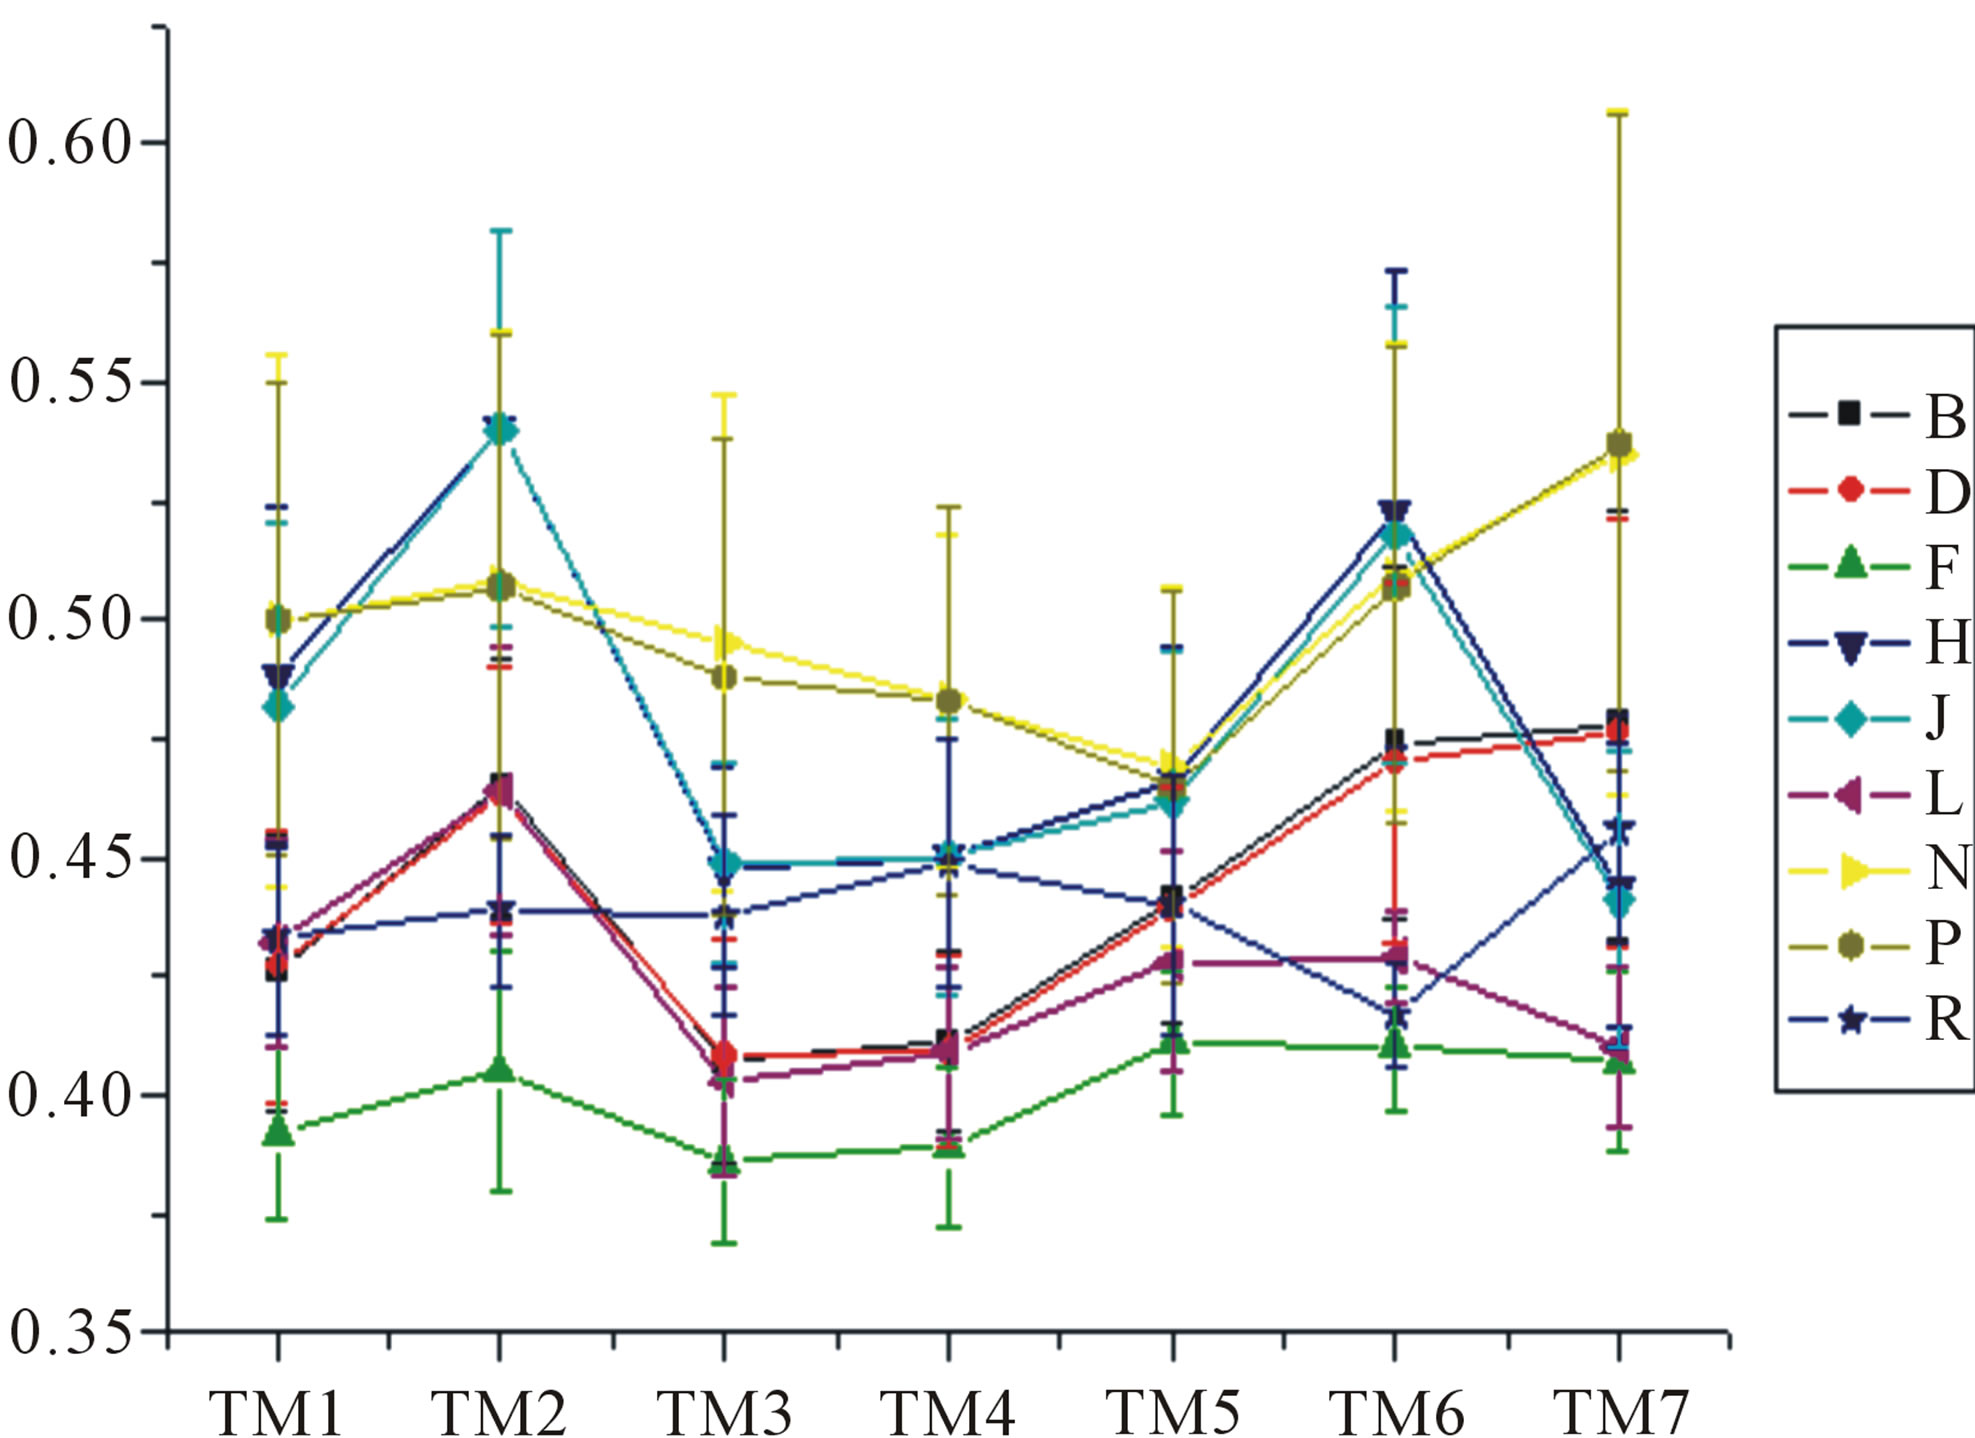
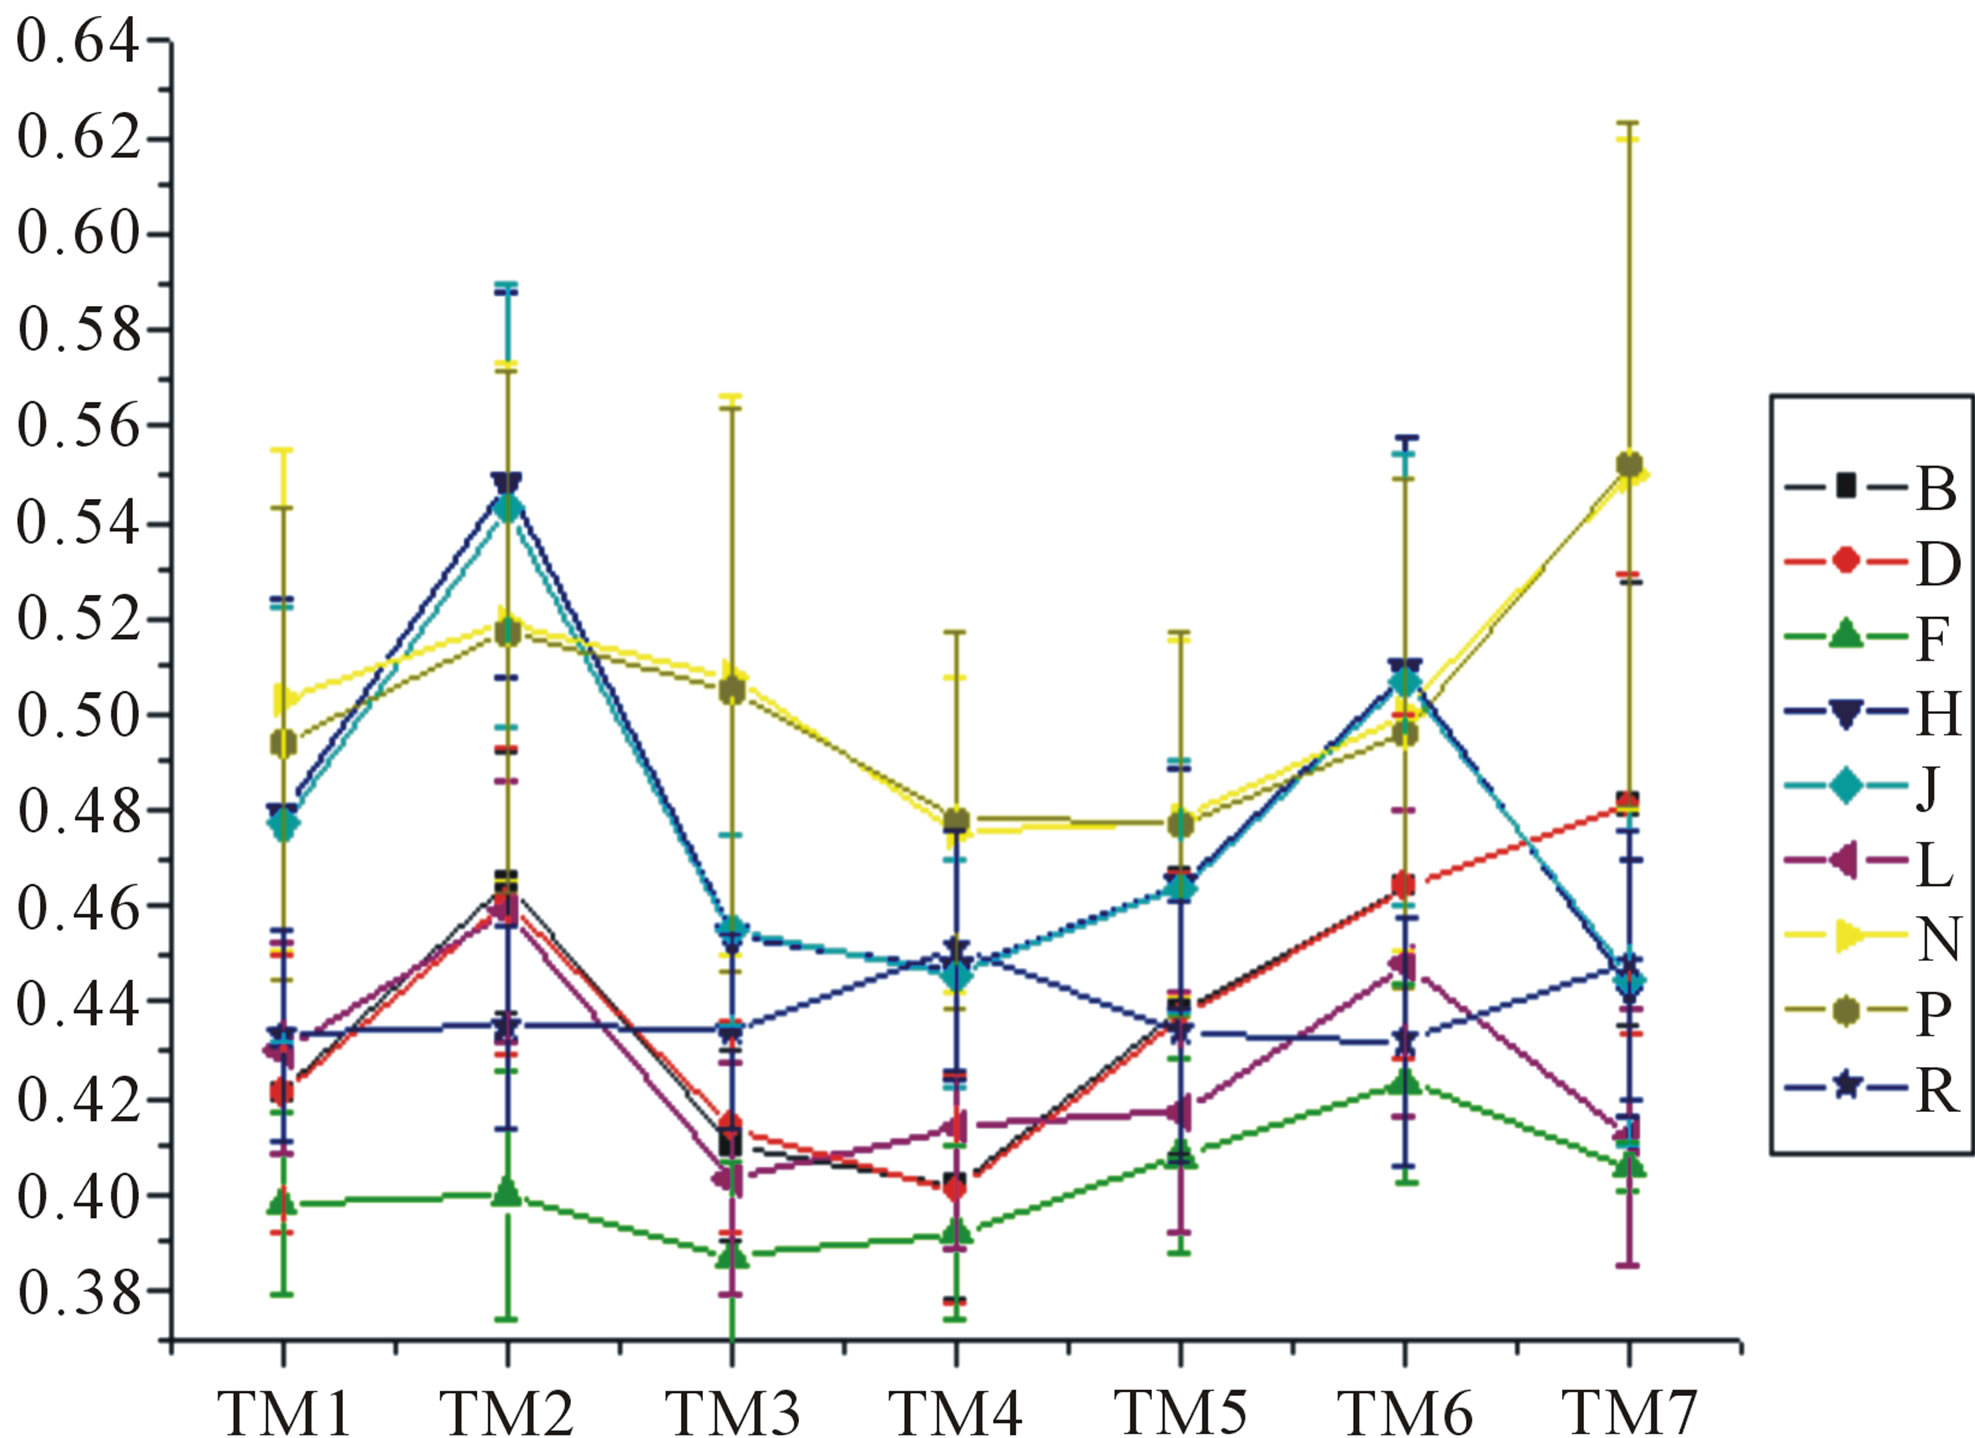
Figure 6. The mean score of the coding sequences of GPCRs’ 7 TMs in test sets (T23 and T24) by the scoring matrices of the different training datasets (D18, A14, and A3). Upper: T23; Lower: T24. Here, B, D, and F lines express D18; H, J, and L, A14; and N, P, and R, A3. B, H, and N means “2”; D, J, and P, “2 + 1”; and F, L, and R, “0”.
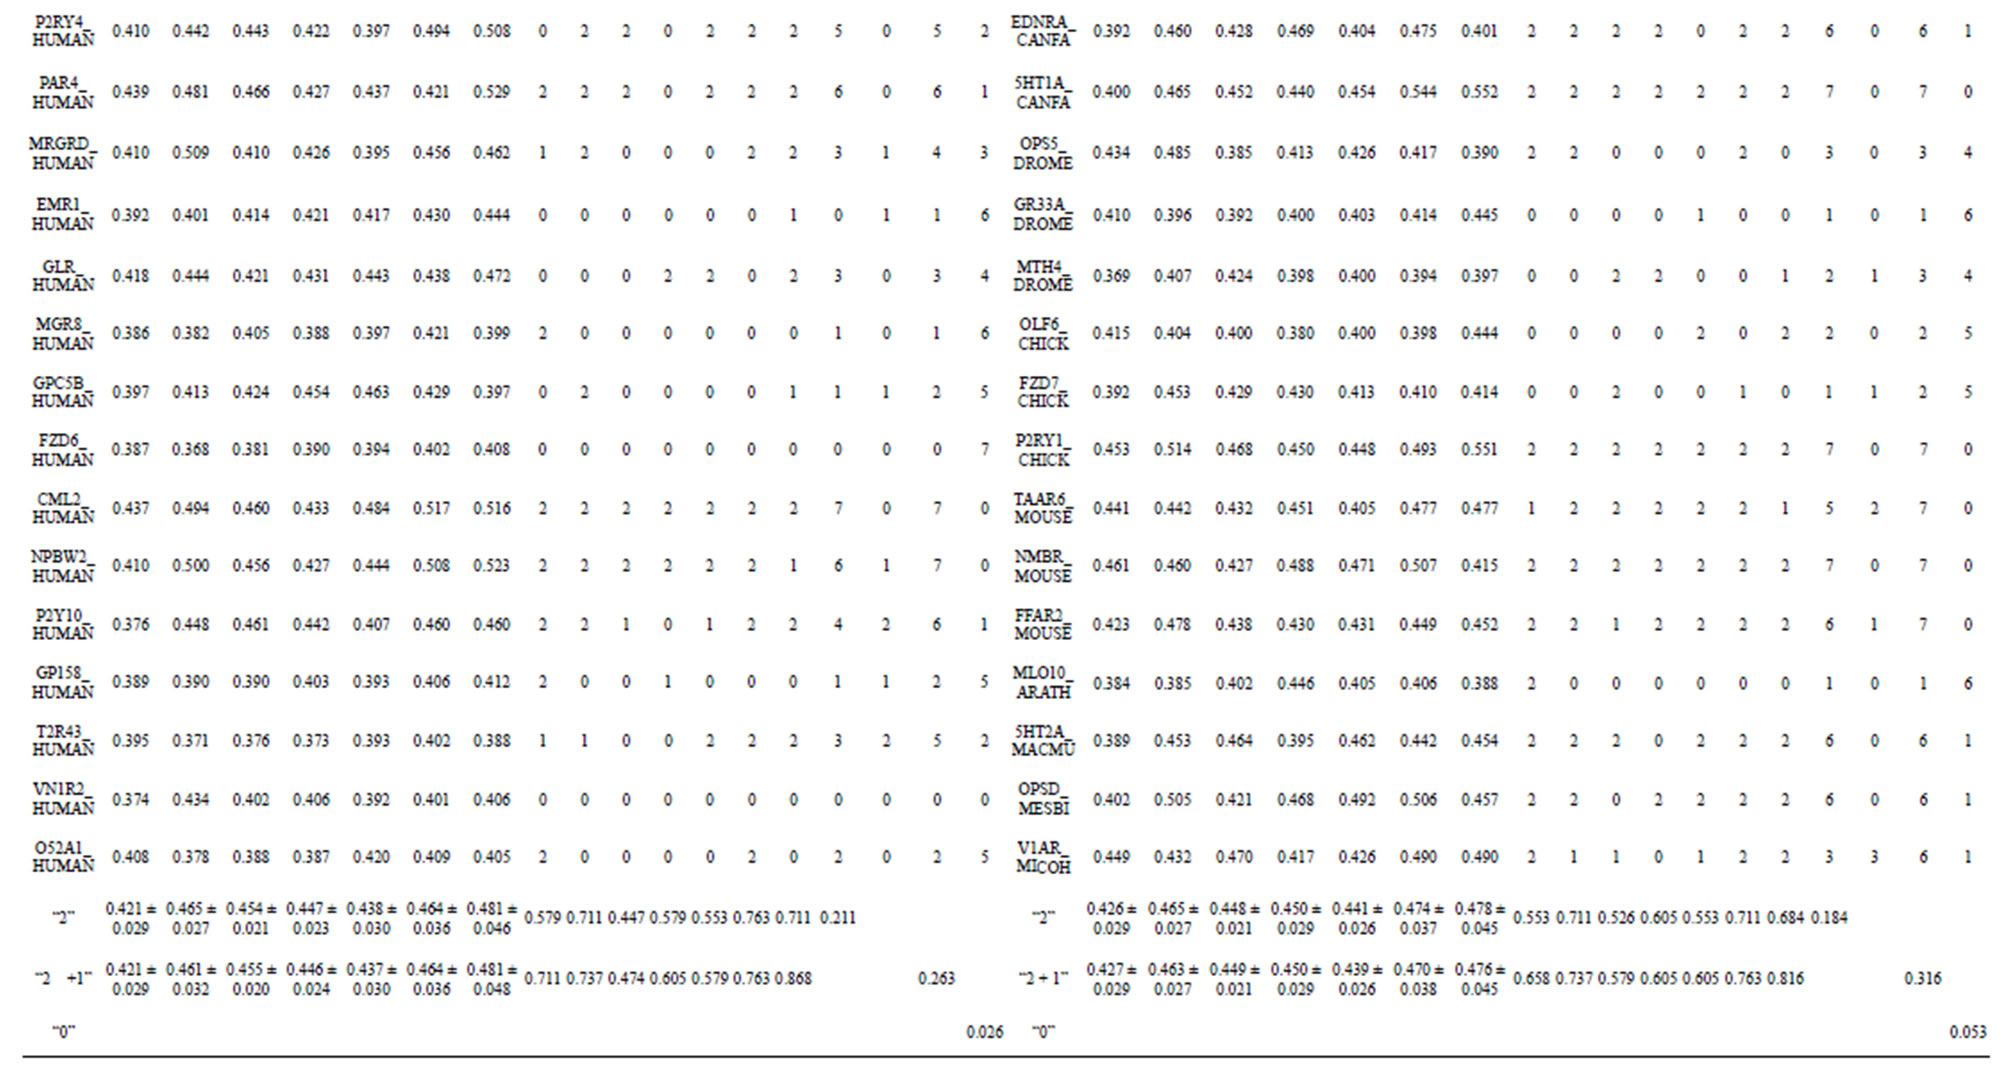
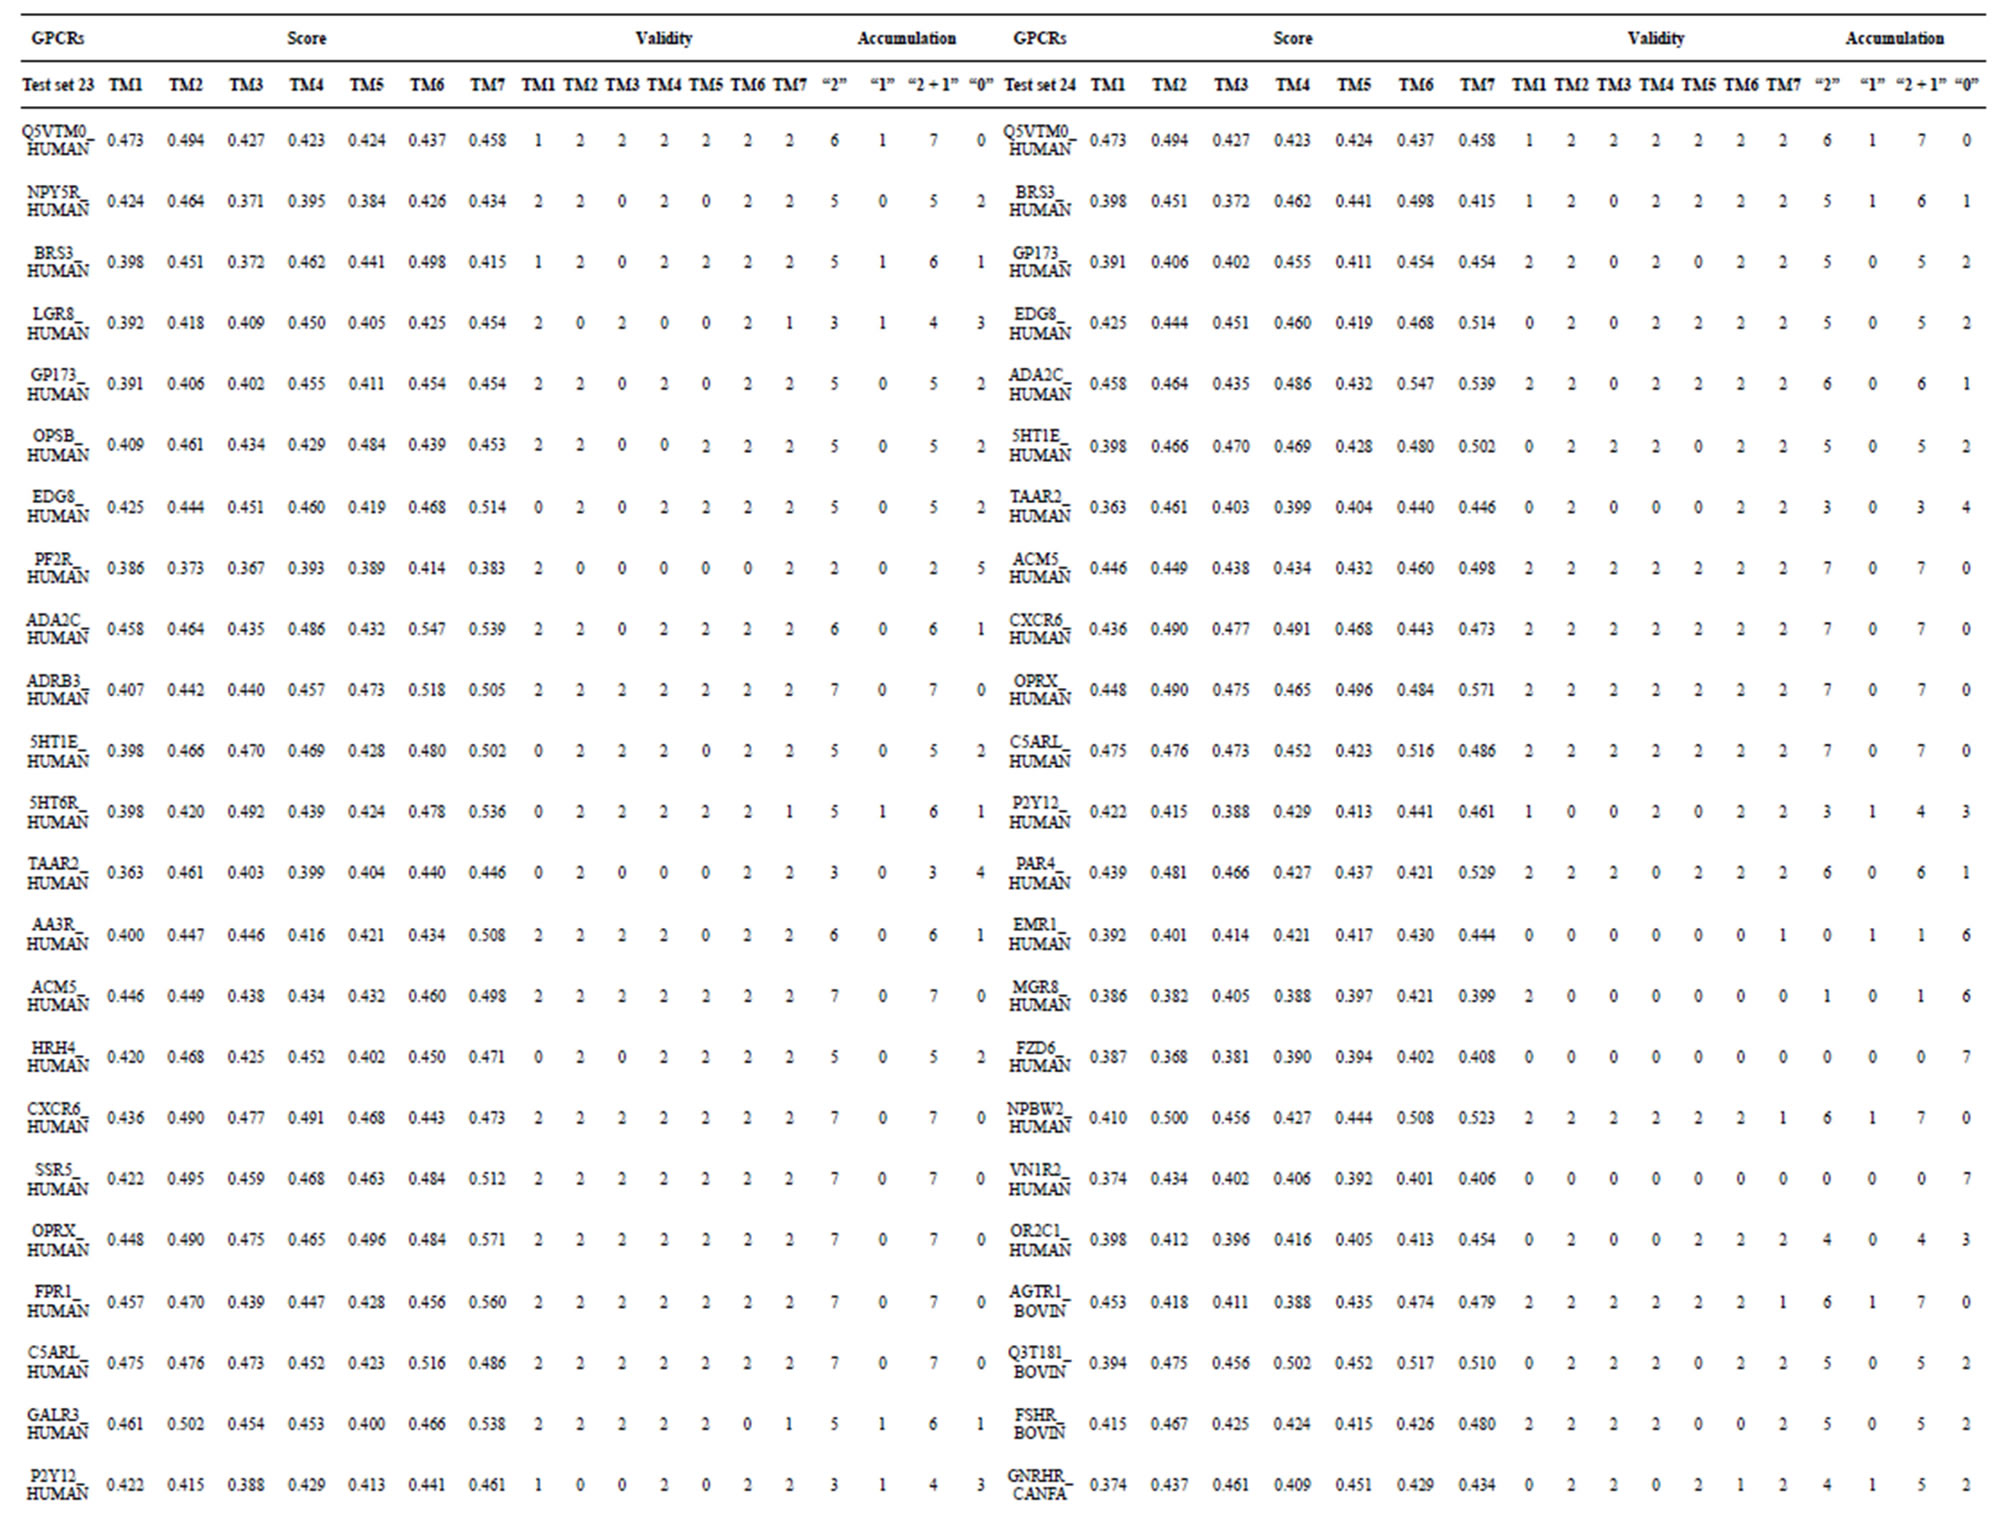
Table 7. The score and the validity of the coding sequences of GPCRs’ each trans-membrane segment in test sets by the scoring matrices of PreMod.
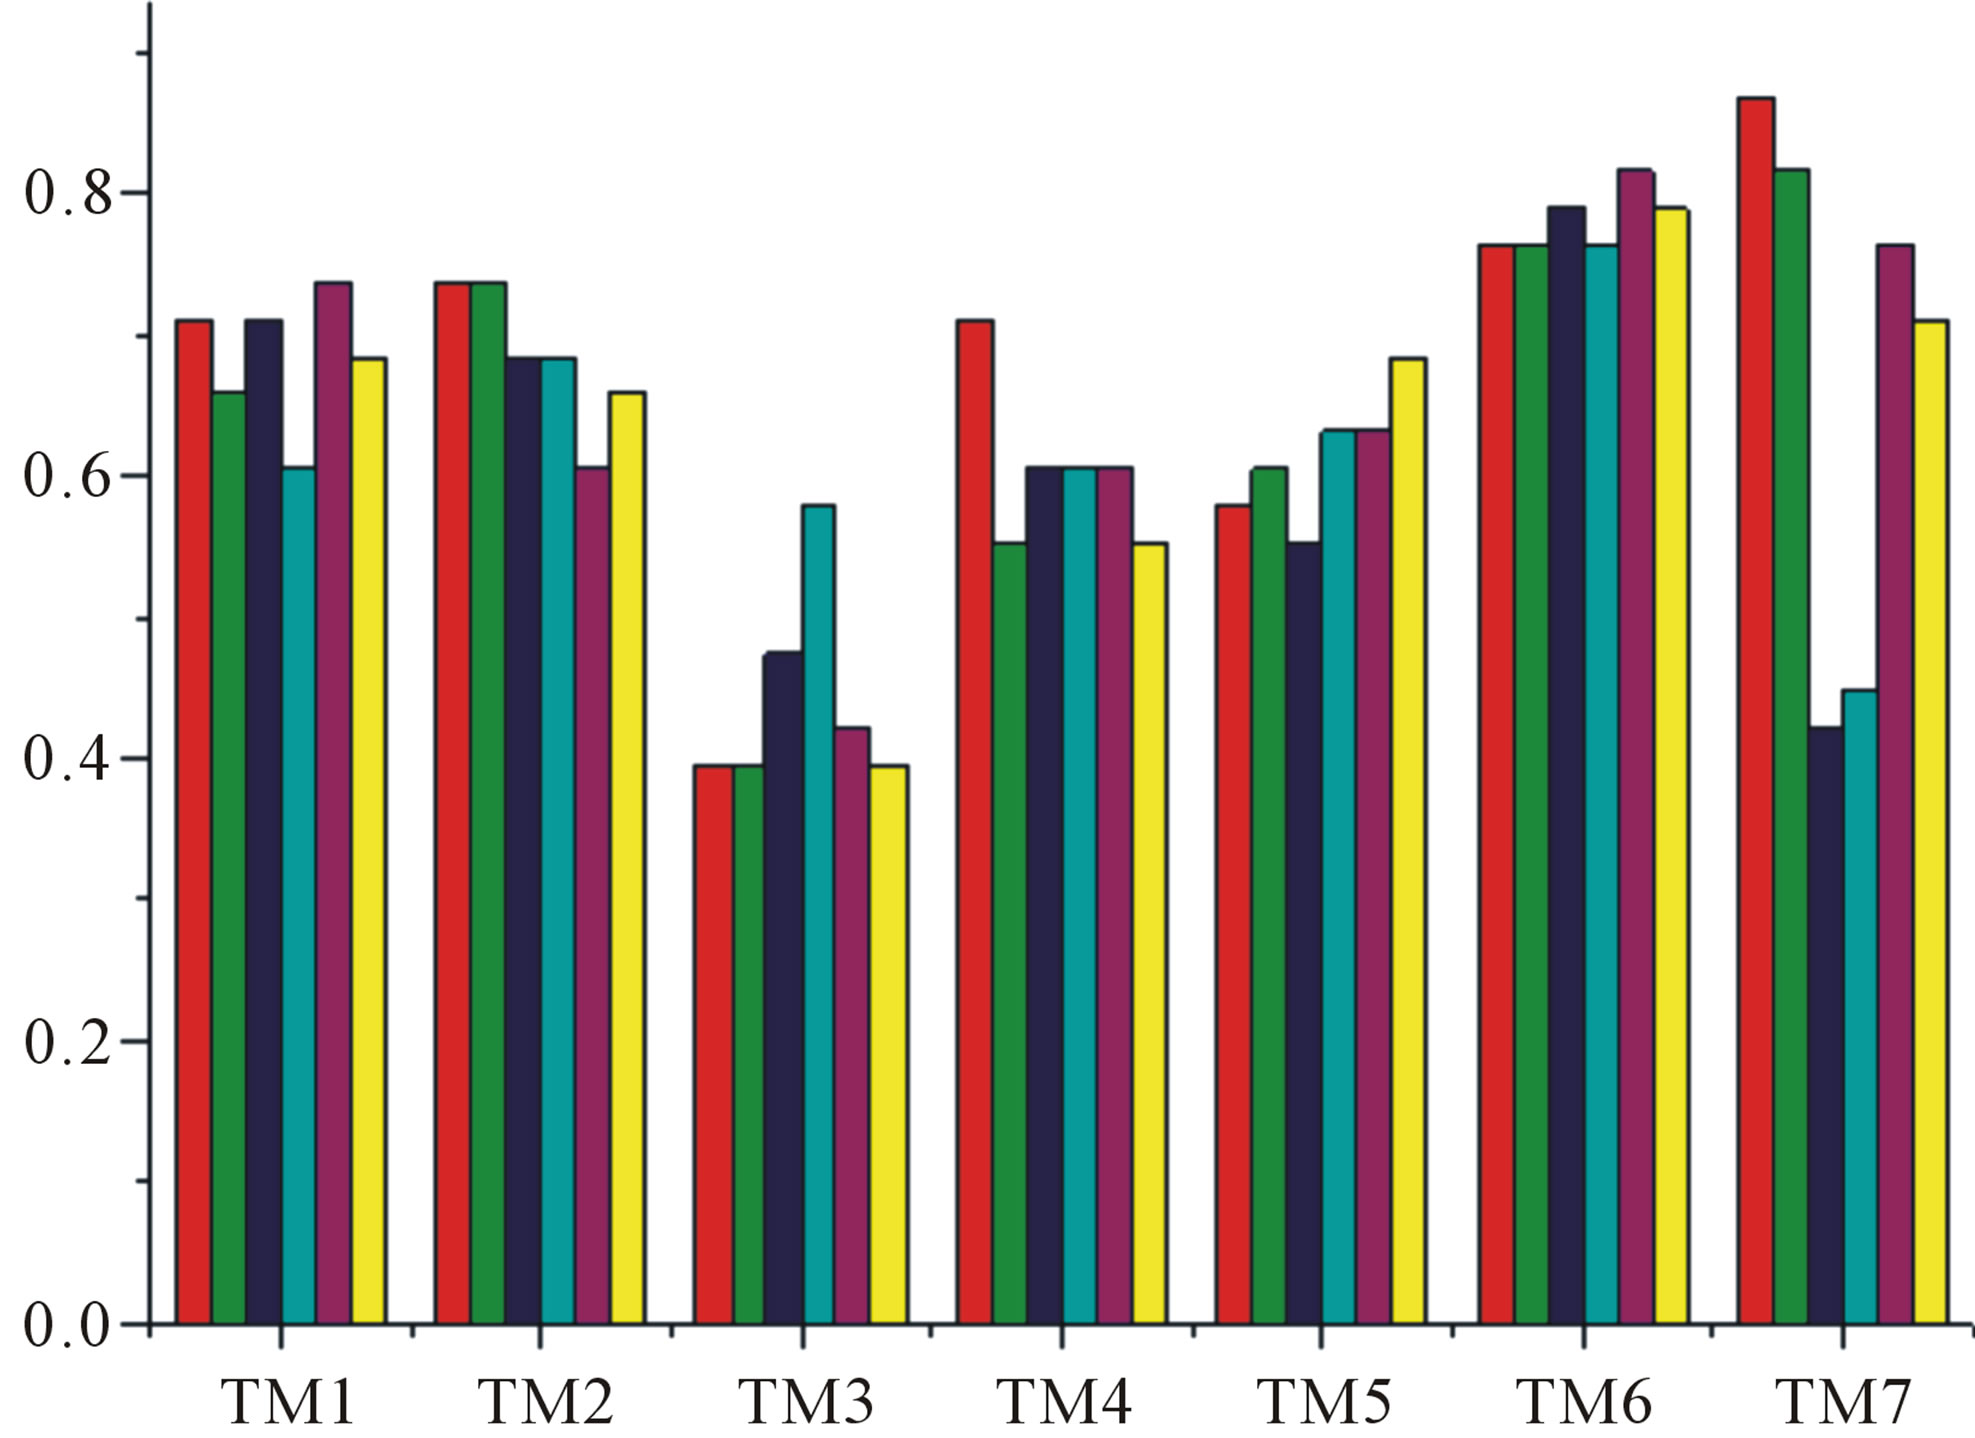
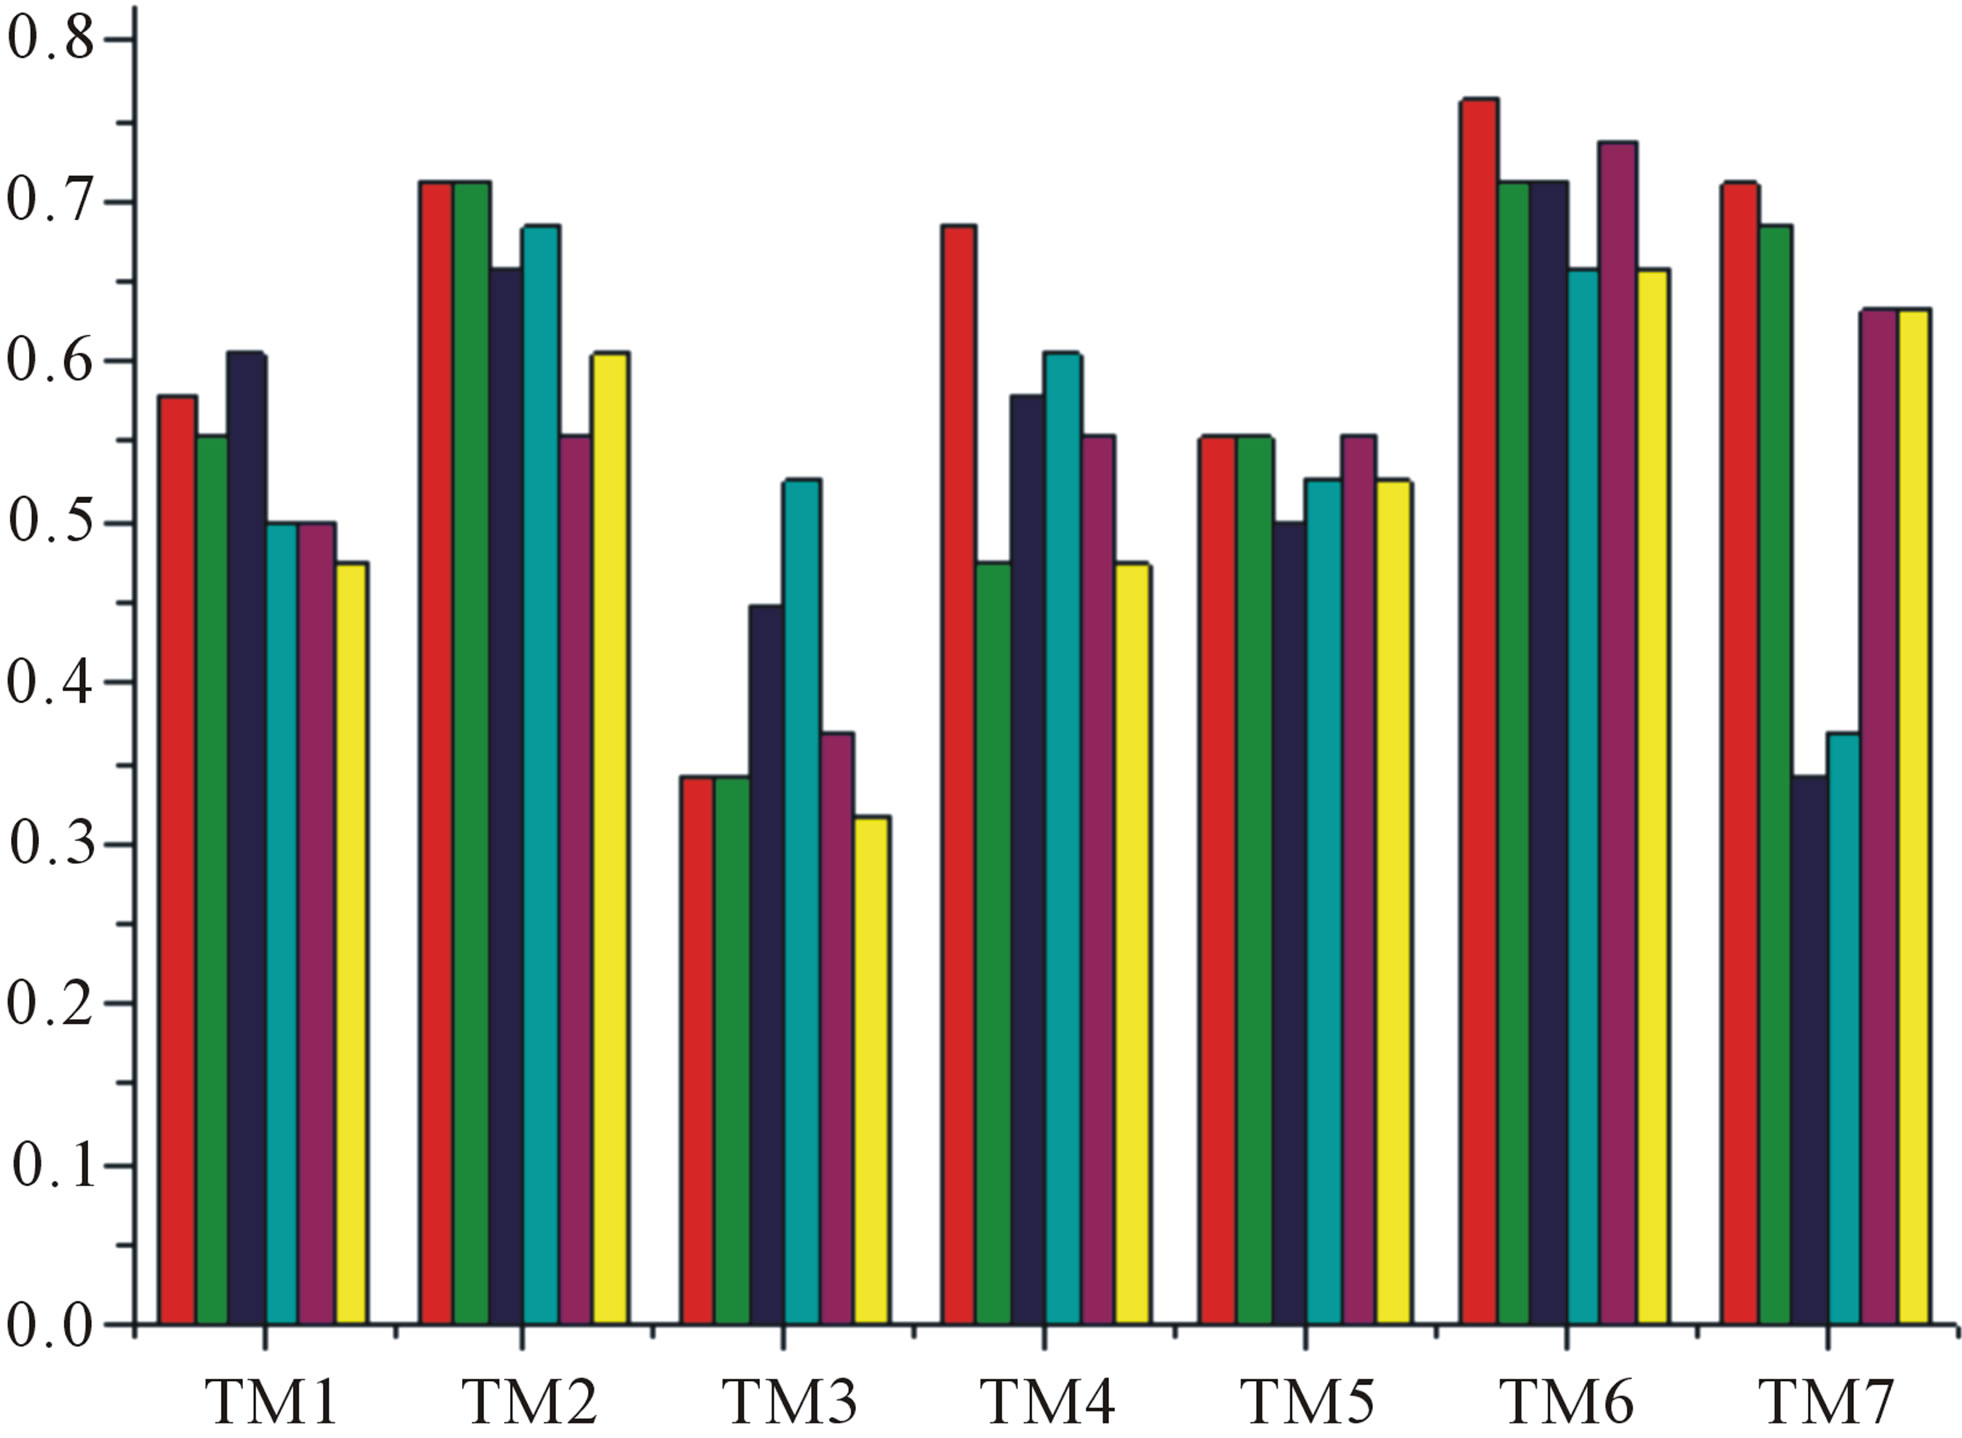
Figure 7. The accuracy of the coding sequences of GPCRs’ TMs in test sets by the scoring matrices of the different training datasets. Left: “2”; Right: “2 + 1”. Here, red and green poles display D18; blue and cyan, A14; and magenta and yellow, A3. Red, Blue, and magenta mean T23 while the rest do T24.
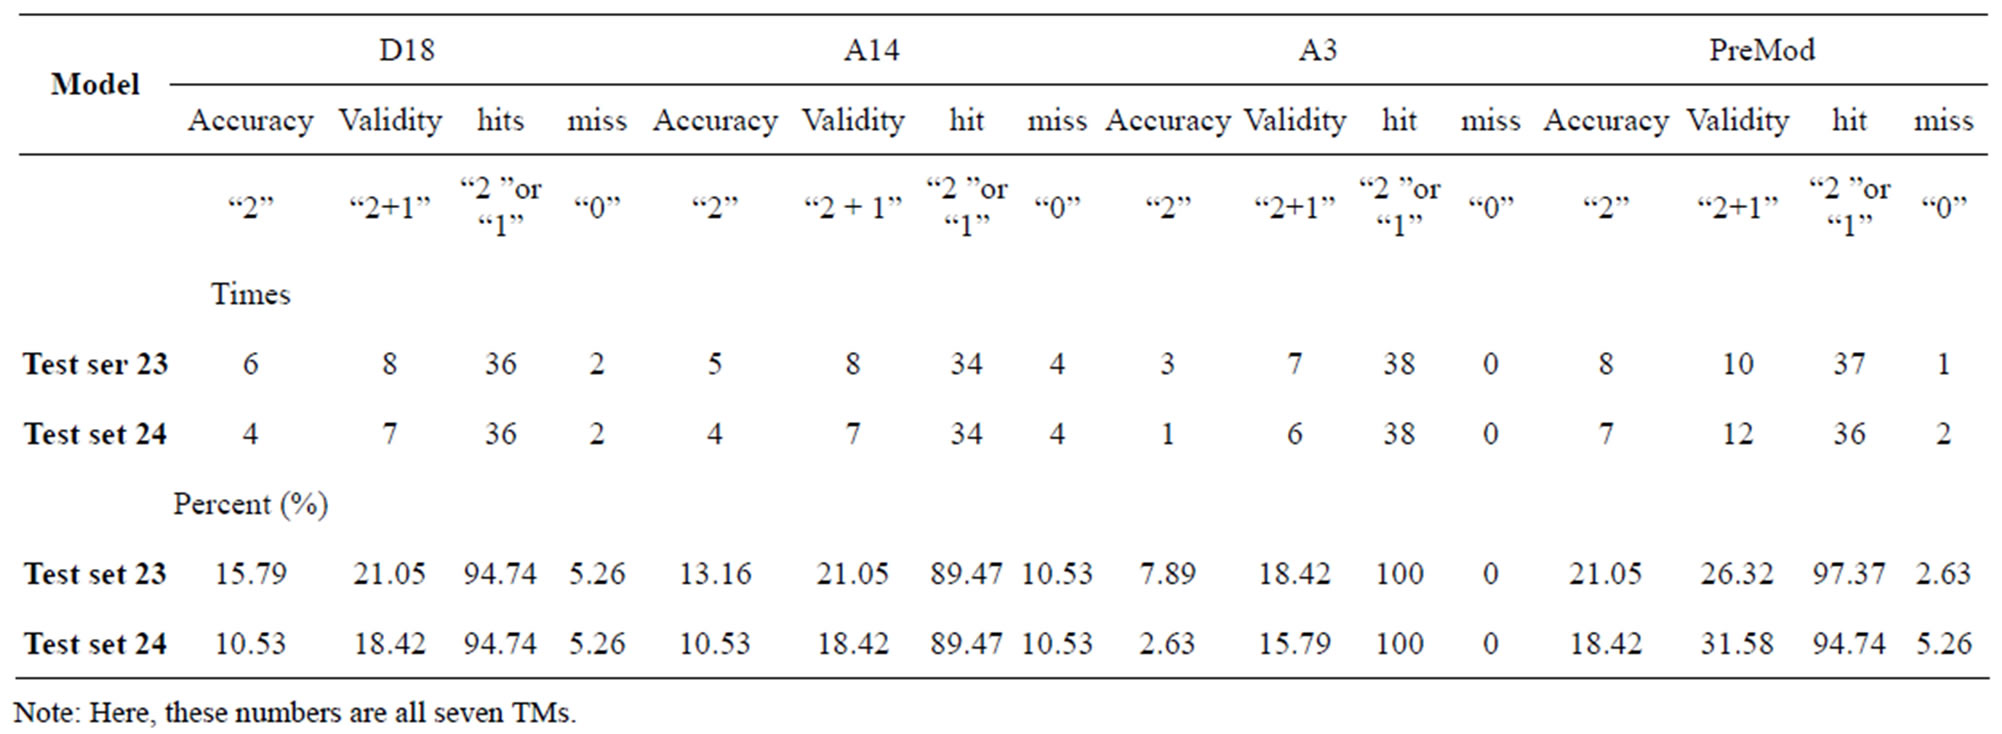
Table 8. The validity and hit rates of prediction all seven transmembrane regions of GPCRs in test sets by the scoring matrices of training set 18, 14, 3 and PreMod.
some potential drug targets.
The test of the normality of scores of Test sets by the Shapiro-Wilk statistic reveals that the data of model 18 and 14 fit the normal distribution and all statistical testing was conducted at significance level 0.10 with all confidence intervals at confidence level 0.90 (Table 9). Here, the W values are between zero and one, and typical value is 0.10. The significative p-values are more than the default value 0.05 at the level of α = 0.10. The batch means pass the Shapiro-Wilk test for multivariate normality. Particularly, the means of scores on the basis of model 18 are less than those of model 14 while “2 + 1” combined with Test set 24 model is superior to “2” binding to Test set 23 model. Take 90% confidence interval lower limit of “2 + 1” combined with Test set 24 model based on model 18 as the threshold of TM1-7 of GPCRs for prediction of chromosome 19 (Validation Set).
Table 10 displays the score and the validity of the coding sequences of each trans-membrane segment of 22 GPCRs located in sense chain of chromosome 19 by the scoring matrices of Group 18 (model 18). Chromosome 19 is composed of four configs: Config 1, 2, 3, and 4, containing 3, 0, 11, and 7 GPCRs, respectively. The prediction results of these GPCRs show that there are 19, 8, 9, 5, 6, 6, and 11 positive data of TM1, TM2, TM3, TM4, TM5, TM6, and TM7, respectively. Plot of predicted and actual values of GPCRs in four configs of chromosome 19 shows that four TMs (i.e. TM1, TM2, TM6, and TM7) have higher prediction accuracy while other three TMs (such as TM3, TM4, and TM5) possess lower positive results (Figure 8), especially TM1 and TM7 with positive rates of 19/74 and 11/25, respectively. However, the “hits” rate is up to 20/22 if only anyone TM fits to the actual TMs of GPCRs.
Due to the size of our data sets, pairwise computation
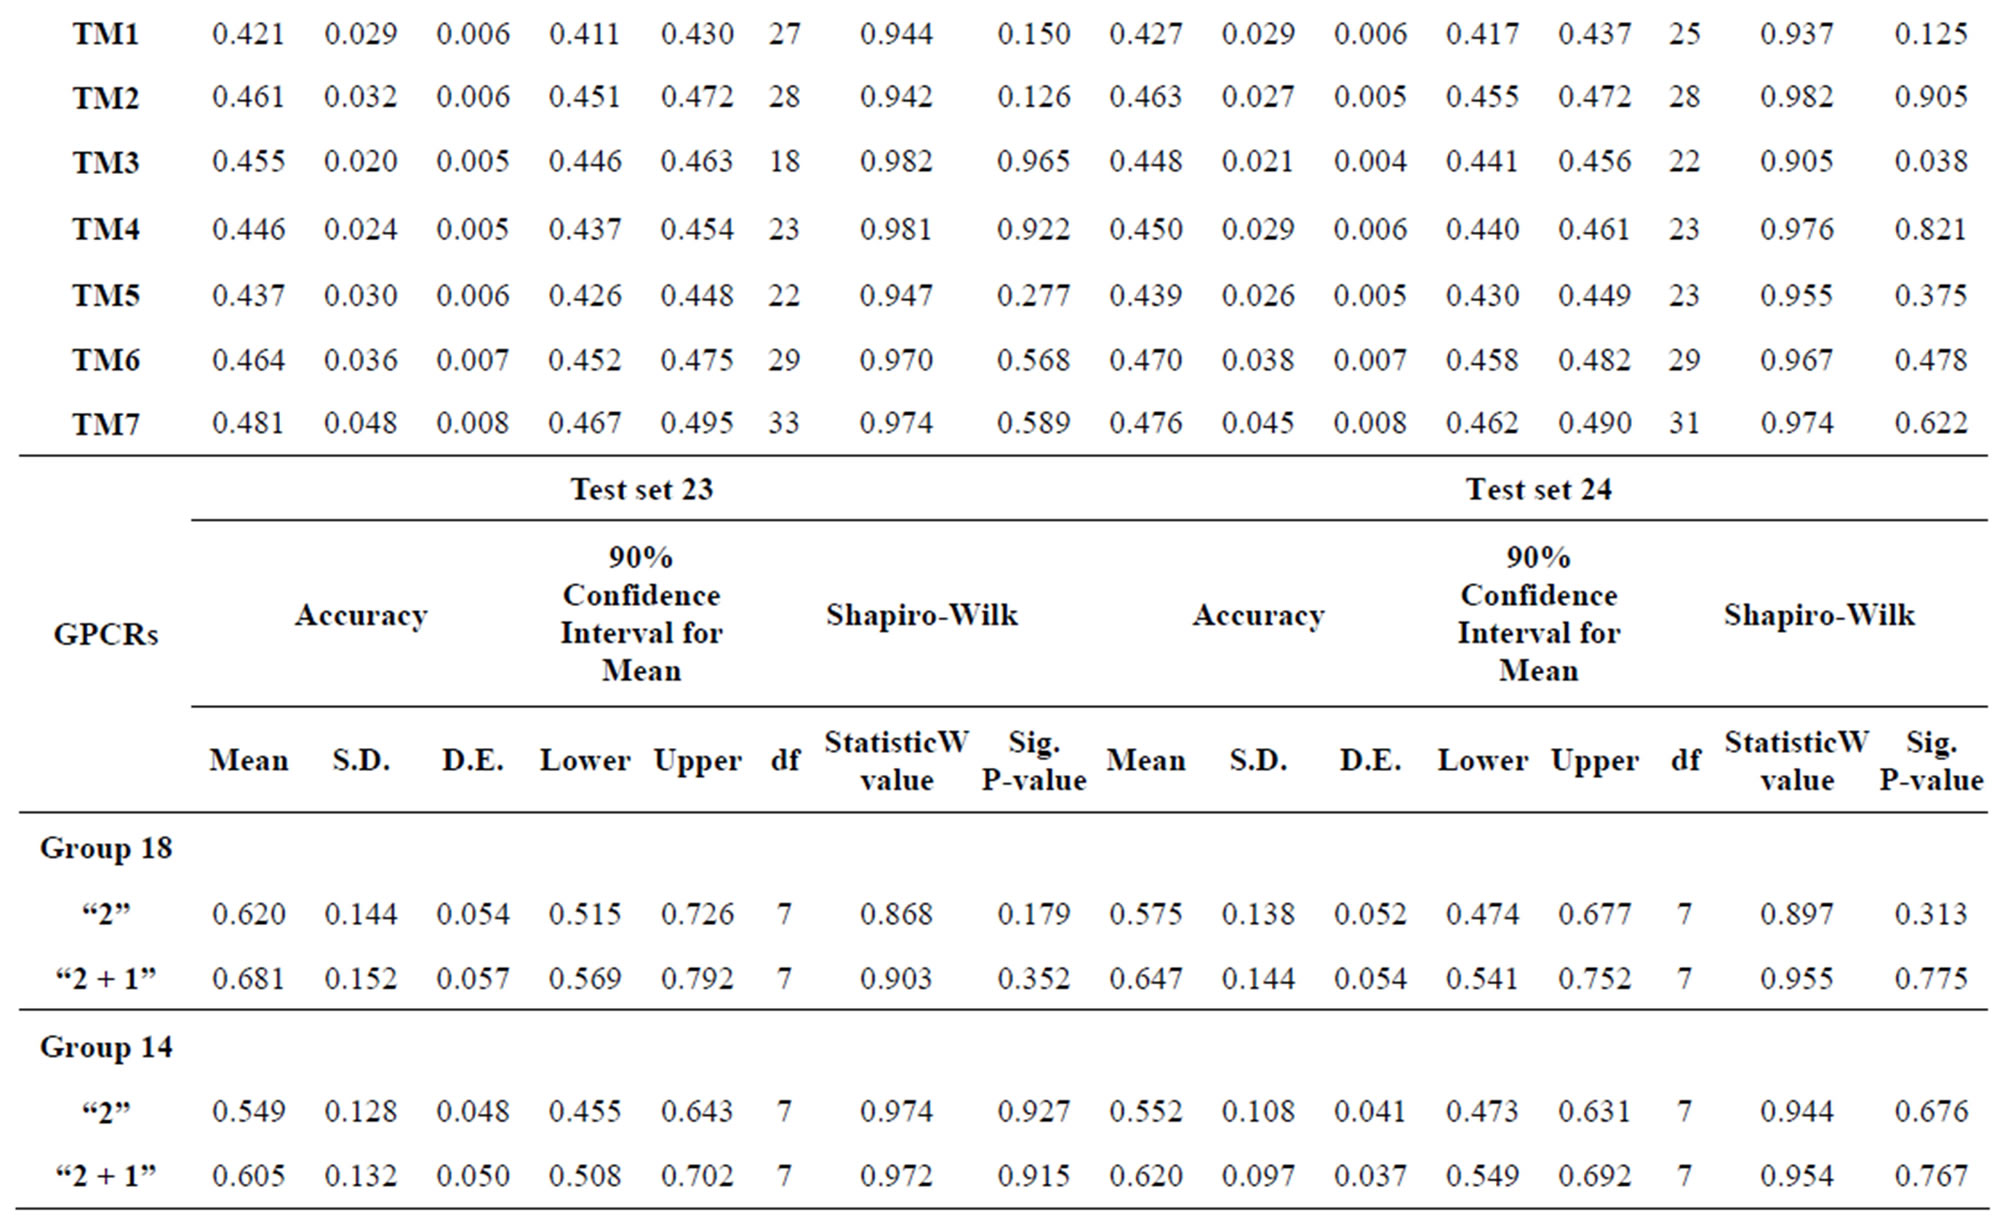
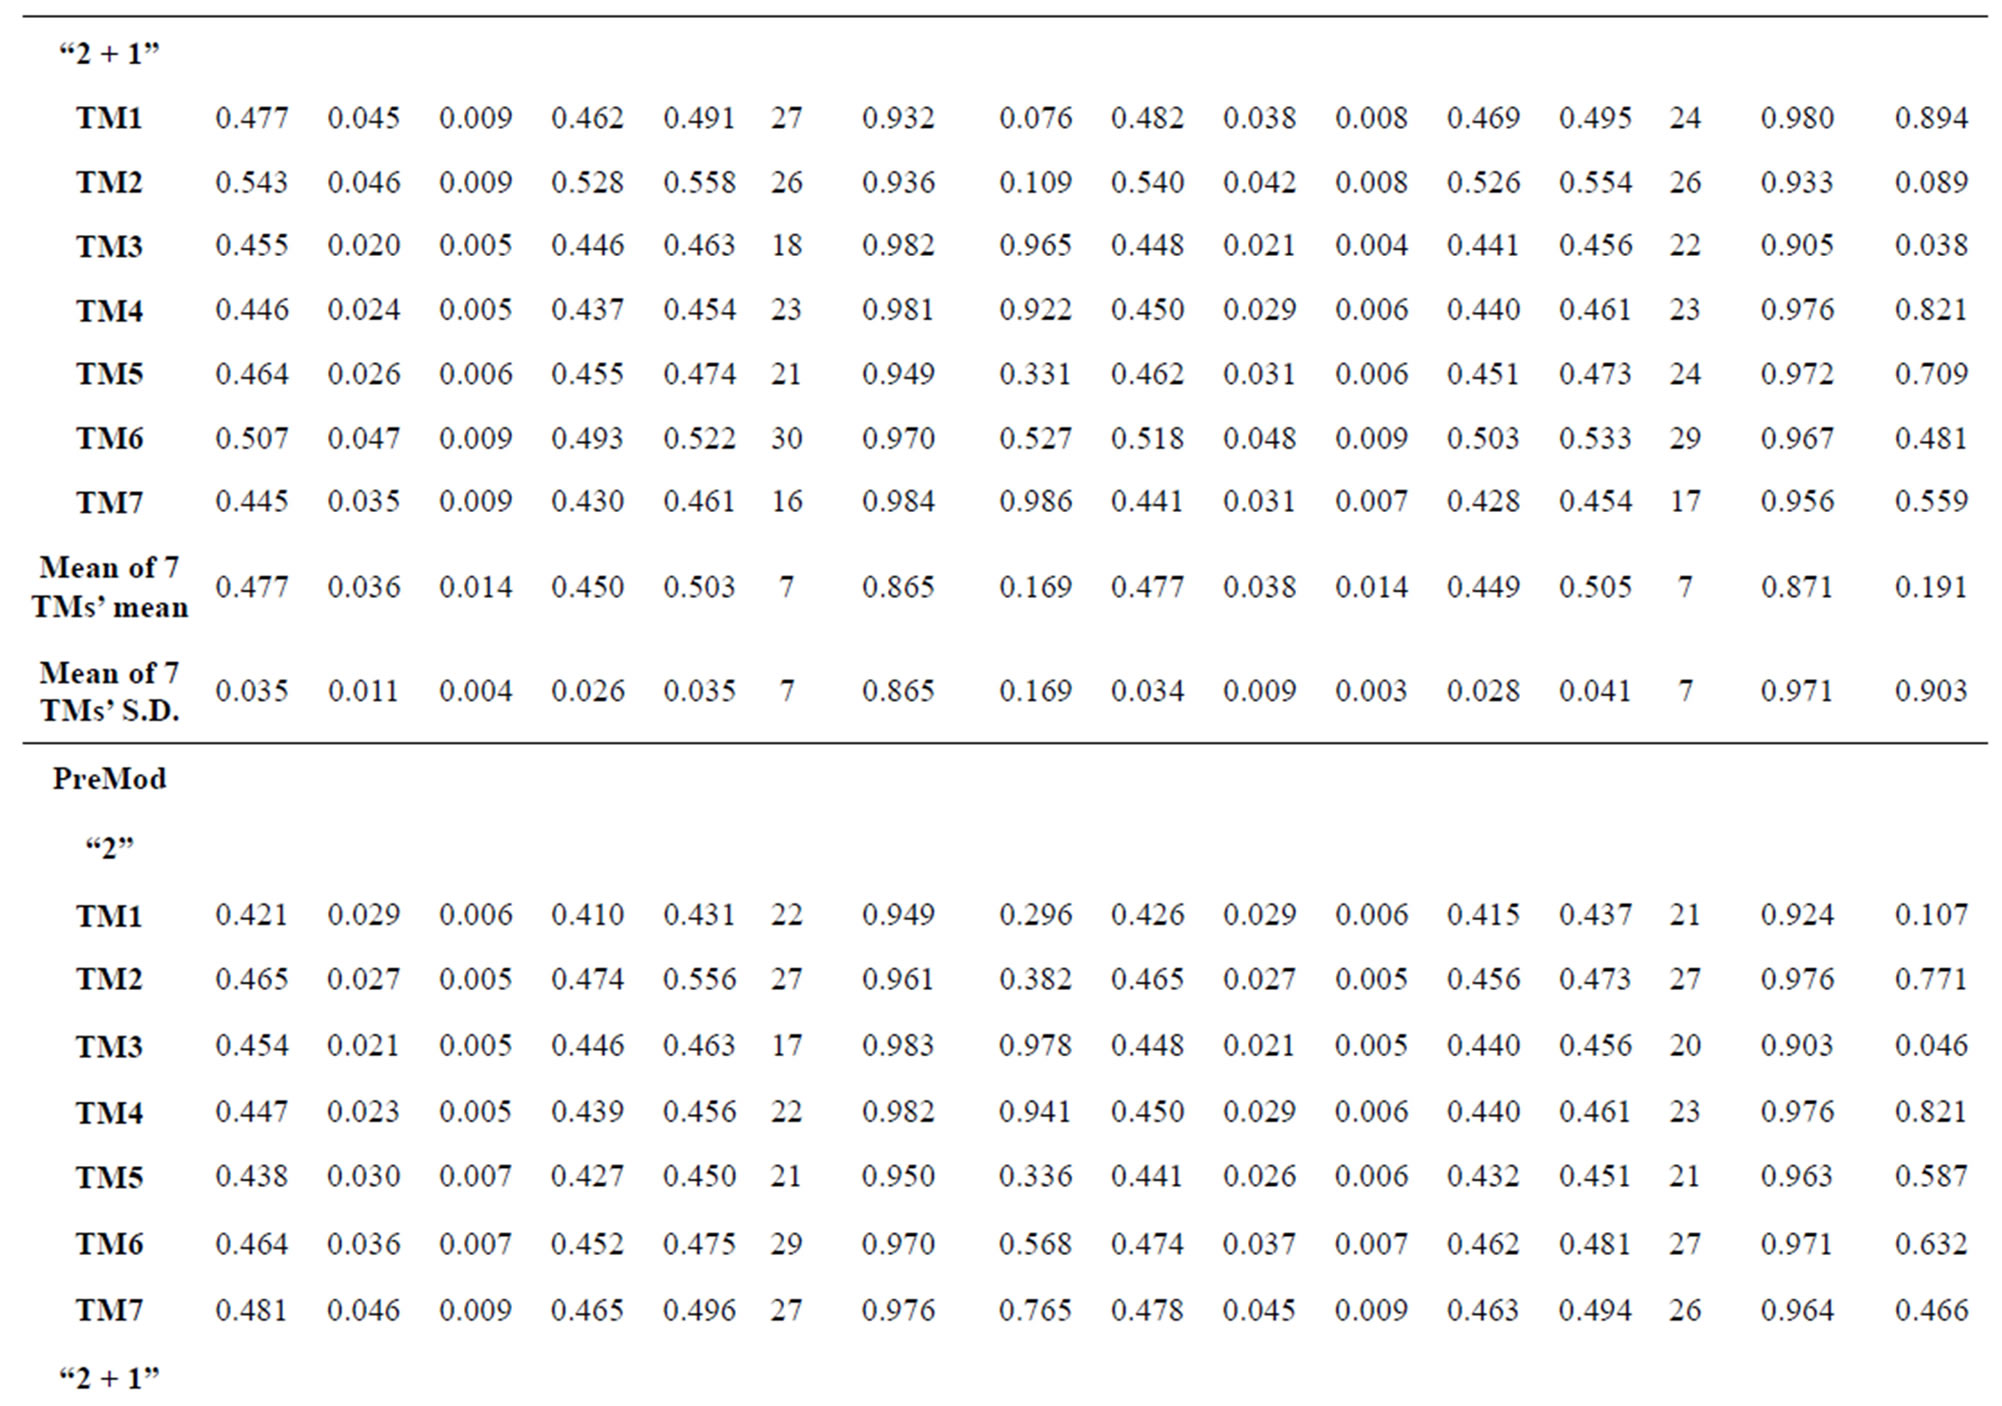
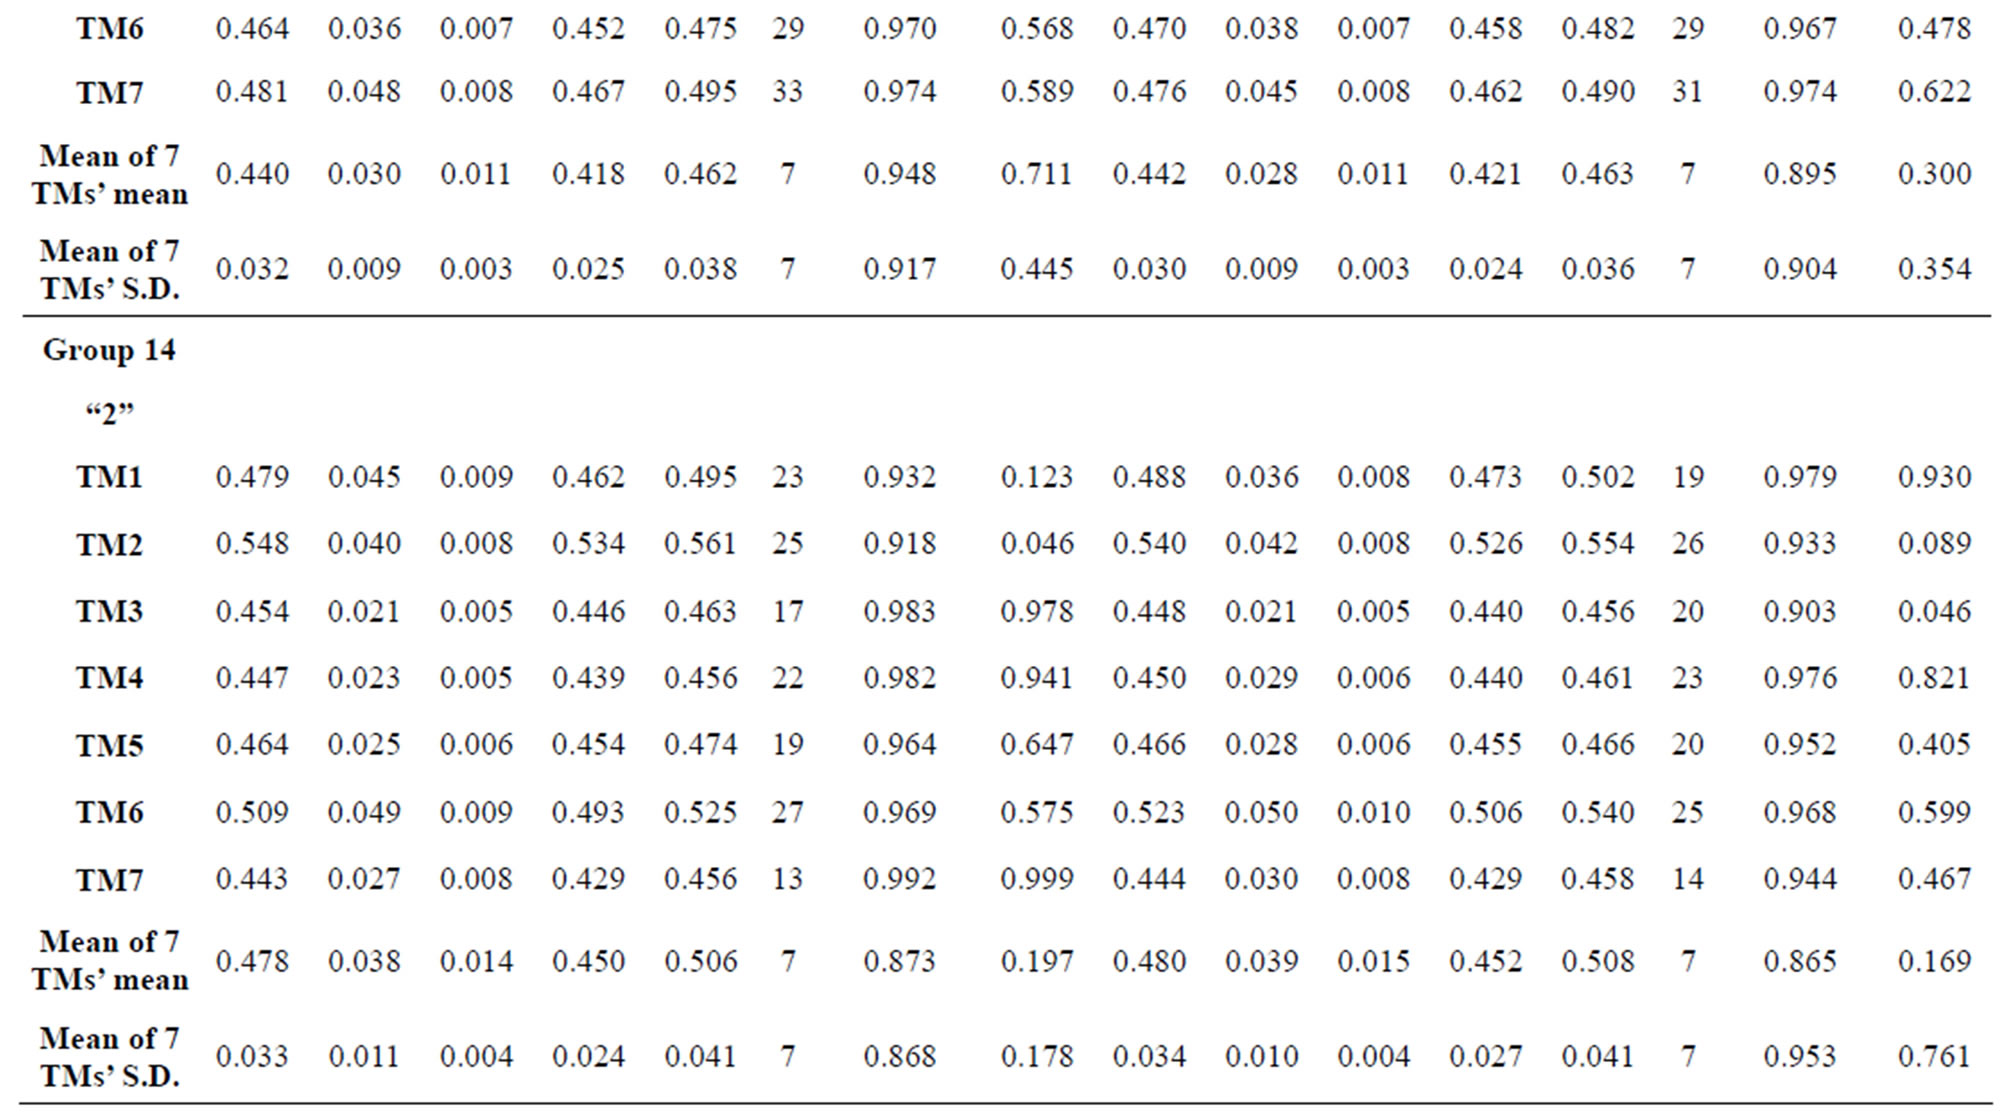
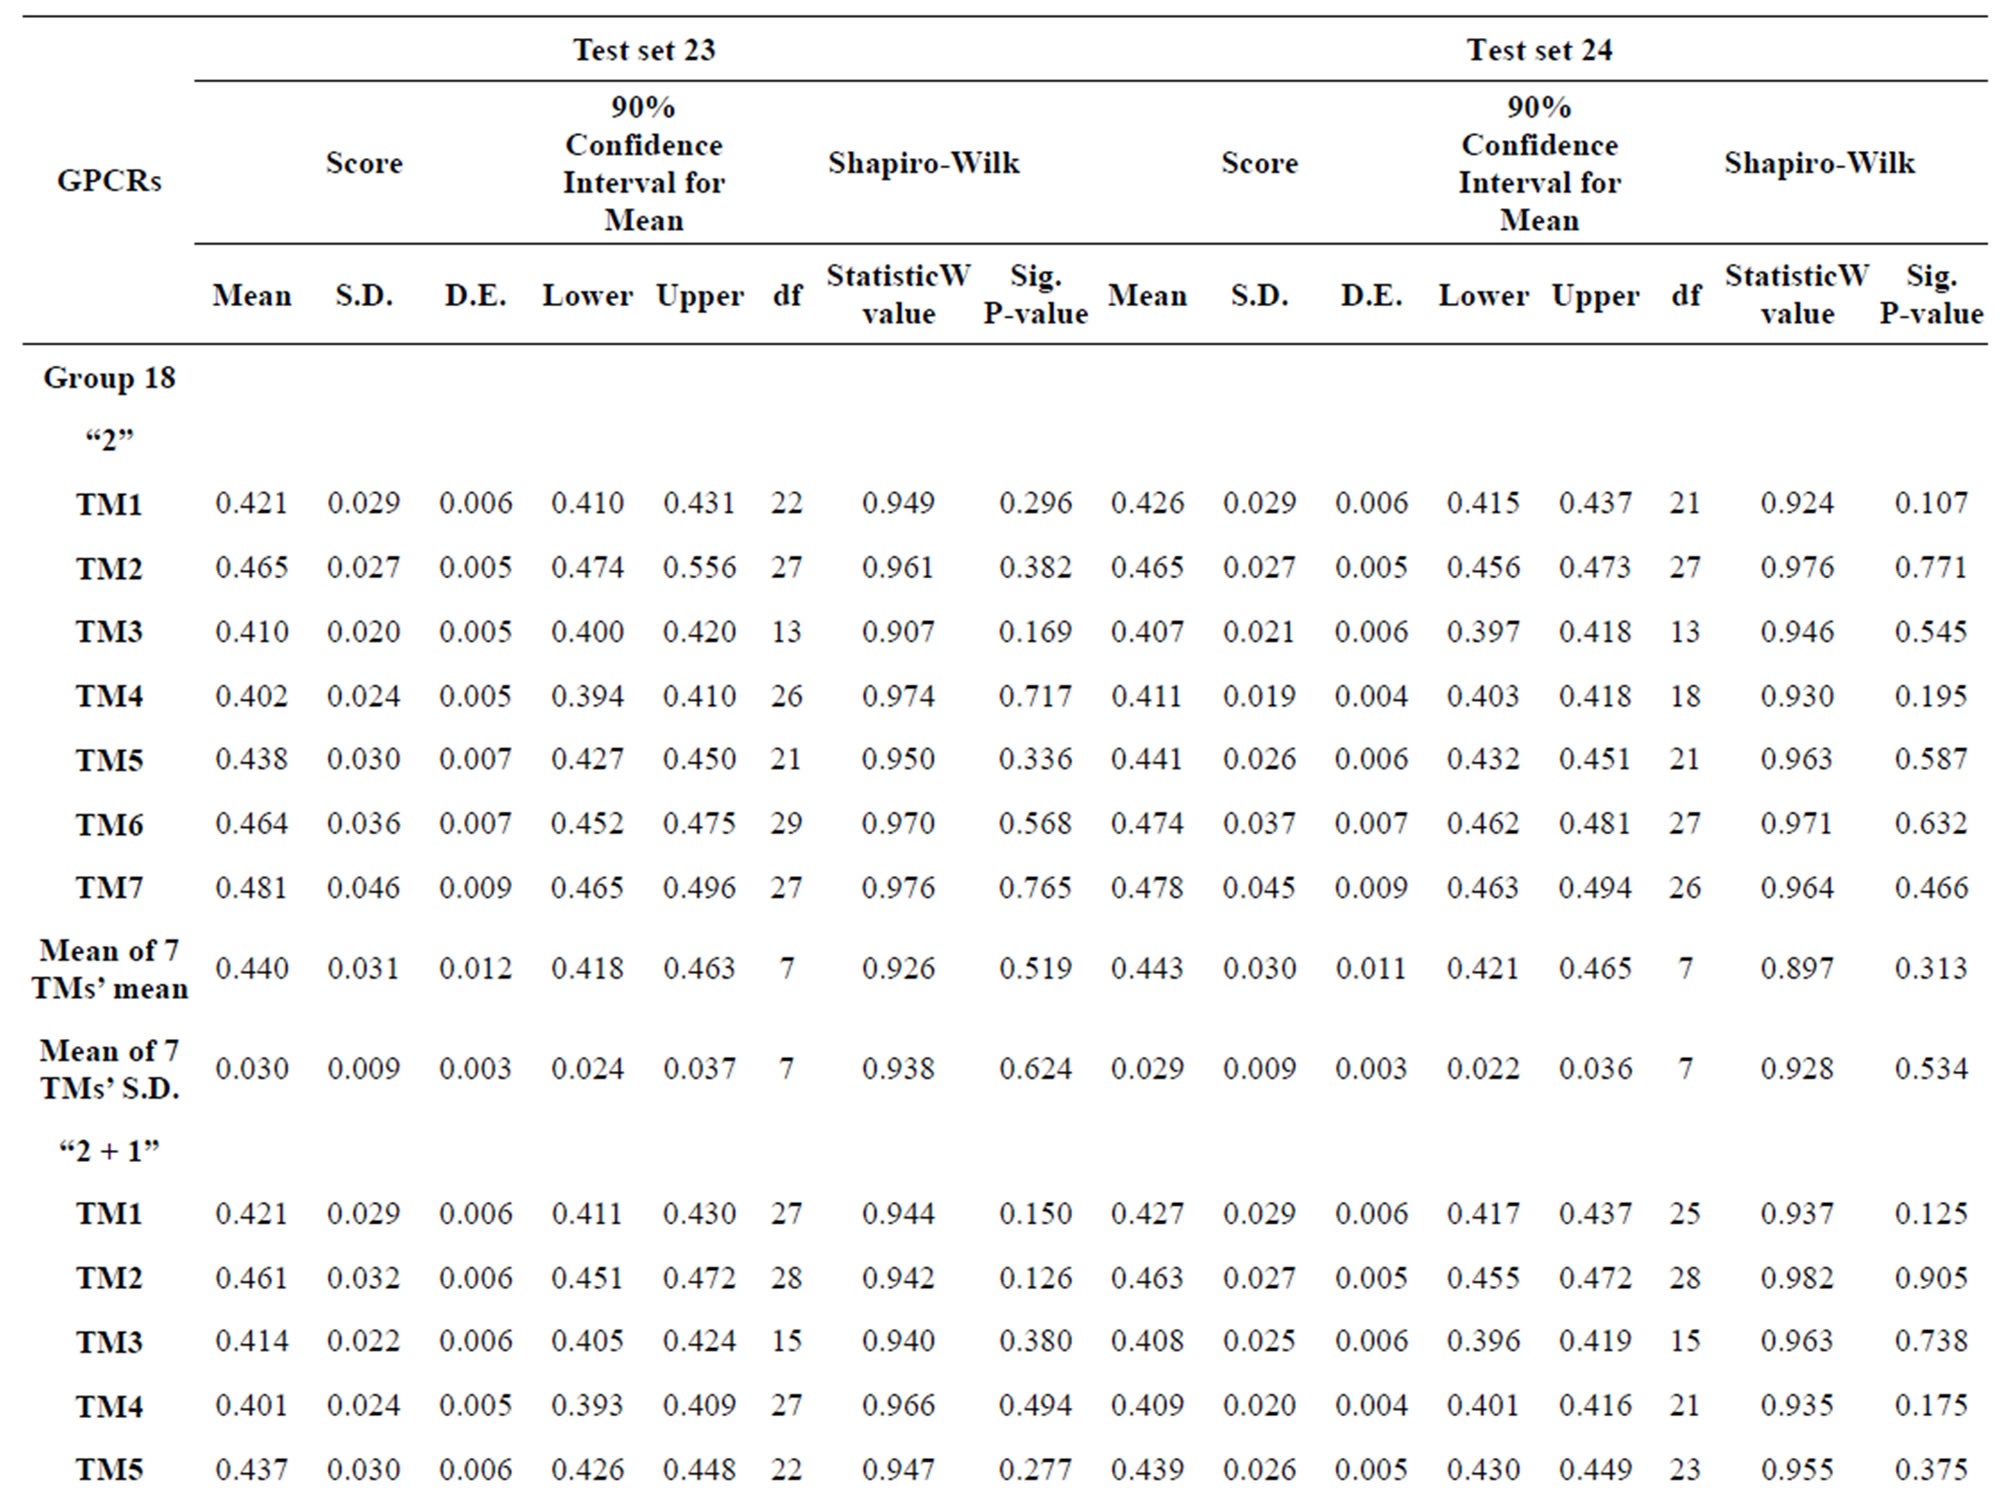
Table 9. Normality analysis of the scores of 38 GPCRs’ 7 TMs in Test set 24 by the scoring matrices of PreMod.
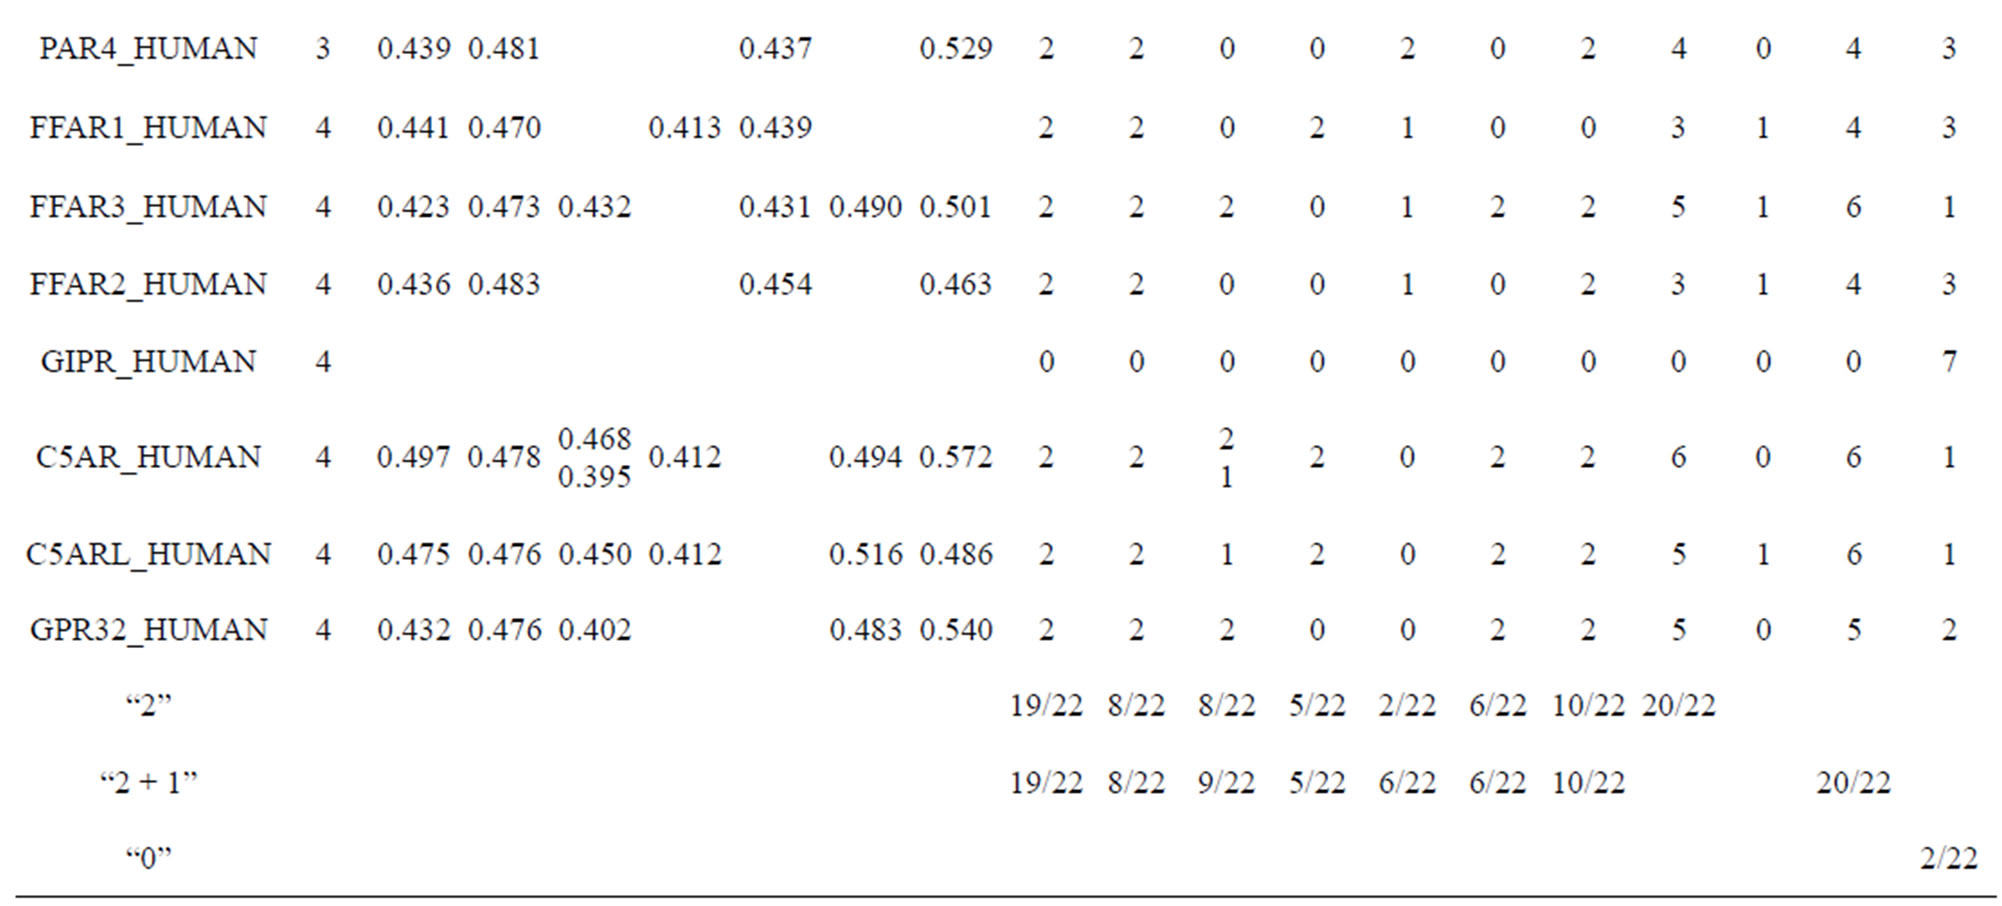
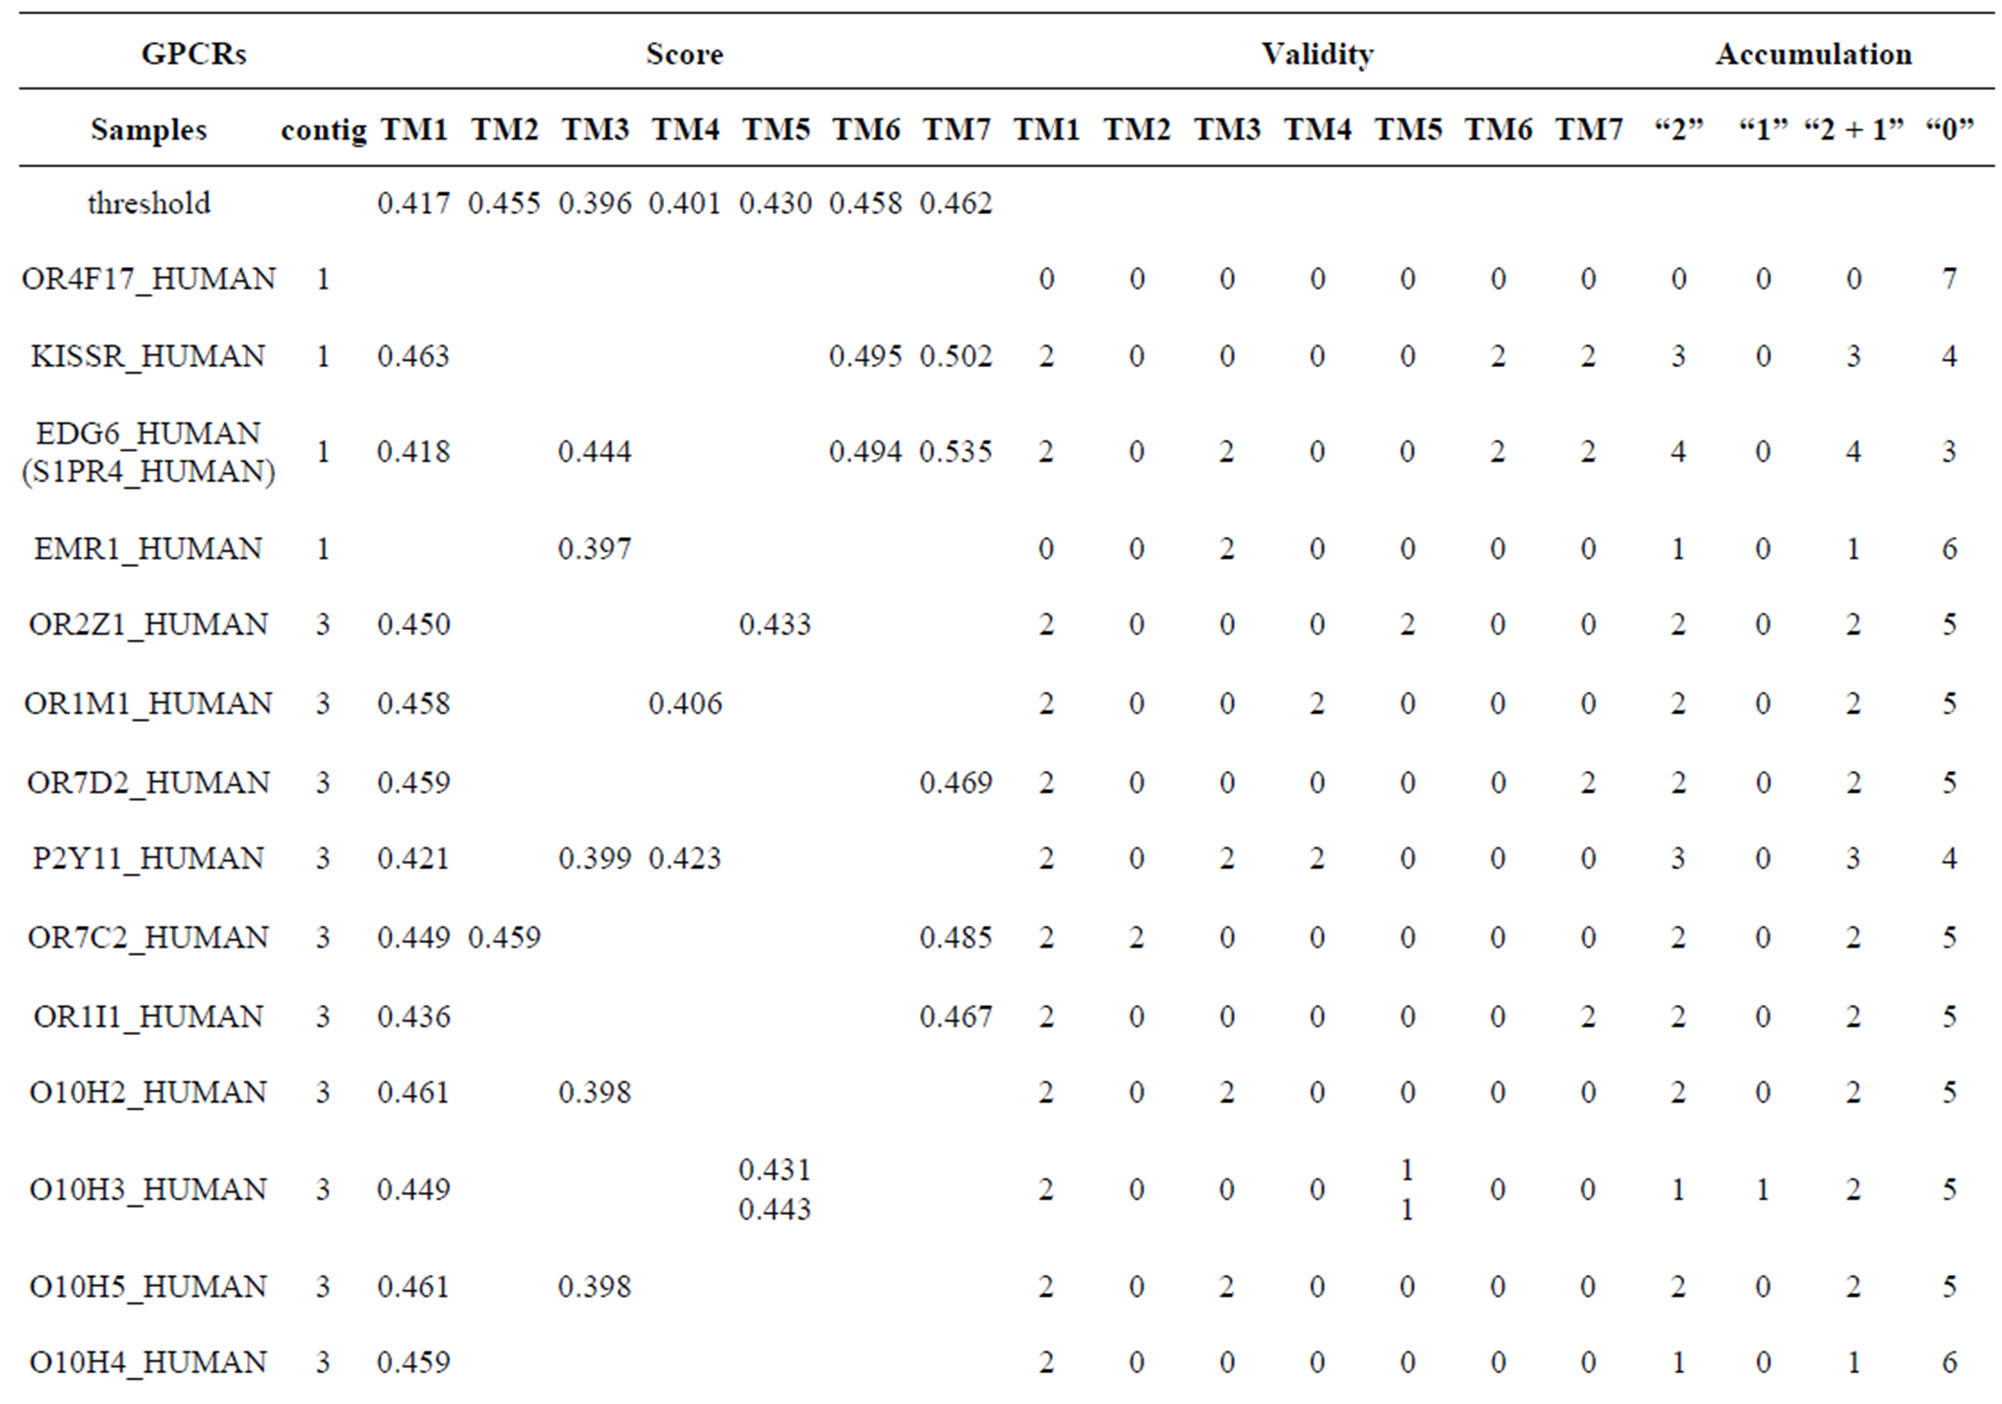
Table 10. The score and the validity of the coding sequences of each trans-membrane segment of 22 GPCRs located in sense chain of chromosome 19 by the scoring matrices of PreMod.
of molecular similarities required on the order of a million individual protein segment/segment similarities. Rather than employ the phylogenetic evolution similarity method directly, we employed the scoring matrix approach to infer similarities in these protein sequences. Our previous work focused on the use of this technique for computations involving building scoring matrices for prediction. Consequently, the following work was wanted to verify that the method yielded the expected results within the space of known GPCRs in test sets.
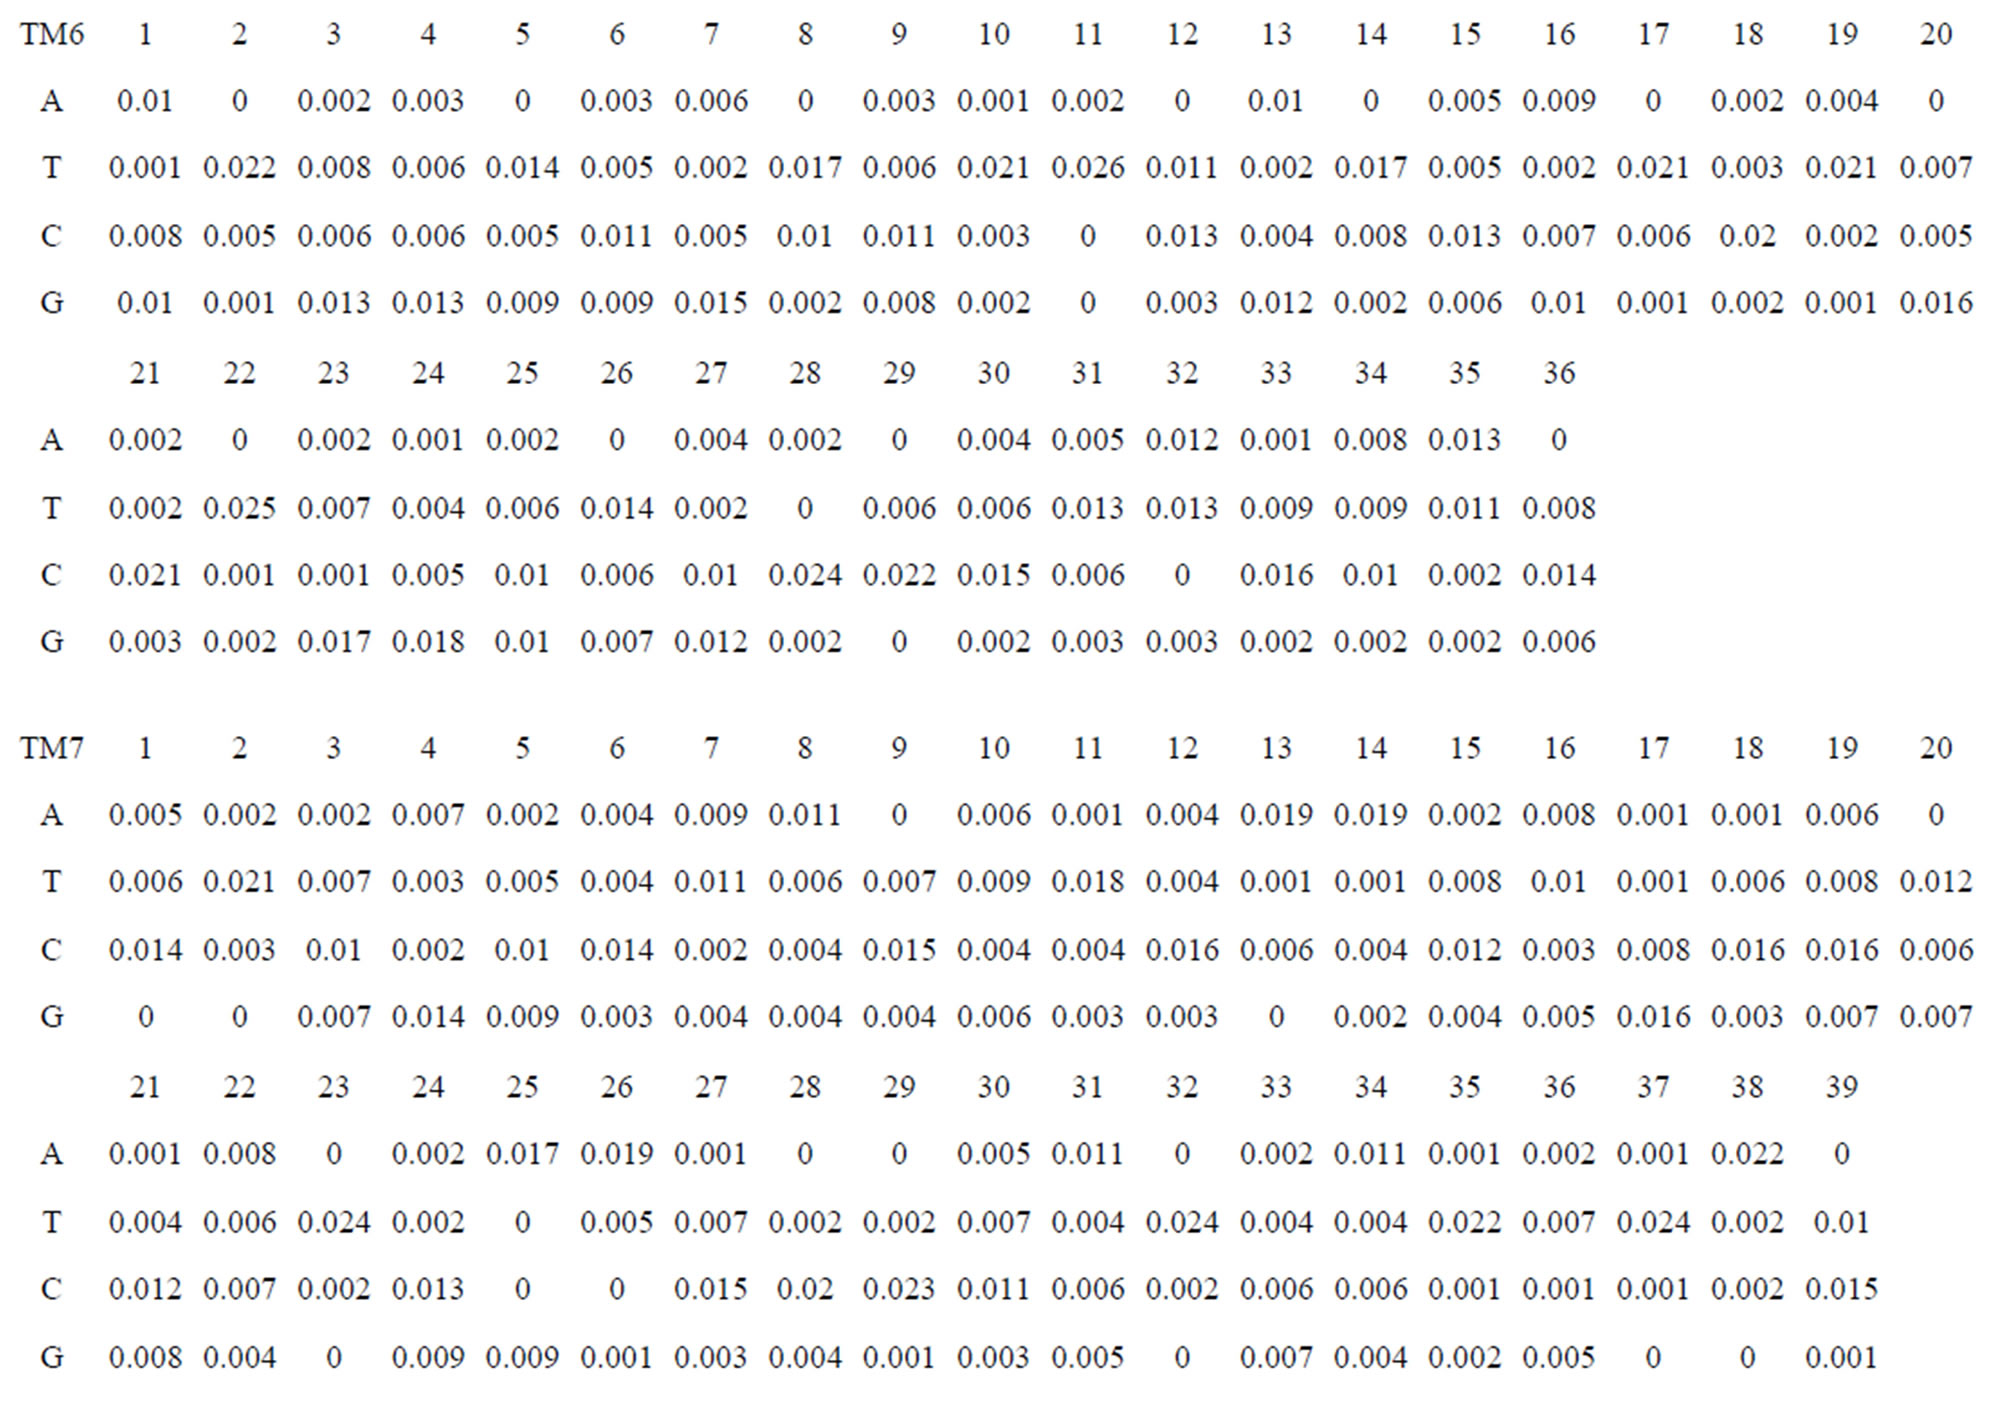
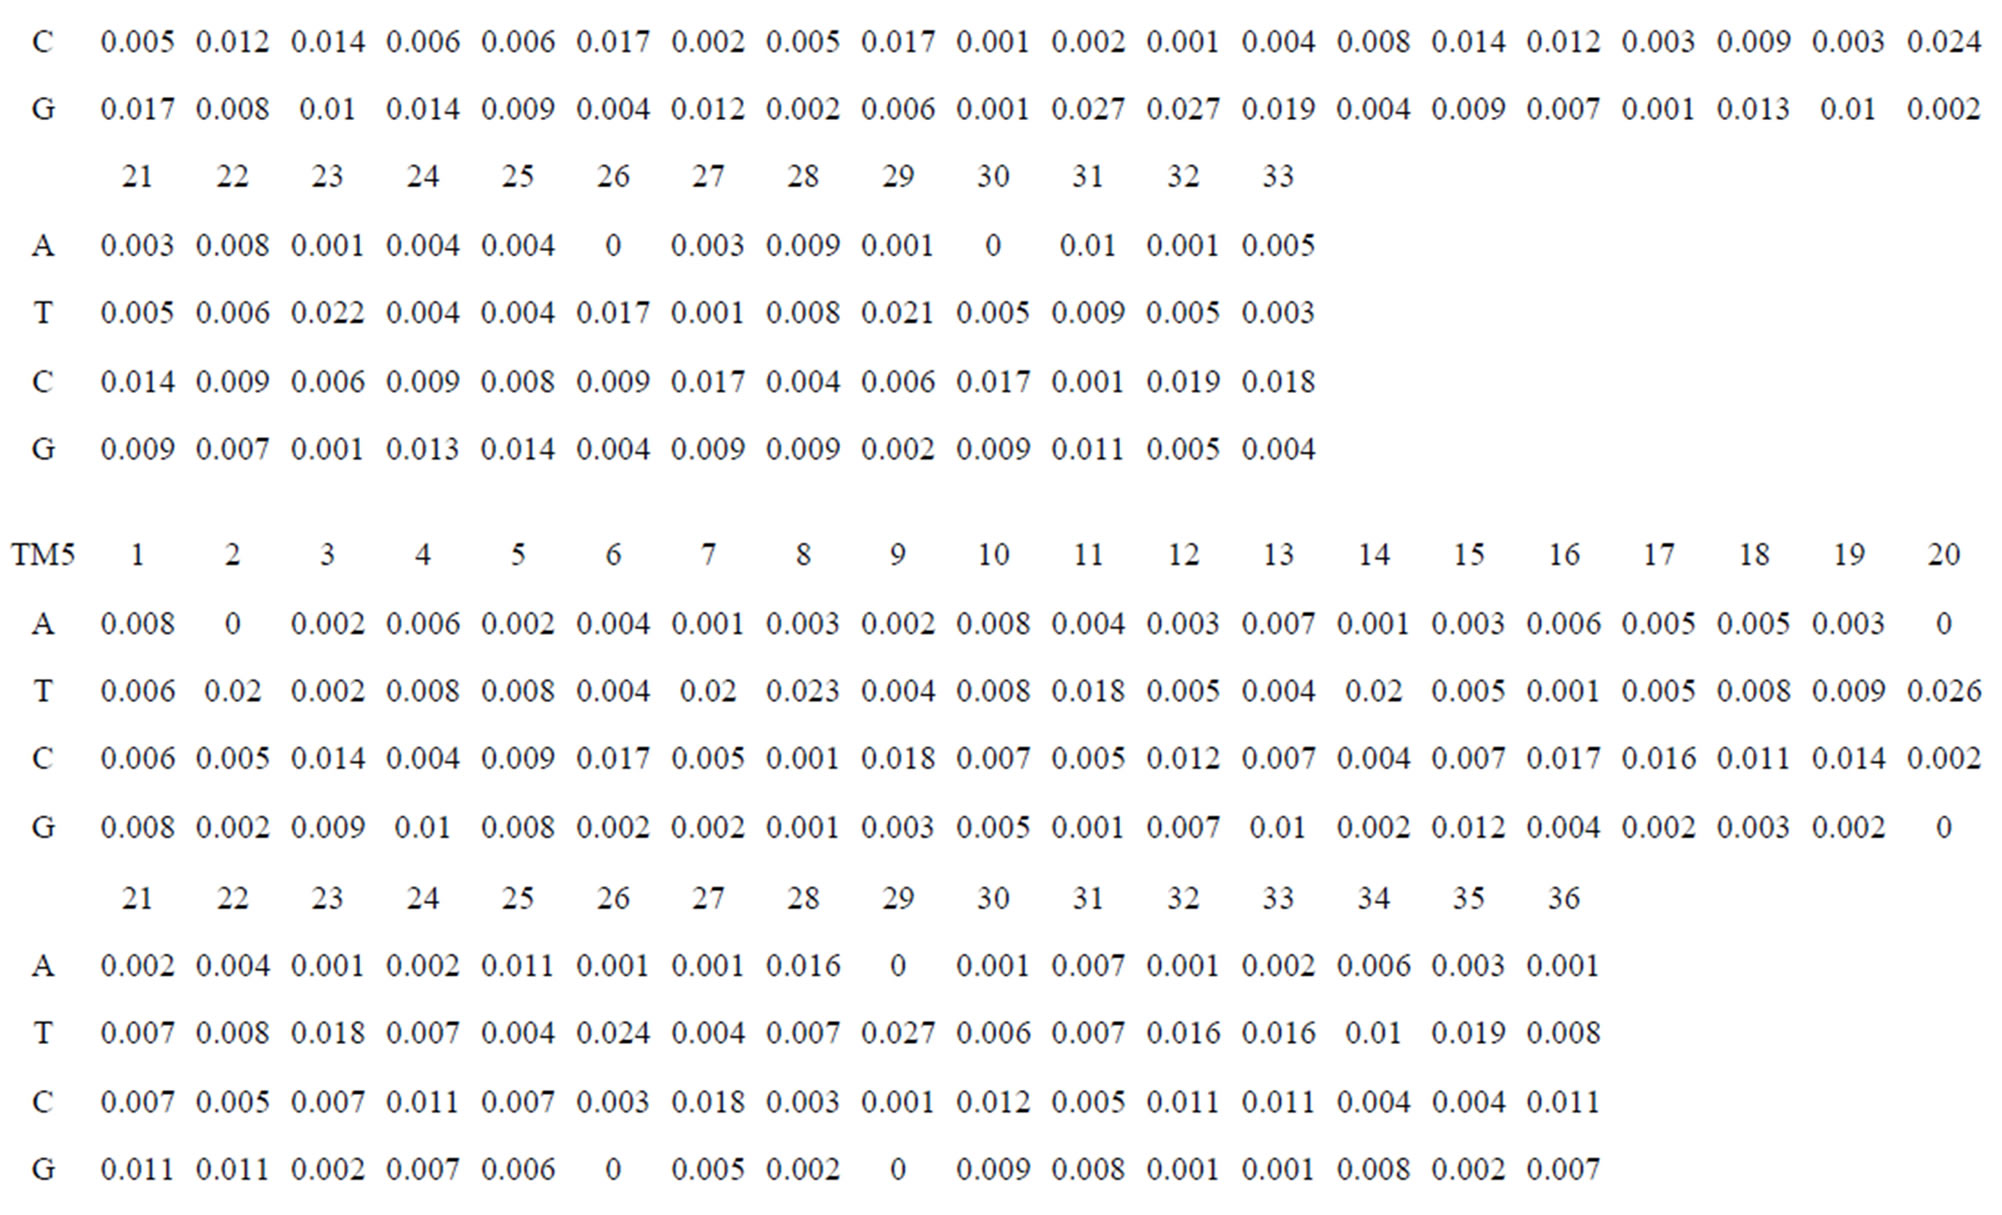
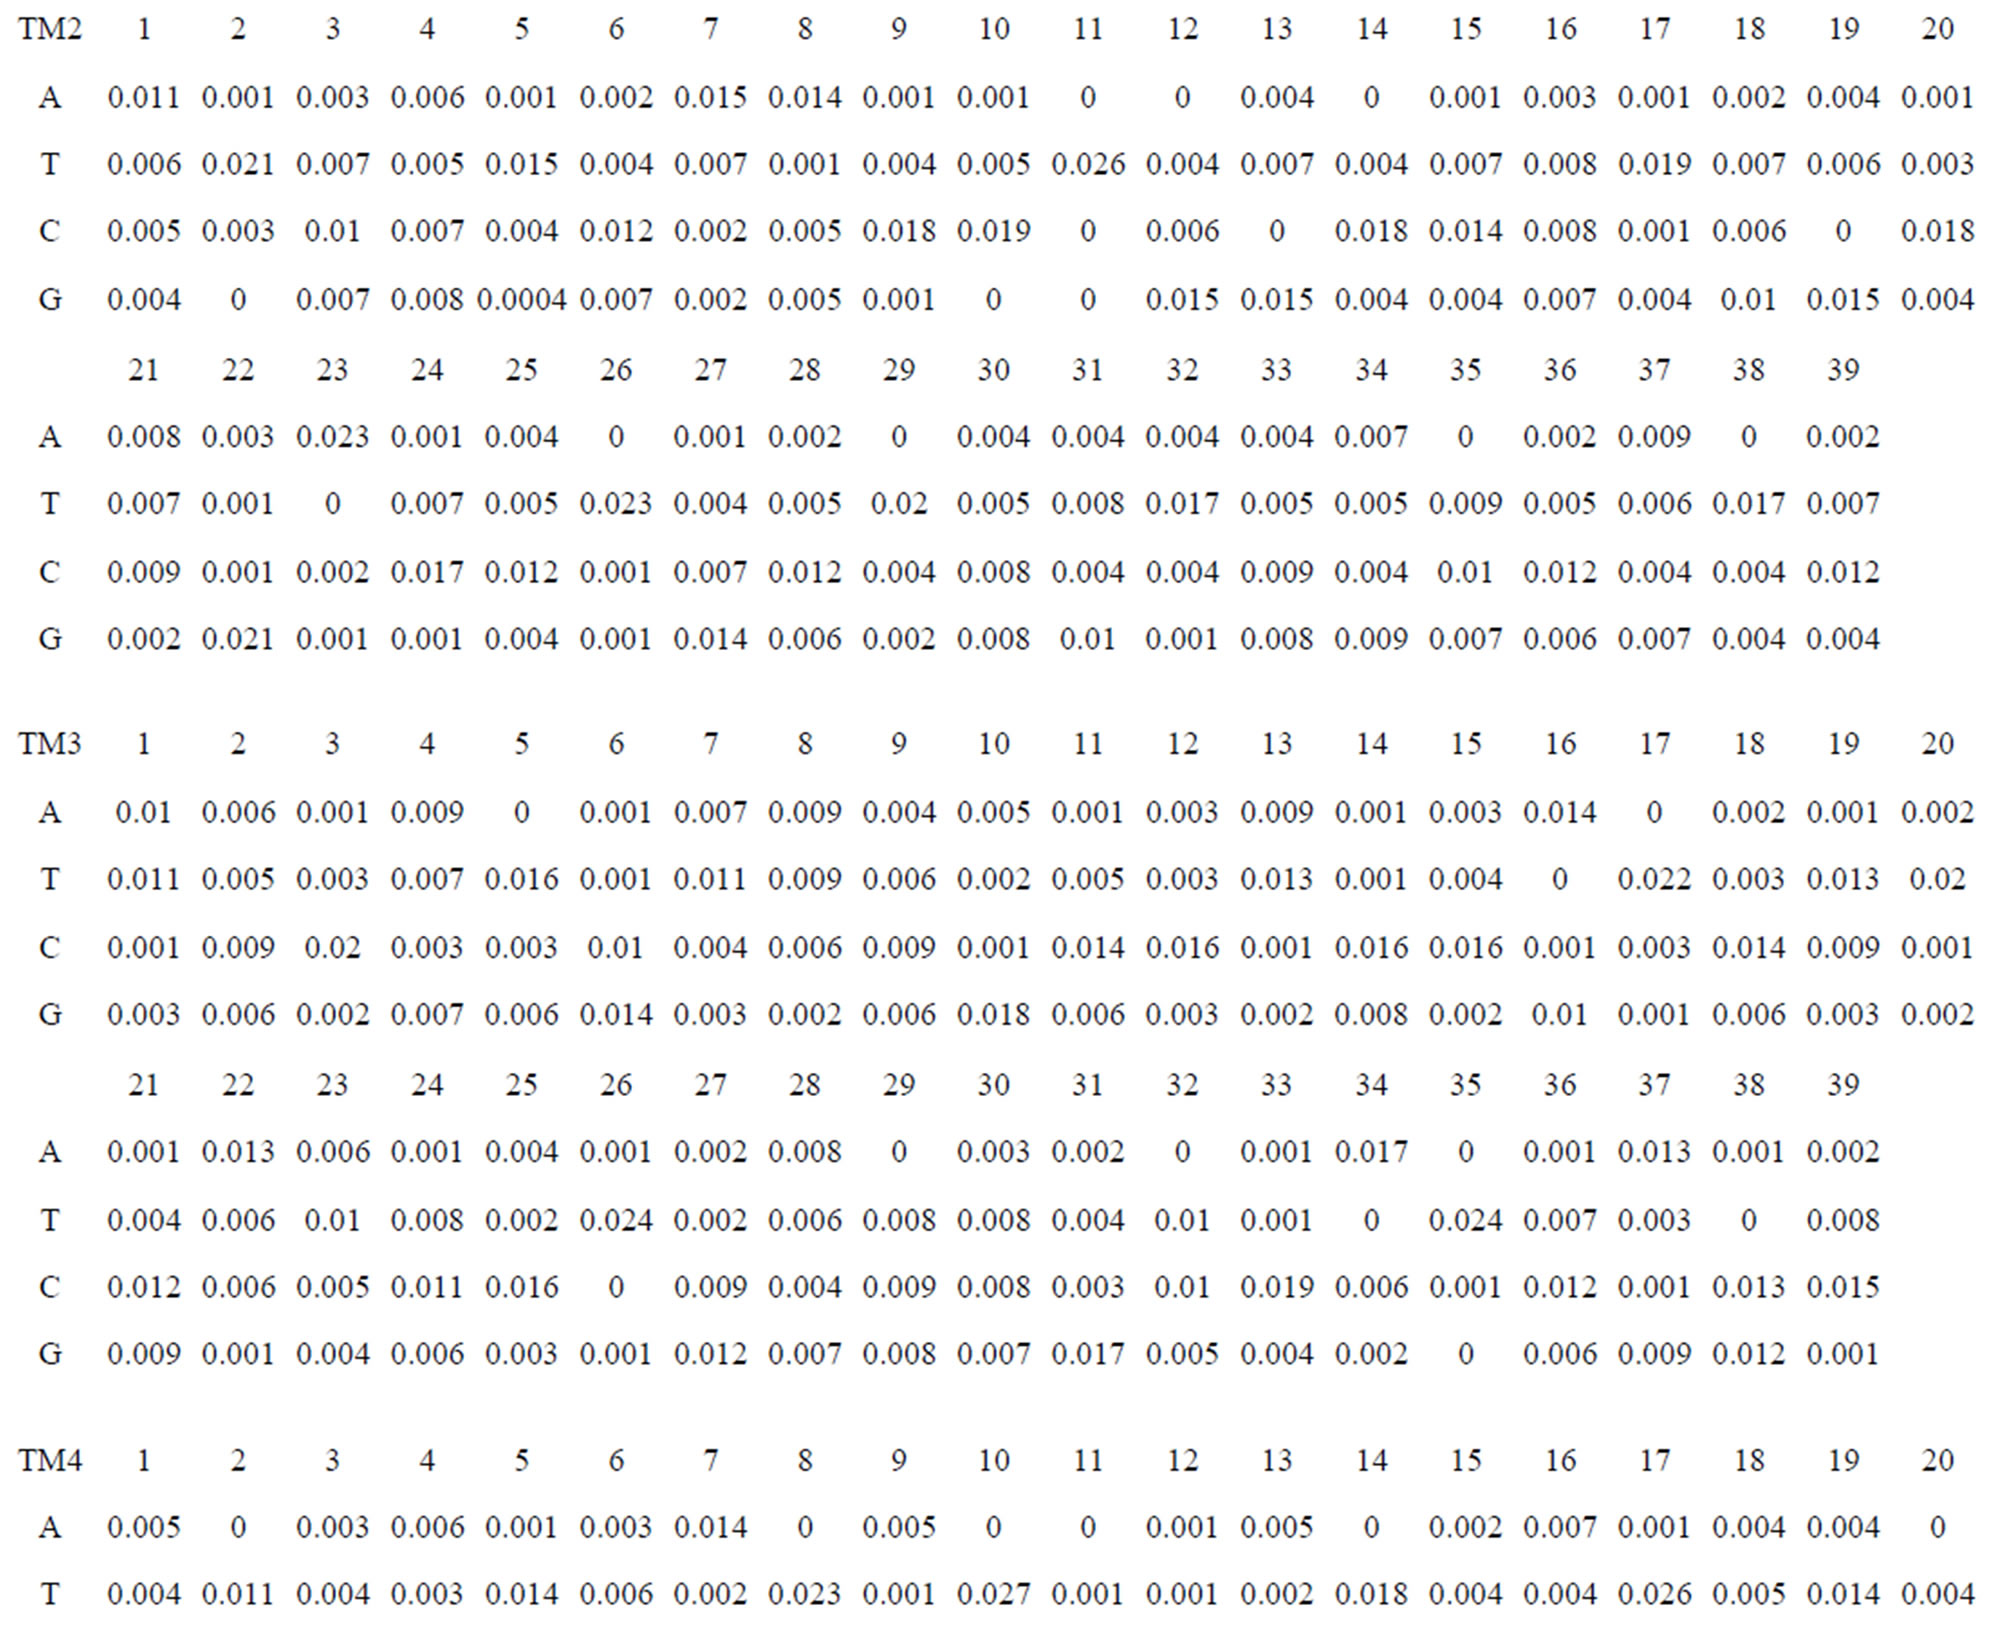
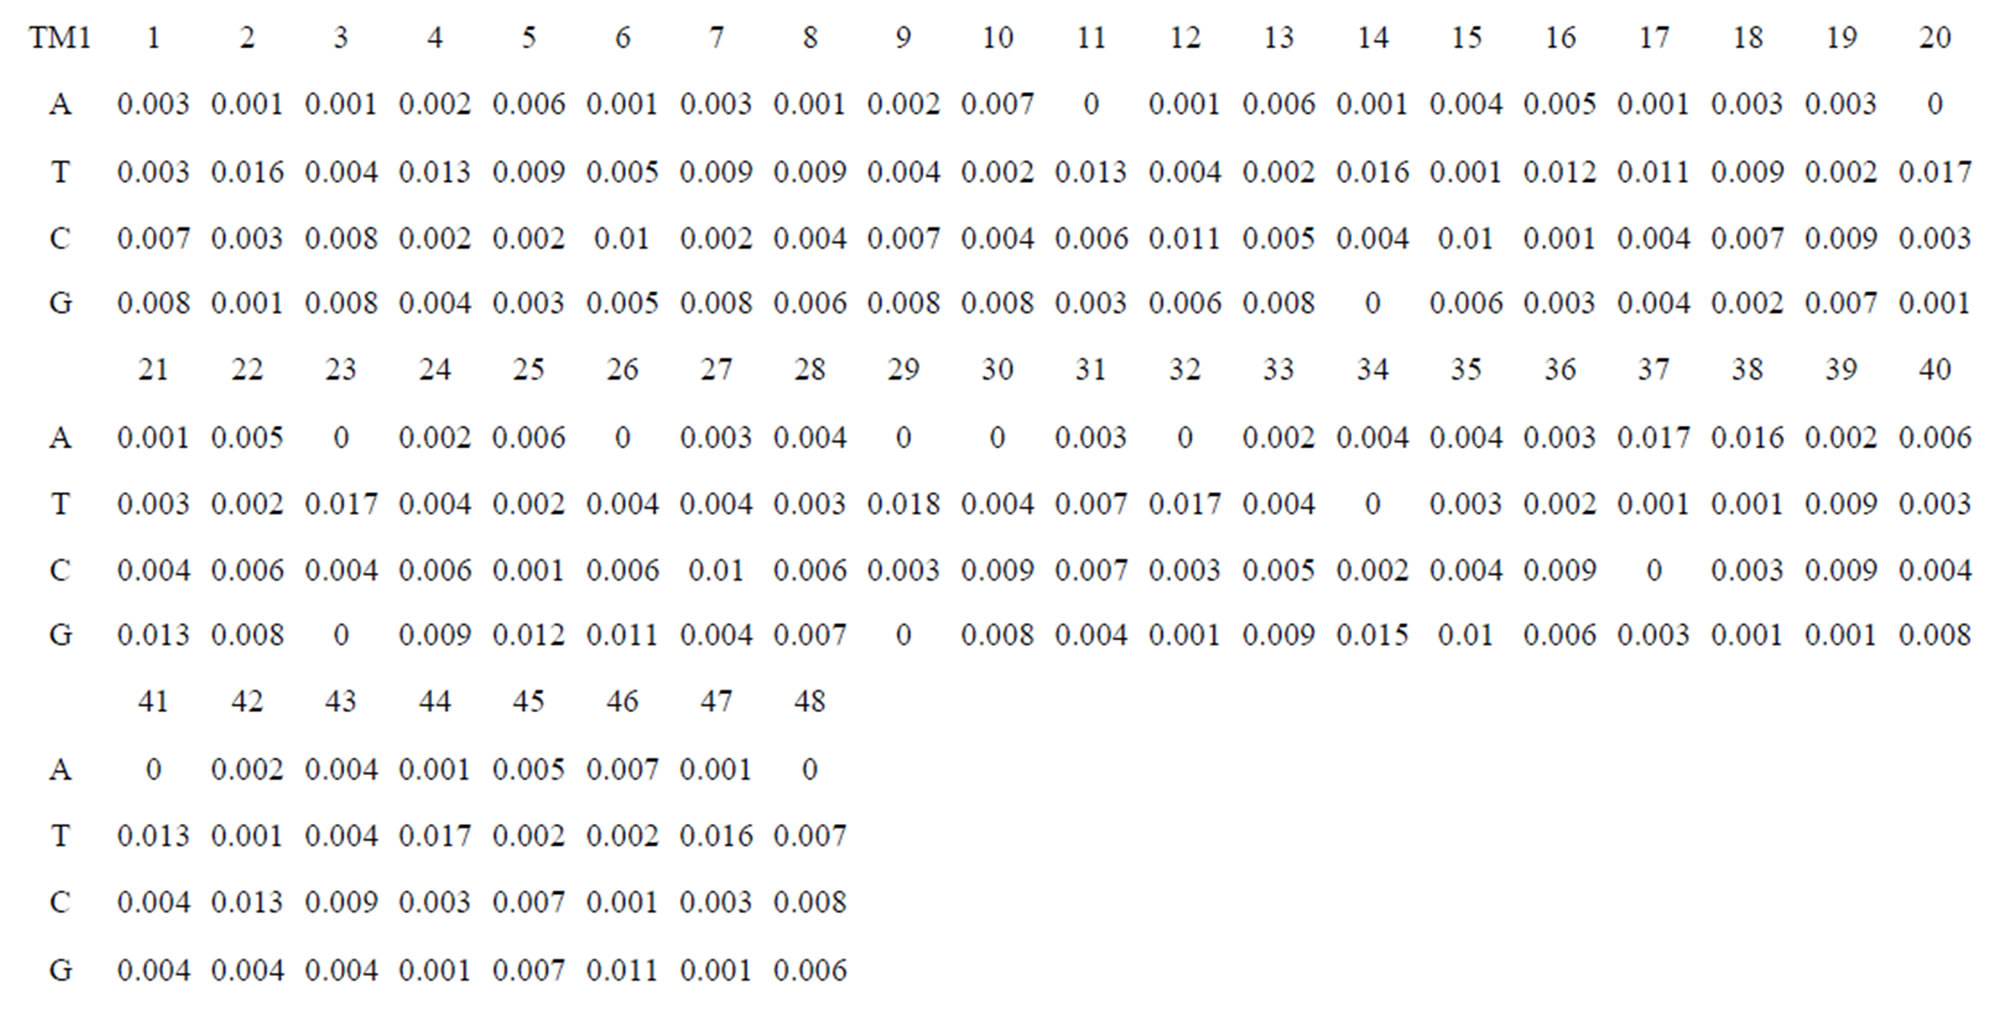
Figure 8. The score matrix of the prediction model.
4. DISCUSSION
Being the largest family of cell surface receptors, GPCRs play a key role in cellular signaling pathways that regulate many basic physiological processes, such as neurotransmission, secretion, growth, cellular differentiation, inflammatory, and immune responses [46,47]. Protein phosphorylation is an essential type of posttranslational modification that consists of the addition of a phosphate group to serine (S), threonine (T), and tyrosine (Y) [48]. This process is catalyzed by a group of enzymes called kinases, and can be reversed by phosphatases [47]. The phosphorylation process is catalyzed by GPCR kinases (GRKs) that recognize the receptors as substrates after agonist binding [49]. This phosphorylation often modifies the cytosolic C-terminal tail and leads to receptor uncoupling from G proteins, binding arrestin, and further results in receptor desensitization and deactivation [50]. Huang JH and co-work have revealed that the exact positions of a phosphorylation in a GPCR protein sequence could provide useful clues for drug design and other biotechnology applications [47].
GPCRs are extensively targeted for drug development in humans, especially the biogenic amine-binding GPCRs, which are integral components of the central and peripheral nervous systems of eukaryotes and include receptors that bind the neurotransmitters dopamine, histamine, octopamine, serotonin, tyramine, and acetylcholine [51, 52]. Malaria is a devastating infection caused by protozoa of the genus Plasmodium (P. falciparum). Gamo et al. have reported multiple GPCR-interacting chemistries as promising anti-malarial leads [53]. Analyses using historic assay data revealed that some compounds had activity, but against drug targets without obvious orthologues in the malarial genome, such as GPCRs, nuclear recaptors, ion channels and transporters. They suggested several novel mechanisms of antimalarial action, such as inhibition of protein kinases and host-pathogen interacttion related targets, which provide new tools to exploit the malarial kinome for drug discovery [53]. More than 100 different GPCRs have been identified in the genomes of multiple insect species, including malariaand yellow fever-transmitting mosquitoes. Hill et al. used bioinformatics approaches to identify a total of 276 GPCRs from the Anopheles gambiae genome, which are likely to play roles in pathways affecting almost every aspect of the mosquito’s life cycle [54]. Meyer JM et al. used “genome-to-lead” approach to develop new modeof-action insecticides for arthropod disease vectors, involving 1) exploitation of an arthropod genome sequence for novel target identification; 2) molecular, biochemical and pharmacological target validation; 3) chemical library screening; and 4) confirmation of hits and identification of candidate “leads” using secondary in vitro assays and mosquito in vivo assays [52]. They reported the first study to identify Aedes aegypti D1-like dopamine receptor (AaDOP1) antagonists with in vivo toxicity toward mosquitoes.
GPCRs comprise the largest family of validated drug targets while 30% - 50% of approved drugs derive their benefits by selective targeting of GPCRs [55]. Mutations in GPCRs are responsible for over 30 disorders, includeing cancers, heritable obesity, diabetes insipidus, blindness, endocrine diseases, and diseases involving the melanocortin type 4 and gonadotropin releasing hormone receptor (GnRHR) [56,57]. Many pathologies associated with misfolded mutant receptors occur because these are retained by the endoplasmic reticulum (ER) and do not reach their normal site of function [57]. Normally, GPCRs are subjected to a stringent quality control system (QCS) in the endoplasmic reticulum [56]. This system consists of both protein chaperones and enzyme-like proteins. The former retains misfolded proteins while the latter participates in catalysis of the folding process. Moreover, the QCS insures that only correctly folded proteins enter the pathway leading to the plasma membrane. However, point mutations may result in the production of misfolded and disease-causing proteins that are unable to reach their functional destinations in the cell because they are retained by the QCS even though they may retain function [56]. On the other hand, pharmacoperone drugs (from “pharmacological chaperone”) are small molecules that enter cells and serve as a “molecular scaffold” to promote correct folding of otherwise-misfolded mutant proteins and route correctly within the cell [58]. Because these drugs are frequently selected from candidates that were originally identified as target specific antagonists, they also show high target specificity as pharmacoperones, although competition for endogenous ligands is a therapeutic complication. Accordingly Janovick et al. sought to develop assays that would identify molecules that were not necessarily agonists or antagonists [56]. In principle, the pharmacoperone-rescue approach applies to a diverse array of human diseases that result from protein misfolding, such as cystic fibrosis [59], hypogonadotropic hypogonadism [60], nephrogenic diabetes insipidus [61], retinitis pigmentosa [62], hyper-cholesterolemia [63], cataracts [64], neurodegenerative diseases (Huntington’s [65], Alzheimer’s [66], Parkinson’s [67]) and particular cancers [68]. Janovick et al. have also explored molecular mechanism of action of pharmacoperone rescue of misrouted GPCR mutants using hGnRHR, a useful model for studying pharmacoperones [57]. Especially, there is a naturally occurring and highly conserved salt bridge (E90-K121) in hGnRHR that stabilizes the relation between transmembranes 2 and 3 of hGnRHR, which is required for passage of the receptor through the cellular QCS and to the plasma membrane. This bridge, broken in the naturally occurring hGnRHR mutant E90K, causes hypogonadotropic hypogonadism because the misfolded mutant receptor fails the cellular QCS and cannot traffic to the plasma membrane [69]. Additionally, pharmacoperone drugs from different chemical classes all happened to interact identically by creating a surrogate bridge for E90-K121. This ligand-mediated bridge plays a key role in rescue of misrouted GPCR mutants. The method provides the basis of novel primary screens for pharmacoperones, especially to identify structures beyond agonists or antagonists. Non-antagonistic pharmacoperones have a therapeutic advantage since they will not compete for endogenous agonists and may not have to be washed out once rescue has occurred and before activation by endogenous or exogenous agonists [56]. These studies suggest that rational design of these therapeutic agents, e.g. ones that do not compete with endogenous ligands, is likely to assist this therapeutic approach.
GPCRs are a large superfamily of membrane bound signaling proteins that are involved in the regulation of a wide range of physiological functions and constitute the most common target for therapeutic intervention [70]. GPCRs are among the most important drug targets for the pharmaceutical industry. Knowledge of the threedimensional structure of a protein is of utmost importance for drug discovery, as it serves as the basis for the identification of novel ligands by means of computational or in silico techniques, such as de novo design and virtual screening. 25% of the small molecule drugs approved in 2006 were discovered through structure-based drug discovery (SBDD) [70]. Consequently, target identification is a critical step following the discovery of small molecules that elicit a biological phenotype. There are a serial of technologies and approaches applied in new drug targets and biomarker identification, such as proteomics technology, systems biology approach, microRNA technology, and computational methods. Sugahara et al. have identified a large number of candidates for the target proteins specific to β1,4-galactosyltransferase-I (β4GalT-I) by comparative analysis of β4- GalT-I-deleted and wild-type mice using the LC/MSbased technique with the isotope-coded glycosylation site-specific tagging (IGOT) of lectin-captured N-glycopeptides [71]. Their approach to identify the target proteins in a proteome-scale offers common features and trends in the target proteins, which facilitate understanding of the mechanism that controls assembly of a particular glycan motif on specific proteins. Research on microRNAs (miRNAs) is a promising new research, providing novel insights into the pathogenesis of some diseases, biomarker identification, and treatment. The short (approximately 22 nucleotides), endogenous, widely distributed, single-stranded RNAs target both Mrna degradation and suppression of protein translation based on sequence complementarity between the miRNA and its targeted mRNA [72]. During evolution, RNA retroviruses or transgenes invaded the eukaryotic genome and inserted itself in the noncoding regions of DNA, acting as transposon-like jumping genes. MiRNAs are evolutionary conserved in animals and plants, and regulate specific target mRNAs at the post-transcriptional level, which involved in several biological processes, including development, cell differentiation, proliferation and apoptosis [73]. MiRNAs may be responsible for regulating the expression of nearly one-third of the genes in the human genome whereas very little is known about their biological functions and functional targets despite the identification of more than 1900 mature human miRNAs. Furthermore, miRNA deregulation often results in an impaired cellular function, and a disturbance of downstream gene regulation and signaling cascades, suggesting their implication in disease etiology. Koskun M et al. have identified dysregulated miRNAs in tissue samples of inflammatory bowel disease (IBD) patients, demonstrated similar differences in circulating miRNAs in the serum of IBD patients, and further discovered that miRNAs will aid in the early diagnosis of IBD and in the development of personalized therapies [73]. Additionally, our results represent a generalization of the validation and identification of GPCRs using computational methods. The sequence similarity and protein diversity exhibited intuitive behavior in the clustering when considering the underlying distributions. The computations involving the scoring matrix methods are a substantial test of such an approach, with explicit models built that cover roughly 90% of approved GPCRs in test sets. Our focus in previous work was methodological for prediction of active sites using the scoring matrix [40] while this approach showed that the scoring matrix methodology quantitatively outperformed molecular modeling methods for prediction target proteins. In the present work, the scoring matrix methods are used to predict potential proteins as well as prediction of active sites at a level of genome or amino acid sequences.
In conclusion, the present work seeks to provide an in silico model of known GPCR protein fishing technologies in order to rapidly fish out potential drug targets on the basis of amino acid sequences and seven TMs of GPCRs. Some scoring matrices were trained on 22 groups of GPCRs in the GPCRDB database. These models were employed to predict the GPCR proteins in two groups of test sets. On average, the mean correct rate of each TM of 38 GPCRs from T23 and T24 was found 62% and 57.5%, respectively, using training set 18
 ; the mean hit rate of each TM of 38 GPCRs from T23 and T24 was found 68.1% and 64.7%, respectively. Based on the scoring matrices of PreMod, the mean correct rate of each TM of GPCRs from T23 and T24 was found 62% and 62.04%, respectively; the mean hit rate of each TM of GPCRs from T23 and T24 was found 67.7% and 68.0%, respectively. The means of GPCRs in Test set 23 based on
  is close to those based on PreMod; whereas the means of GPCRs in Test set 24 based on
  is less than those based on PreMod. Moreover, the
  accuracy (“2”) and validity (“2 + 1”) rates of prediction all seven TMs of 38 GPCRs by the scoring matrices of PreMod are more than those by
 ,
,  and
and ; whereas the hit rates (94.74% and 97.37%) by PreMod are less than those of
  but bigger than those of
  and
and . This is the reason that we choose PreMod to predict some potential drug targets. 23 GPCR proteins in the sense chain of chromosome 19 constructing validation set were predicted and validated by PreMod whose hit rate is up to 95.65%. Further evaluation is under investigation.
5. ACKNOWLEDGEMENTS
This work was supported by a grant from Basic Scientific Research Expenses of Central University (020814360012) and National Key Technology R&D Program (2008BAI51B01).
REFERENCES
- Hopkins, A.L. and Groom, C.R. (2002) The druggable genome. Nature Reviews Drug Discovery, 1, 727-730. doi:/10.1038/nrd892
- Neves, S.R., Ram, P.T. and Iyengar, R. (2002) G protein pathways. Science, 296, 1636-1639. doi:/10.1126/science.1071550
- Hynes, R.O. (2002) Integrins: Bidirectional, allosteric signaling machines. Cell, 110, 673-687. doi:/10.1016/S0092-8674(02)00971-6
- Tilley, D.G. (2011) G protein-dependent and G proteinindependent signaling pathways and their impact on cardiac function. Circulation Research, 109, 217-230. doi:/10.1161/CIRCRESAHA.110.231225
- Shen, B., Delaney, M.K. and Du, X. (2012) Inside-out, outside-in, and inside-outside-in: G protein signaling in integrin-mediated cell adhesion, spreading, and retraction. Current Opinion in Cell Biology, 24, 600-606. doi:/10.1016/j.ceb.2012.08.011
- Jaffe, A.B. and Hall, A. (2005) Rho GTPases: Biochemistry and biology. Annual Review of Cell and Developmental Biology, 21, 247-269. doi:/10.1146/annurev.cellbio.21.020604.150721
- Bockaert, J. and Pin, J.P. (1999) Molecular tinkering of G protein-coupled receptors:an evolutionary success. The EMBO Journal, 18, 1723-1729. doi:/10.1093/emboj/18.7.1723
- Vassilatis. D.K., Hohmann, J.G., Zeng, H., Li, F., Ranchalis, J.E., Mortrud, M.T., Brown, A., Rodriguez, S.S., Weller, J.R., Wright, A.C., Bergmann, J.E. and Gaitanaris, G.A. (2003) The G protein-coupled receptor repertoires of human and mouse. Proceedings of the National Academy of Sciences of the United States of America, 100, 4903-4908. doi:/10.1073/pnas.0230374100
- Foord, S.M., Bonner, T.I., Neubig, R.R., Rosser, E.M., Pin, J.P., Davenport, A.P., Spedding, M. and Harmar, A.J. (2005) International Union of Pharmacology. XLVI. G protein-coupled receptor list. Pharmacological Reviews, 57, 279-288. doi:/10.1124/pr.57.2.5
- Horn, F., Weare, J., Beukers, M.W., Hörsch, S., Bairoch, A., Chen, W., Edvardsen, O., Campagne, F. and Vriend, G. (1998) GPCRDB: An information system for G protein-coupled receptors. Nucleic Acids Research, 26, 275- 279. doi:/10.1093/nar/26.1.275
- Attwood, T.K. and Findlay, J.B. (1994) Fingerprinting G-protein-coupled receptors. Protein Engineering, 7, 195-203. doi:/10.1093/protein/7.2.195
- Harmar, A.J. (2001) Family-B G-protein-coupled receptors. Genome Biology, 2, 3013.1-3013.10. doi:/10.1186/gb-2001-2-12-reviews3013
- Bräuner-Osborne, H., Wellendorph, P. and Jensen, A.A. (2007) Structure, pharmacology and therapeutic prospects of family C G-protein coupled receptors. Current Drug Targets, 8, 169-184. doi:/10.2174/138945007779315614
- Herskowitz, I. and Marsh, L. (1988) STE2 protein of Saccharomyces kluyveri is a member of the rhodopsin/ beta-adrenergic receptor family and is responsible for recognition of the peptide ligand alpha factor. Proceedings of the National Academy of Sciences of the United States of America, 85, 3855-3859. doi:/10.1073/pnas.85.11.3855
- Devreotes, P.N., Kimmel, A.R., Johnson, R.L., Klein, P.S., Sun, T.J. and Saxe III, C.L. (1988) A chemoattractant receptor controls development in Dictyostelium discoideum. Science, 241, 1467-1472. doi:/10.1126/science.3047871
- Malbon, C.C. (2004) Frizzleds: New members of the superfamily of G-protein-coupled receptors. Frontiers in Bioscience, 9, 1048-1058. doi:/10.2741/1308
- Taipale, J., Chen, J.K., Cooper, M.K., Wang, B., Mann, R.K., Milenkovic, L., Scott, M.P. and Beachy, P.A. (2000) Effects of oncogenic mutations in Smoothened and Patched can be reversed by cyclopamine. Nature, 406, 1005-1009. doi:/10.1038/35023008
- Buck, L. and Axel, R. (1991) A novel multigene family may encode odorant receptors: A molecular basis for odor recognition. Cell, 65, 175-187. doi:/10.1016/0092-8674(91)90418-X
- Mombaerts, P. (1999) Seven-transmembrane proteins as odorant and chemosensory receptors. Science, 286, 707- 711. doi:/10.1126/science.286.5440.707
- Firestein, S. (2000) The good taste of genomics. Nature 404, 552-553. doi:/10.1038/35007167
- Howard, A.D., McAllister, G., Feighner, S.D., Liu, Q., Nargund, R.P., Van der Ploeg, L.H. and Patchett, A.A. (2001) Orphan G-protein-coupled receptors and natural ligand discovery. Trends in Pharmacological Sciences, 22, 132-140. doi:/10.1016/S0165-6147(00)01636-9
- Lee, D.K., George, S.R., Evans, J.F., Lynch, K.R. and O’ Dowd, B.F. (2001) Orphan G protein-coupled receptors in the CNS. Current Opinion in Pharmacology, 1, 31-39. doi:/10.1016/S1471-4892(01)00003-0
- Filmore, D. (2004) It’s a GPCR world. Modern Drug Discovery, 11, 24-28.
- Wise, A., Gearing, K. and Rees, S. (2002) Target validation of G-protein coupled receptors. Drug Discovery Today, 7, 235-246. doi:/10.1016/S1359-6446(01)02131-6
- Venter, J.C., Adams, M.D., Myers, E.W., Li, P.W., Mural, R.J., Sutton, G.G., Smith, H.O., Yandell, M., Evans, C.A., Holt, R.A., Gocayne, J.D., Amanatides, P., Ballew, R.M., Huson, D.H., Wortman, J.R., Zhang, Q., Kodira, C.D., Zheng, X.H., Chen, L., Skupski, M., Subramanian, G., Thomas, P.D., Zhang, J., Gabor Miklos, G.L., Nelson, C., Broder, S., Clark, A.G., Nadeau, J., McKusick, V.A., Zinder, N., Levine, A.J., Roberts, R.J., Simon, M., Slayman, C., Hunkapiller, M., Bolanos, R., Delcher, A., Dew, I., Fasulo, D., Flanigan, M., Florea, L., Halpern, A., Hannenhalli, S., Kravitz, S., Levy, S., Mobarry, C., Reinert, K., Remington, K., Abu-Threideh, J., Beasley, E., Biddick, K., Bonazzi, V., Brandon, R., Cargill, M., Chandramouliswaran, I., Charlab, R., Chaturvedi, K., Deng, Z., Di Francesco, V., Dunn, P., Eilbeck, K., Evangelista, C., Gabrielian, A.E., Gan, W., Ge, W., Gong, F., Gu, Z., Guan, P., Heiman, T.J., Higgins, M.E., Ji, R.R., Ke, Z., Ketchum, K.A., Lai, Z., Lei, Y., Li, Z., Li, J., Liang, Y., Lin, X., Lu, F., Merkulov, G.V., Milshina, N., Moore, H.M., Naik, A.K., Narayan, V.A., Neelam, B., Nusskern, D., Rusch, D.B., Salzberg, S., Shao, W., Shue, B., Sun, J., Wang, Z., Wang, A., Wang, X., Wang, J., Wei, M., Wides, R., Xiao, C., Yan, C., Yao, A., Ye, J., Zhan, M., Zhang, W., Zhang, H., Zhao, Q., Zheng, L., Zhong, F., Zhong, W., Zhu, S., Zhao, S., Gilbert, D., Baumhueter, S., Spier, G., Carter, C., Cravchik, A., Woodage, T., Ali, F., An, H., Awe, A., Baldwin, D., Baden, H., Barnstead, M., Barrow, I., Beeson, K., Busam, D., Carver, A., Center, A., Cheng, M.L., Curry, L., Danaher, S., Davenport, L., Desilets, R., Dietz, S., Dodson, K., Doup, L., Ferriera, S., Garg, N., Gluecksmann, A., Hart, B., Haynes, J., Haynes, C., Heiner, C., Hladun, S., Hostin, D., Houck, J., Howland, T., Ibegwam, C., Johnson, J., Kalush, F., Kline, L., Koduru, S., Love, A., Mann, F., May, D., McCawley, S., McIntosh, T., McMullen, I., Moy, M., Moy, L., Murphy, B., Nelson, K., Pfannkoch, C., Pratts, E., Puri, V., Qureshi, H., Reardon, M., Rodriguez, R., Rogers, Y.H., Romblad, D., Ruhfel, B., Scott, R., Sitter, C., Smallwood, M., Stewart, E., Strong, R., Suh, E., Thomas, R., Tint, N.N., Tse, S., Vech, C., Wang, G., Wetter, J., Williams, S., Williams, M., Windsor, S., Winn-Deen, E., Wolfe, K., Zaveri, J., Zaveri, K., Abril, J.F., Guigo, R., Campbell, M.J., Sjolander, K.V., Karlak, B., Kejariwal, A., Mi, H., Lazareva, B., Hatton, T., Narechania, A., Diemer, K., Muruganujan, A., Guo, N., Sato, S., Bafna, V., Istrail, S., Lippert, R., Schwartz, R., Walenz, B., Yooseph, S., Allen, D., Basu, A., Baxendale, J., Blick, L., Caminha, M., Carnes-Stine, J., Caulk, P., Chiang, Y.H., Coyne, M., Dahlke, C., Mays, A., Dombroski, M., Donnelly, M., Ely, D., Esparham, S., Fosler, C., Gire, H., Glanowski, S., Glasser, K., Glodek, A., Gorokhov, M., Graham, K., Gropman, B., Harris, M., Heil, J., Henderson, S., Hoover, J., Jennings, D., Jordan, C., Jordan, J., Kasha, J., Kagan, L., Kraft, C., Levitsky, A., Lewis, M., Liu, X., Lopez, J., Ma, D., Majoros, W., McDaniel, J., Murphy, S., Newman, M., Nguyen, T., Nguyen, N., Nodell, M., Pan, S., Peck, J., Peterson, M., Rowe, W., Sanders, R., Scott, J., Simpson, M., Smith, T., Sprague, A., Stockwell, T., Turner, R., Venter, E., Wang, M., Wen, M., Wu, D., Wu, M., Xia, A., Zandieh, A. and Zhu, X. (2001) The sequence of the human genome. Science, 1304-1351. doi:/10.1126/science.1058040
- Meneses, A. (1999) 5HT system and cognition. Neuroscience & Biobehavioral Reviews, 23, 1111-1125. doi:/10.1016/S0149-7634(99)00067-6
- Lander, E.S., Linton, L.M., Birren, B., Nusbaum, C., Zody, M.C., Baldwin, J., Devon, K., Dewar, K., Doyle, M., FitzHugh, W., Funke, R., Gage, D., Harris, K., Heaford, A., Howland, J., Kann, L., Lehoczky, J., LeVine, R., McEwan, P. and McKernan, K. (2001) Initial sequencing and analysis of the human genome. Nature, 409, 860-921. doi:/10.1038/35057062
- O’Dowd, B.F., Ji, X., Alijaniaram, M., Nguyen, T. and George S.R. (2006) A novel drug screening assay for G protein-coupled receptors. In: Rognan, D., Mannhold, R., Kubinyi, H. and Folkers, G., Eds., Ligand Design for G Protein-Coupled Receptors (Methods and Principles in Medicinal Chemistry), Wiley-VCH Verlag GmbH & Co. KGaA, Weinheim, 51-60.
- Baldwin, J.M. (1993) The probable arrangement of the helices in G protein-coupledreceptors. The EMBO Journal, 12, 1693-1703.
- Grigorieff, N., Ceska, T.A., Downing, K.H., Baldwin, J.M. and Henderson, R. (1996) Electron-crystallographic refinement of the structure of bacteriorhodopsin. Journal of Molecular Biology, 259, 393-421. doi:/10.1006/jmbi.1996.0328
- Kimura, Y., Vassylyev, D.G., Miyazawa, A., Kidera, A., Matsushima, M., Mitsuoka, K., Murata, K., Hirai, T. and Fujiyoshi, Y. (1997) Surface of bacteriorhodopsin revealed by high-resolution electron crystallography. Nature, 389, 206-211. doi:/10.1038/38323
- Pebay-Peyroula, E., Rummel, G., Rosenbusch, J.P. and Landau, E.M. (1997) X-ray structure of bacteriorhodopsin at 2.5 angstroms from microcrystals grown in lipidic cubic phases. Science, 277, 1676-1681. doi:/10.1126/science.277.5332.1676
- Palczewski, K., Kumasaka, T., Hori, T., Behnke, C.A., Motoshima, H., Fox, B.A., Trong, I.L., Teller, D.C., Okada, T., Stenkamp, R.E., Yamamoto, M. and Miyano, M. (2000) Crystal structure of rhodopsin: A G proteincoupled receptor. Science, 289, 739-745. doi:/10.1126/science.289.5480.739
- Rasmussen, S.G., Choi, H.J., Rosenbaum, D.M., Kobilka, T.S., Thian, F.S., Edwards, P.C., Burghammer, M., Ratnala, V.R., Sanishvili, R., Fischetti, R.F., Schertler, G.F., Weis, W.I. and Kobilka, B.K. (2007) Crystal structure of the human β2-adrenergic G-protein-coupled receptor. Nature, 450, 383-387. doi:/10.1038/nature06325
- Cherezov, V., Rosenbaum, D.M., Hanson, M.A., Rasmussen, S.G., Thian, F.S., Kobilka, T.S., Choi, H.J., Kuhn, P., Weis, W.I., Kobilka, B.K. and Stevens, R.C. (2007) High-resolution crystal structure of an engineered human β2-adrenergic G protein-coupled receptor. Science, 318, 1258-1265. doi:/10.1126/science.1150577
- Drews, J. (1996) Genomic sciences and the medicine of tomorrow. Nature Biotechnology, 14, 1516-1518. doi:/10.1038/nbt1196-1516
- Yang, J. and Liu, C.Q. (2000) Molecular modeling on human CCR5 receptors and complex with CD4 antigens and HIV-1 envelope Glycoprotein gp120. Acta Pharmacologica Sinica, 20, 29-34.
- Yang, J., Zhang, Y.W., Huang, J.F., Zhang, Y.P. and Liu, C.Q. (2000) Structure analysis of CCR5 from human and primates. Journal of Molecular Structure: Theochem, 505, 199-210. doi:/10.1016/S0166-1280(99)00393-0
- Yang, J. and Hua, W.Y. (1996). Basic pharmacophore for some antithrombotic agents with combined thromboxane receptor antagonists (TXRA)/thromboxine synthase inhibitor (TXSI) activities. Drug Development Research, 39, 197-200. doi:/10.1002/(SICI)1098-2299(199610)39:2<197::AID-DDR14>3.0.CO;2-9
- Zhan, C.Y., Yang, J., Dong, X.C. and Wang, Y.L. (2007) Molecular modeling of purinergic receptor P2Y12 and interaction with its antagonists. Journal of Molecular Graphics and Modelling, 26, 20-31. doi:/10.1016/j.jmgm.2006.09.006
- Xiao, Y.D., Harris, R., Bayram, E., Santago II, P. and Schmitt, J.D. (2006) Supervised self-organizing maps in drug discovery. 2. Improvements in descriptor selection and model validation. Journal of Chemical Information and Modeling, 46, 137-144. doi:/10.1021/ci0500841
- Yang, J., Dong, X.C. and Leng, Y. (2006) Application of FTTP to alpha-helix or beta-strand motifs. Journal of Theoretical Biology, 242, 199-219. doi:/10.1016/j.jtbi.2006.02.014
- Yang, J., Dong, X.C. and Leng, Y. (2006) Conformation biases of amino acids based on tripeptide microenvironment from PDB database. Journal of Theoretical Biology, 240, 374-384. doi:/10.1016/j.jtbi.2005.09.025
- Yu, J.M., Li, D.D., Xu, Z.Q., Cheng, W.X., Zhang, Q., Li, H.Y., Cui, S.X., Yang, M.-J., S.H., Fang, Z.Y. and Duan, Z.J. (2008) Human bocavirus infection in children hospitalized with acute gastroenteritis in China. Journal of Clinical Virology, 42, 280-285. doi:/10.1016/j.jcv.2008.03.032
- Steiger, N.M., Lada, E.K., Wilson, J.R., Alexopoulos, C., Goldsman, D. and Zouaoui, F. (2002) ASAP2: An Improved batch means procedure for simulation output analysis. In: Yücesan, E., Chen, C.-H., Snowdon, J.L. and Charnes, J.M., Eds., Proceedings of the 2002 Winter Simulation Conference, Piscataway, New Jersey, 336- 344.
- Attwood, T.K., Croning, M.D. and Gaulton, A. (2002) Deriving structural and functional insights from a ligandbased hierarchical classification of G protein-coupled receptors. Protein Engineering, 15, 7-12. doi:/10.1093/protein/15.1.7
- Huang, J.H., Cao, D.S., Yan, J., Xu, Q.S., Hu, Q.N. and Liang, Y.Z. (2012) Using core hydrophobicity to identify phosphorylation sites of human G protein-coupled receptors. Biochimie, 94, 1697-1704. doi:/10.1016/j.biochi.2012.03.022
- Manning, G., Whyte, D.B., Martinez, R., Hunter, T. and Sudarsanam, S. (2002) The protein kinase complement of the human genome. Science, 298, 1912-1934. doi:/10.1126/science.1075762
- Pitcher, J.A., Freedman, N.J. and Lefkowitz, R.J. (1998) G protein-coupled receptor kinases. Annual Review of Biochemistry, 67, 653-692. doi:/10.1146/annurev.biochem.67.1.653
- Tobin, A.B., Butcher, A.J. and Kong, K.C. (2008) Location, location, location site-specific GPCR phosphorylation offers a mechanism for cell-type-specific signaling. Trends in Pharmacological Sciences, 29, 413-420. doi:/10.1016/j.tips.2008.05.006
- Hauser, F., Cazzamali, G., Williamson, M., Blenau, W. and Grimmelikhuijzen, J.P. (2006) A review of neurohormone GPCRs present in the fruitfly Drosophila melanogaster and the honey bee Apis mellifera. Progress in Neurobiology, 80, 1-19. doi:/10.1016/j.pneurobio.2006.07.005
- Meyer, J.M., Ejendal, K.F., Avramova, L.V., GarlandKuntz, E.E., Giraldo-Calderón, G.I., Brust, T.F., Watts, V.J. and Hill, C.A. (2012) A “genome-to-lead” approach for insecticide discovery: Pharmacological characterization and screening of Aedes aegypti D(1)-like dopamine receptors. PLOS Neglected Tropical Diseases 6, e1478. doi:/10.1371/journal.pntd.0001478
- Gamo, F.J., Sanz, L.M., Vidal, J., de Cozar, C., Alvarez, E., Lavandera, J.L., Vanderwall, D.E., Green, D,V., Kumar, V., Hasan, S., Brown, J.R., Peishoff, C.E., Cardon, L.R. and Garcia-Bustos, J.F. (2010) Thousands of chemical starting points for antimalarial lead identification. Nature, 465, 305-312. doi:/10.1038/nature09107
- Hill, C.A., Fox, A.N., Pitts, R.J., Kent, L.B., Tan, P.L., Chrystal, M.A., Cravchik, A., Collins, F.H., Robertson, H.M. and Zwiebel, L.J. (2002) G protein-coupled receptors in Anopheles gambiae. Science, 298, 176-178. doi:/10.1126/science.1076196
- Gruber, C.W., Muttenthaler, M. and Freissmuth, M. (2010) Ligand-based peptide design and combinatorial peptide libraries to target G protein-coupled receptors. Current Pharmaceutical Design, 16, 3071-3088. doi:/10.2174/138161210793292474
- Janovick, J.A., Park, B.S. and Conn, P.M. (2011) Therapeutic rescue of misfolded mutants: Validation of primary high throughput screens for identification of pharmacoperone drugs. PLoS One, 6, e22784. doi:/10.1371/journal.pone.0022784
- Janovick, J.A., Patny, A., Mosley, R., Goulet, M.T., Altman, M.D., Rush 3rd, T.S., Cornea. A. and Conn, P.M. (2009) Molecular mechanism of action of pharmacoperone rescue of misrouted GPCR mutants: The GnRH receptor. Molecular Endocrinology, 23, 157-168. doi:/10.1210/me.2008-0384
- Janovick, J.A., Maya-Nunez, G. and Conn, P.M. (2002) Rescue of hypogonadotropic hypogonadism-causing and manufactured GnRH receptor mutants by a specific proteinfolding template: misrouted proteins as a novel disease etiology and therapeutic target. The Journal of Clinical Endocrinology & Metabolism, 87, 3255-3262. doi:/10.1210/jc.87.7.3255
- Galietta, L.J., Springsteel, M.F., Eda, M., Niedzinski, E.J., By, K., Haddadin, M.J., Kurth, M.J., Nantz, M.H. and Verkman, A.S. (2001) Novel CFTR chloride channel activators identified by screening of combinatorial libraries based on flavone and benzoquinolizinium lead compounds. The Journal of Biological Chemistry, 276, 19723-19728. doi:/10.1074/jbc.M101892200
- Ulloa-Aguirre, A., Janovick, J.A., Leanos-Miranda, A. and Conn, P.M. (2003) Misrouted cell surface receptors as a novel disease aetiology and potential therapeutic target: The case of hypogonadotropic hypogonadism due to gonadotropin-releasing hormone resistance. Expert Opinion on Therapeutic Targets, 7, 175-185. doi:/10.1517/14728222.7.2.175
- Bernier, V., Lagace, M., Bichet, D.G. and Bouvier, M. (2004) Pharmacological chaperones: Potential treatment for conformational diseases. Trends in Endocrinology & Metabolism, 15, 222-228. doi:/10.1016/j.tem.2004.05.003
- Noorwez, S.M., Malhotra, R., McDowell, J.H., Smith, K.A., Krebs, M.P. and Kaushal, S. (2004) Retinoids assist the cellular folding of the autosomal dominant retinitis pigmentosa opsin mutant P23H. The Journal of Biological Chemistry, 279, 16278-16284. doi:/10.1074/jbc.M312101200
- Tveten, K., Holla, Ø.L., Ranheim, T., Berge, K.E., Leren, T.P. and Kulseth, M.A. (2007) 4-Phenylbutyrate restores the functionality of a misfolded mutant low-density lipoprotein receptor. FEBS Journal, 274, 1881-1893. doi:/10.1111/j.1742-4658.2007.05735.x
- Benedek, G.B., Pande, J., Thurston, G.M. and Clark, J.I. (1999) Theoretical and experimental basis for the inhibition of cataract. Progress in Retinal and Eye Research, 18, 391-402. doi:/10.1016/S1350-9462(98)00023-8
- Heiser, V., Scherzinger, E., Boeddrich, A., Nordhoff, E., Lurz, R., Schugardt, N., Lehrach, H. and Wanker, E.E. (2000) Inhibition of huntingtin fibrillogenesis by specific antibodies and small molecules: Implications for Huntington’s disease therapy. Proceedings of the National Academy of Sciences of the United States of America, 97, 6739-6744. doi:/10.1073/pnas.110138997
- Muchowski, P.J. and Wacker, J.L. (2005) Modulation of neurodegeneration by molecular chaperones. Nature Reviews Neuroscience, 6, 11-22. doi:/10.1038/nrn1587
- Forloni, G., Terreni, L., Bertani, I., Fogliarino, S., Invernizzi, R., Assini, A., Ribizzi, G., Negro, A., Calabrese, E., Volonté, M.A., Mariani, C., Franceschi, M., Tabaton, M. and Bertoli, A. (2002) Protein misfolding in Alzheimer’s and Parkinson’s disease: Genetics and molecular mechanisms. Neurobiology of Aging, 23, 957-976. doi:/10.1016/S0197-4580(02)00076-3
- Peng, Y., Li, C., Chen, L., Sebti, S. and Chen, J. (2003) Rescue of mutant p53 transcription function by ellipticine. Oncogene, 22, 4478-4487. doi:/10.1038/sj.onc.1206777
- Janovick, J.A., Goulet, M., Bush, E., Greer, J., Wettlauffer, D.G. and Conn, P.M. (2003) Structure-activity relations of successful pharmacologic chaperones for rescue of naturally occurring and manufactured mutants of the gonadotropin-releasing hormone receptor. Journal of Pharmacology and Experimental Therapeutics, 305, 608- 614. doi:/10.1124/jpet.102.048454
- Costanzi, S. (2010) Modeling G protein-coupled receptors: A concrete possibility. Chimica oggi, 28, 26-31.
- Sugahara, D., Kaji, H., Sugihara, K., Asano, M. and Narimatsu, H. (2012) Large-scale identification of target proteins of a glycosyltransferase isozyme by Lectin-IGOTLC/MS, an LC/MS-based glycoproteomic approach. Scientific Reports, 2, 680. doi:/10.1038/srep00680
- Ying, S.Y., Chang, D.C. and Lin, S.L. (2013) The MicroRNA. Methods in Molecular Biology, 936, 1-19. doi:/10.1007/978-1-62703-083-0_1
- Coskun, M., Bjerrum, J.T., Seidelin, J.B. and Nielsen, O.H. (2012) MicroRNAs in inflammatory bowel disease— pathogenesis, diagnostics and therapeutics. World Journal of Gastroenterology, 18, 4629-4634. doi:/10.3748/wjg.v18.i34.4629
Appendix: Algorithm and VBA Source Code of Scoring Matrix
Dim n As Integer, i As Integer, j As Integer, l As Integer, na As Integer, nt As Integer, nc As Integer, ng As Integer n = 1 Do Until Cells(n, 1) = ""
n = n + 1 Loop n = n - 1 For i = 1 To n - 1
For j = i + 1 To n
If Len(Cells(i, 1)) <> Len(Cells(j, 1)) Then
MsgBox "Your sequences are not entered with equal length!"
Exit For
End If
Next j
If j <> n Then
Exit For
End If
If Len(Cells(n, 1)) <> Len(Cells(1, 1)) Then
Exit For
End If Next i If i <> n - 1 And j <> n Then
Cells(n + 2, 2) = "A"
Cells(n + 3, 2) = "T"
Cells(n + 4, 2) = "C"
Cells(n + 5, 2) = "G"
l = Len(Cells(1, 1))
For i = 3 To l + 2
Cells(n + 1, i) = i - 2
Cells(n + 1, i). NumberFormatLocal = "0"
Next i
For i = 1 To l
For j = 1 To n
If Asc(Mid(Cells(j, 1), i, 1)) = 97 Then
na = na + 1
End If
If Asc(Mid(Cells(j, 1), i, 1)) = 65 Then
na = na + 1
End If
If Asc(Mid(Cells(j, 1), i, 1)) = 116 Then
nt = nt + 1
End If
If Asc(Mid(Cells(j, 1), i, 1)) = 84 Then
nt = nt + 1
End If
If Asc(Mid(Cells(j, 1), i, 1)) = 99 Then
nc = nc + 1
End If
If Asc(Mid(Cells(j, 1), i, 1)) = 67 Then
nc = nc + 1
End If
If Asc(Mid(Cells(j, 1), i, 1)) = 103 Then
ng = ng + 1
End If
If Asc(Mid(Cells(j, 1), i, 1)) = 71 Then
ng = ng + 1
End If
Next j
Cells(n + 2, i + 2) = na / (n * l)
Cells(n + 3, i + 2) = nt / (n * l)
Cells(n + 4, i + 2) = nc / (n * l)
Cells(n + 5, i + 2) = ng / (n * l)
Cells(n + 2, i + 2). NumberFormatLocal = "0.00"
Cells(n + 3, i + 2).NumberFormatLocal = "0.00"
Cells(n + 4, i + 2). NumberFormatLocal = "0.00"
Cells(n + 5, i + 2). NumberFormatLocal = "0.00"
na = 0
nt = 0
nc = 0
ng = 0
Next i
Cells(1, 1).Select
End If End Sub Appendix 1. G-protein couple receptors (GPCRs) of GPCRs’ database consisting of training set/test sets.