Natural Science
Vol.4 No.11(2012), Article ID:24591,6 pages DOI:10.4236/ns.2012.411109
Southward surface flow in the central South Pacific
![]()
4632 North Lane, Del Mar, USA; Ukernken@aol.com
Received 11 September 2012; revised 13 October 2012; accepted 27 October 2012
Keywords: Southward Surface Flow; Central South Pacific
ABSTRACT
A large-scale surface flow with a southward component is proposed for the central South Pacific Ocean based on an interpretation of existing closely spaced and accurately measured temperatures and salinities along two latitudes in two different southern hemisphere winters: 28˚S (Scorpio) and five degrees south of that (WOCE). Such a southward flow is not predicted from theory nor is it shown on current charts and globes. The observed longitudinal maximum in surface temperature along 28˚S is centered around 130˚W and has an amplitude of at least 5˚C and an east/west range of about 60˚ of longitude. This striking feature is most easily explained by horizontal transport from latitudes closer to the equator. Since temperature atlases show that equatorial surface temperatures are always highest in the west, the origin of the warm water probably is toward the western side of the ocean as well. Thus the surface flow surrounding the longitudinal temperature maximum should be directed to the southeast. Where the surface temperatures are maximum the mixed layer depths are relatively large in a convex downward lens with maximum depths of 100 m; a correlation that is consistent with warm water moving south and being cooled from above. Salinities are maximum near the temperature maximum, also suggesting that the source of the surface flow is at low latitudes, where evaporation is usually expected to exceed precipitation. It is conjectured that the large-scale southeastward flow of the South Pacific is the analogue of the northeastward wide warm current off California documented over 30 years ago.
1. INTRODUCTION
A large-scale southward surface flow in the middle of the South Pacific is unexpected. For example, no globes or atlases show such a feature. It does not fit in with the customary pattern of gyres, the length of ocean basins. Also the classical and currently popular wind-driven circulation theory does not predict it, given the present knowledge of the mean winds in the area. In fact, this classical theory forecasts equatorward rather than poleward flow, vertically integrated, in the center of the South Pacific. Therefore, a graduate student in any oceanographic institution will not at present be told of such a southward flow nor will he be led to try to find it in this part of the ocean.
Nevertheless, an interpretation of solid evidence, consisting mainly of a coast to coast east/west line of accurately measured and closely spaced sea surface temperatures along 28˚S from the Scorpio Expedition is presented and discussed here from which the above conclusion is hard to escape [1]. Well defined is a large-scale maximum in surface temperature in the east/central part of the basin (Figure 1). Most of the highest temperatures in the whole section are contained within this maximum. To the east, west and underneath the maximum, below about 100 m, the temperatures are colder, and the air above is colder too because the measurements took place in the southern hemisphere winter. One very reasonable conclusion as to how that maximum was created involves horizontal advection from lower latitudes. Though reasonably strong already, this hypothesis will gain further backing in what follows.
Other data, principally salinity, taken simultaneously, lend support to the same interpretation that the temperatures of Figure 1 suggest, as pointed out later. These data from Scorpio are not new, having been obtained on an oceanographic cruise in 1967, but they come from high quality hydrographic instruments, and the main features they show can be trusted to be real. For example, the amplitude of the large-scale temperature maximum of interest here is at least 5˚C whereas temperature was measured to the nearest 0.01˚C, which is overkill for the study below.
Since the postulated southward flow comes mainly from temperature and salinity data, there can be no definite estimate of the current’s speed at this time. However, the location of the flow, as well as its width, depth and general direction are pretty well delineated from only
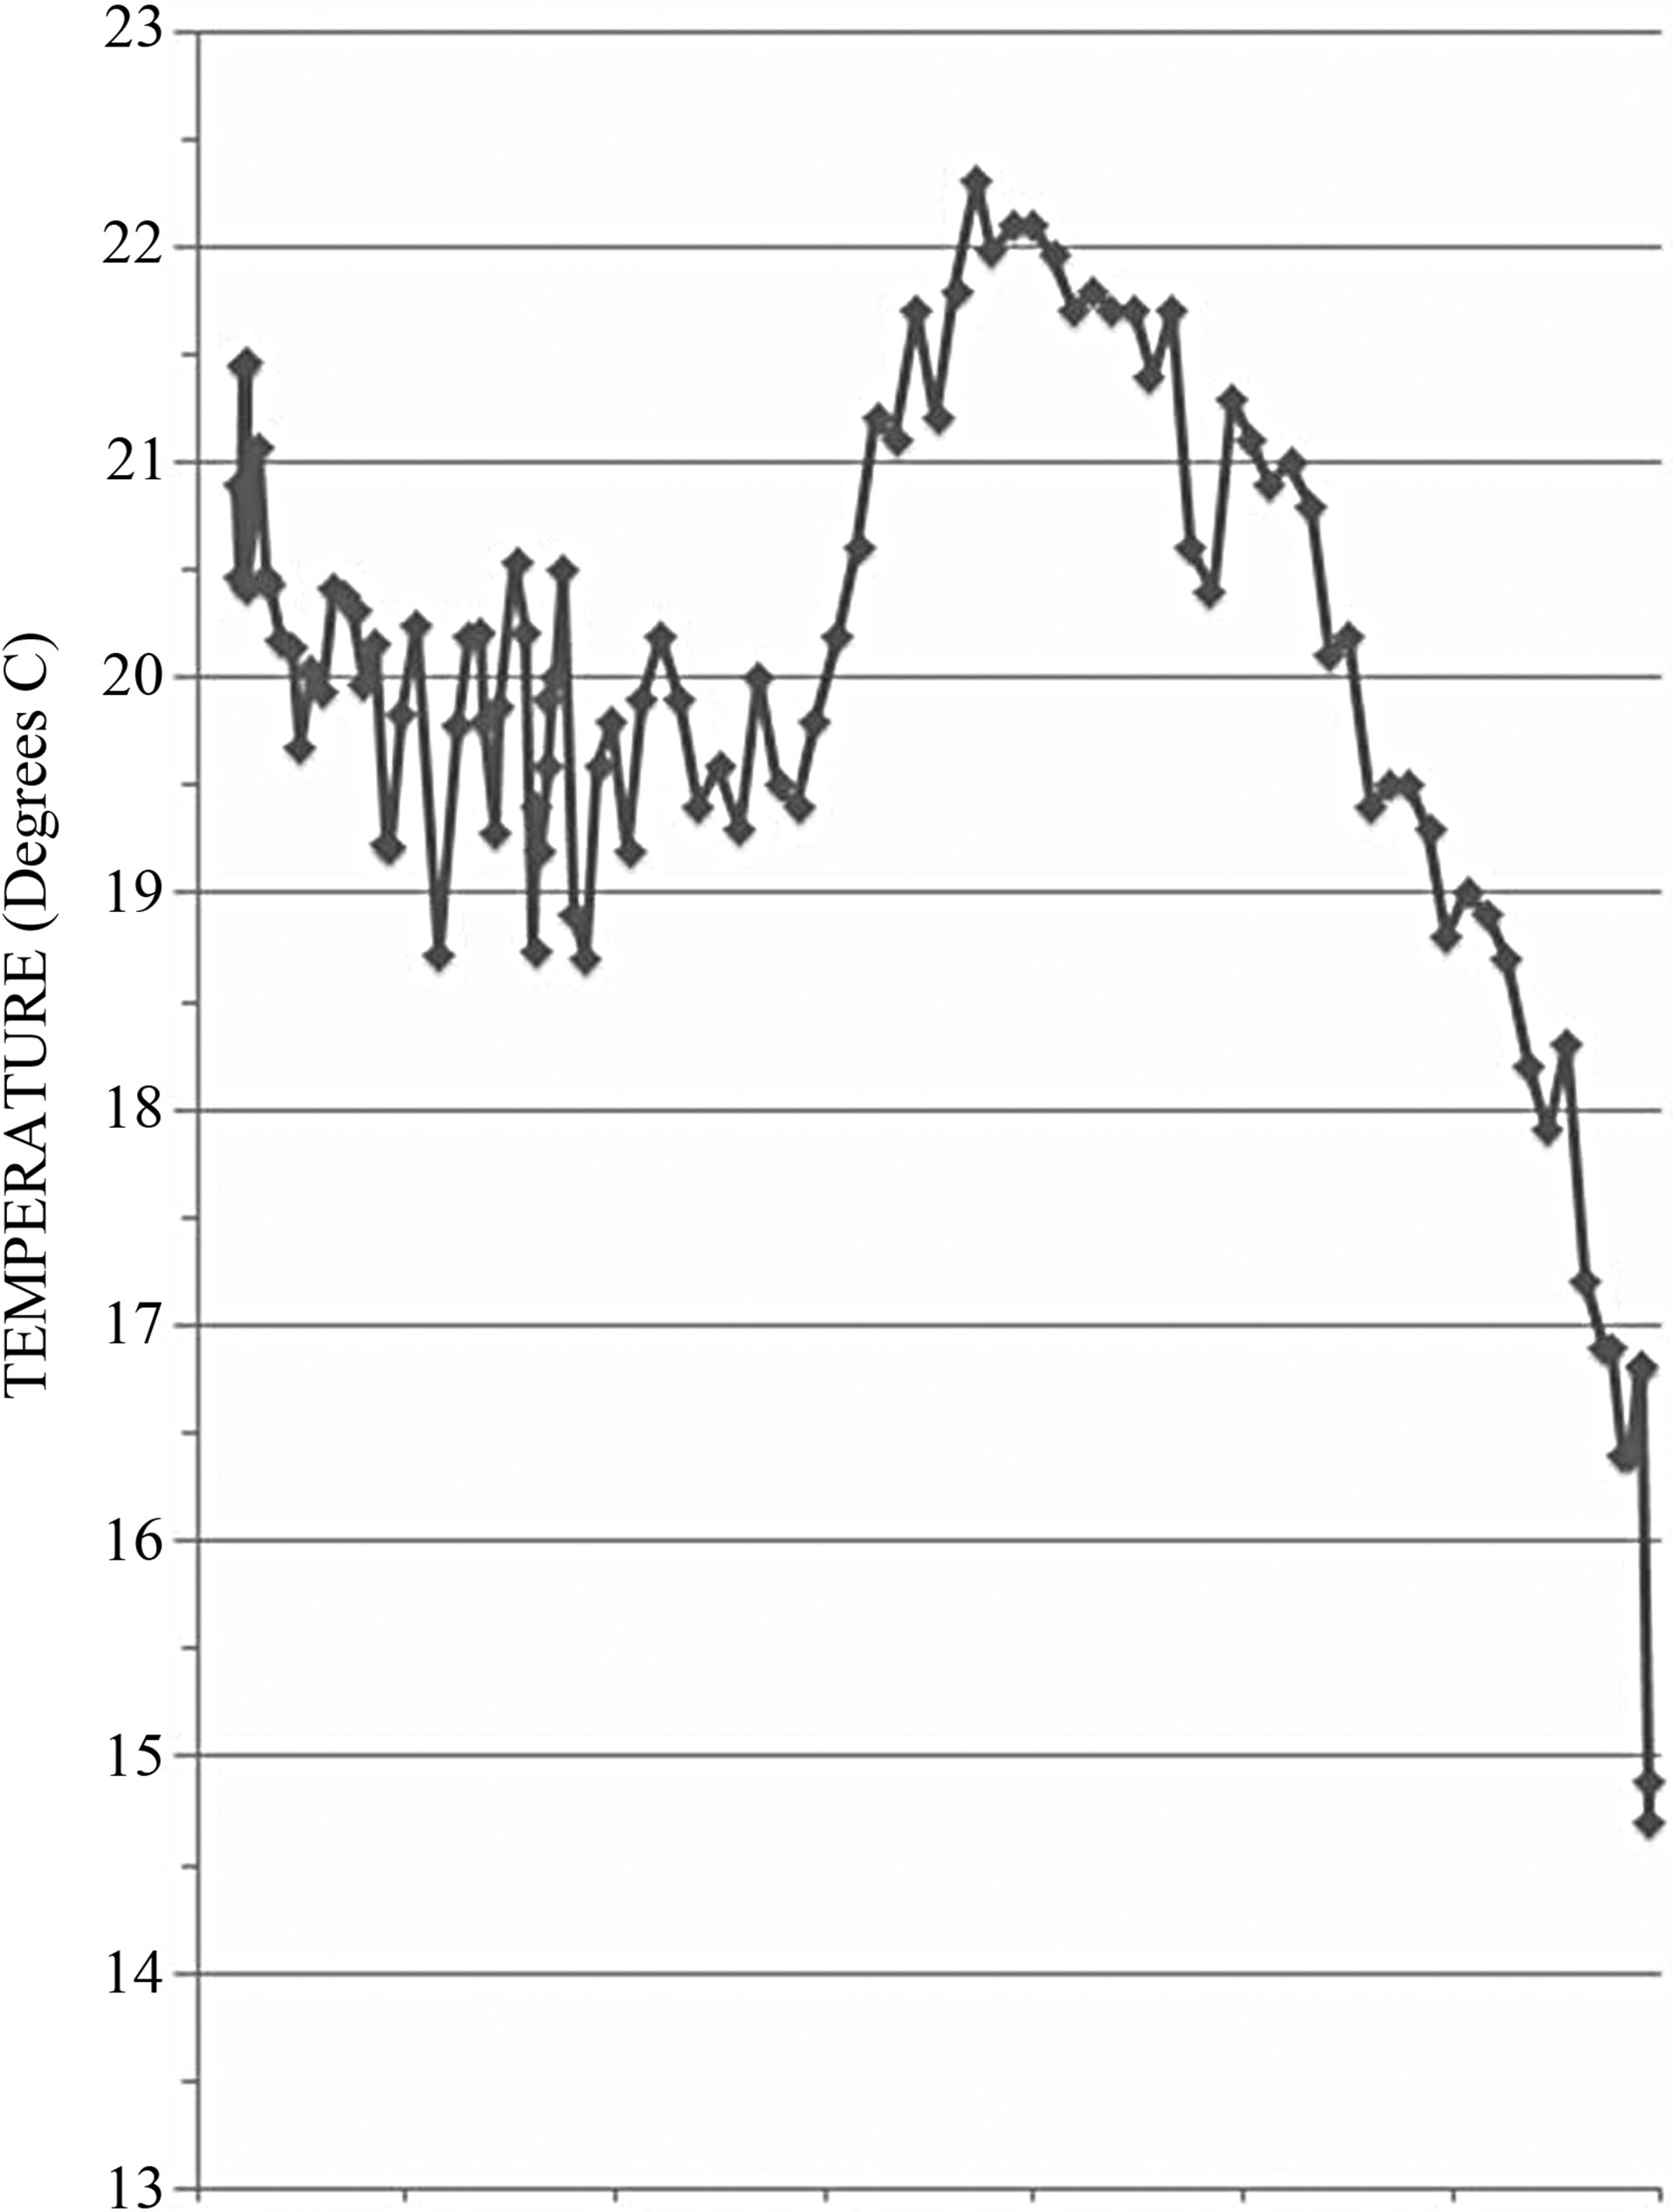
Figure 1. Surface temperature as a function of longitude at 28˚15'S between Australia on the left and South America on the right.
two east/west hydrographic lines: the one from Scorpio and the other from a later expedition about five degrees south of the Scorpio section, as will become clear.
In the North Pacific a large-scale (4000 km) northeastward flow of warm surface water has been described; it occurs off the coast of California [2]. The concept of a very wide northeastward drift was originally founded on millions of ship-injection temperatures averaged over five degree squares and one month intervals, covering a large part of the North Pacific during a thirty year period. What the ship-injection temperatures lack in accuracy, being individually only good to one degree Fahrenheit, they make up for in quantity. These ship-injection temperatures exhibited a large-scale maximum in surface temperature in the eastern North Pacific along 35˚N and 40˚N in every month of all 30 years, establishing the permanence of the maximum [2]. A coast to coast hydrographic section through the maximum along 35˚N in March and April, 1976, confirmed its reality and shallowness (depths less than or equal to about 100 m from the surface). After seven years of taking and analyzing data and considering all the possibilities for explanations, I finally felt able to say that the longitudinal temperature maximum is the surface signature of a very wide warm surface and near surface flow heading northeast off California.
Because of the previous studies of the mid-latitude poleward surface flow in the eastern North Pacific a search was recently made for something similar in the South Pacific. What follows is the result of that search. Why it took so long to look for the possibility of an analogous South Pacific flow is not so easily explained. Actually, a small start toward the present interpretation of the Scorpio surface and near surface data along the eastern half of the 28˚S section occurred earlier [3].
2. SURFACE TEMPERATURES ALONG 28˚S
During the midst of the southern hemisphere winter of 1967, in June and July, an east/west line of surface temperatures (Figure 1) was taken as part of the Scorpio II Expedition along 28˚15'S. Stretching from South America to Australia the measurement stations were closely spaced, the average separation between them being about 1.5 degrees of longitude. This turns out to be more than adequate for defining the main temperature maximum.
Jumping boldly out of the middle of the graph of Figure 1 is the primary feature to note: the large-scale longitudinal maximum in surface temperature. In fact, the greatest number of the highest temperature values in the whole section is contained within this broad maximum, which is centered slightly east of the middle of the basin. There can be no doubt about the reality of the maximum. What cannot be determined from a single section, of course, is any estimate of its permanence. Also if the maximum has seasonal variations in amplitude and location, by analogy with a similar feature in the North Pacific, these cannot be determined from one cruise. Two cruises would not suffice, no matter how accurate or closely spaced the measurements are.
Non-seasonal variations are a possibility too. One that comes to mind in the South Pacific is the El Nino, a phenomenon in which warm water temporarily replaces the normally cold water along the coast of South America with devastating consequences for the biology of the region.
Even if the large-scale temperature maximum of Figure 1 only existed for a few months, how is it to be explained? Logically the source of the warm water should be at or near the equator. Thus, Figure 1 can essentially stand alone, without requiring a detailed discussion, but other ancillary data will be brought in to help in understanding the remarkable temperature distribution, and more explaining will be coming.
Considering just the surface temperatures by themselves, how did all that warm water surrounding the temperature maximum get to the middle of the ocean during the height of the cooling season? There appears to be no obvious way to create the temperature maximum by in situ heating and/or cooling coupled with vertical wind mixing and stirring, but with no advection, without straining the imagination. Therefore, the warm water almost certainly must have been transported horizontally into that location from a place that is even warmer, i.e. a latitude lower than 28˚S, since some heat undoubtedly escaped into the atmosphere during transportation. A current with a southward component surrounding the maximum in Figure 1 is thereby inferred from the surface temperatures alone.
Some theoreticians may prefer to think that the massive amount of warm water, in a longitude band of about 60 degrees and from the surface down to about 100 m (see the discussion of Figure 4 in the next section), was somehow bodily trucked into place by a planetary wave mechanism, but that is their privilege. For the North Pacific temperature maximum a wave phenomenon was never considered to be a plausible explanation. Equally farfetched to me is the notion that there is some kind of vertical physical connection between the surface layer, that includes the temperature maximum, and variations of the topography of the ocean’s bottom directly underneath. If the surface temperature maximum occurs over a ridge, as it does in the WOCE line discussed below, that is probably just a coincidence. The location of the surface flow undoubtedly has more to do with the horizontal driving forces at and near the surface as well as the Coriolis force that tries to shift the current sideways.
It is well known from the temperature atlases that the warmest surface temperatures at any time of the year, and in both North and South Pacific, are in the western equatorial waters, and the coolest are in the eastern tropical Pacific [4]. Consequently, the source of the warm water in Figure 1 might be not only at a lower latitude but also toward the western side of the ocean. In other words, the mean direction of flow at the temperature maximum should be toward the southeast.
For completeness, in the western half of Figure 1 is a temperature variation smaller in amplitude (about 1˚C) and much smaller in longitude (only about 5 degrees) than the large-scale one in the east discussed above. This small-scale variation may be real also and probably deserves to be studied separately. Notice that embedded within the large-scale maximum in the east there are apparently some smaller scales, but they are not very remarkable and do not attract attention away from the coherence of the main maximum.
3. SURFACE SALINITY, DENSITY, MIXED LAYER DEPTH AT 28˚S
Surface salinities along 28˚S (Figure 2) have a largescale maximum with the highest values anywhere in the section located in the region of the large-scale lon-
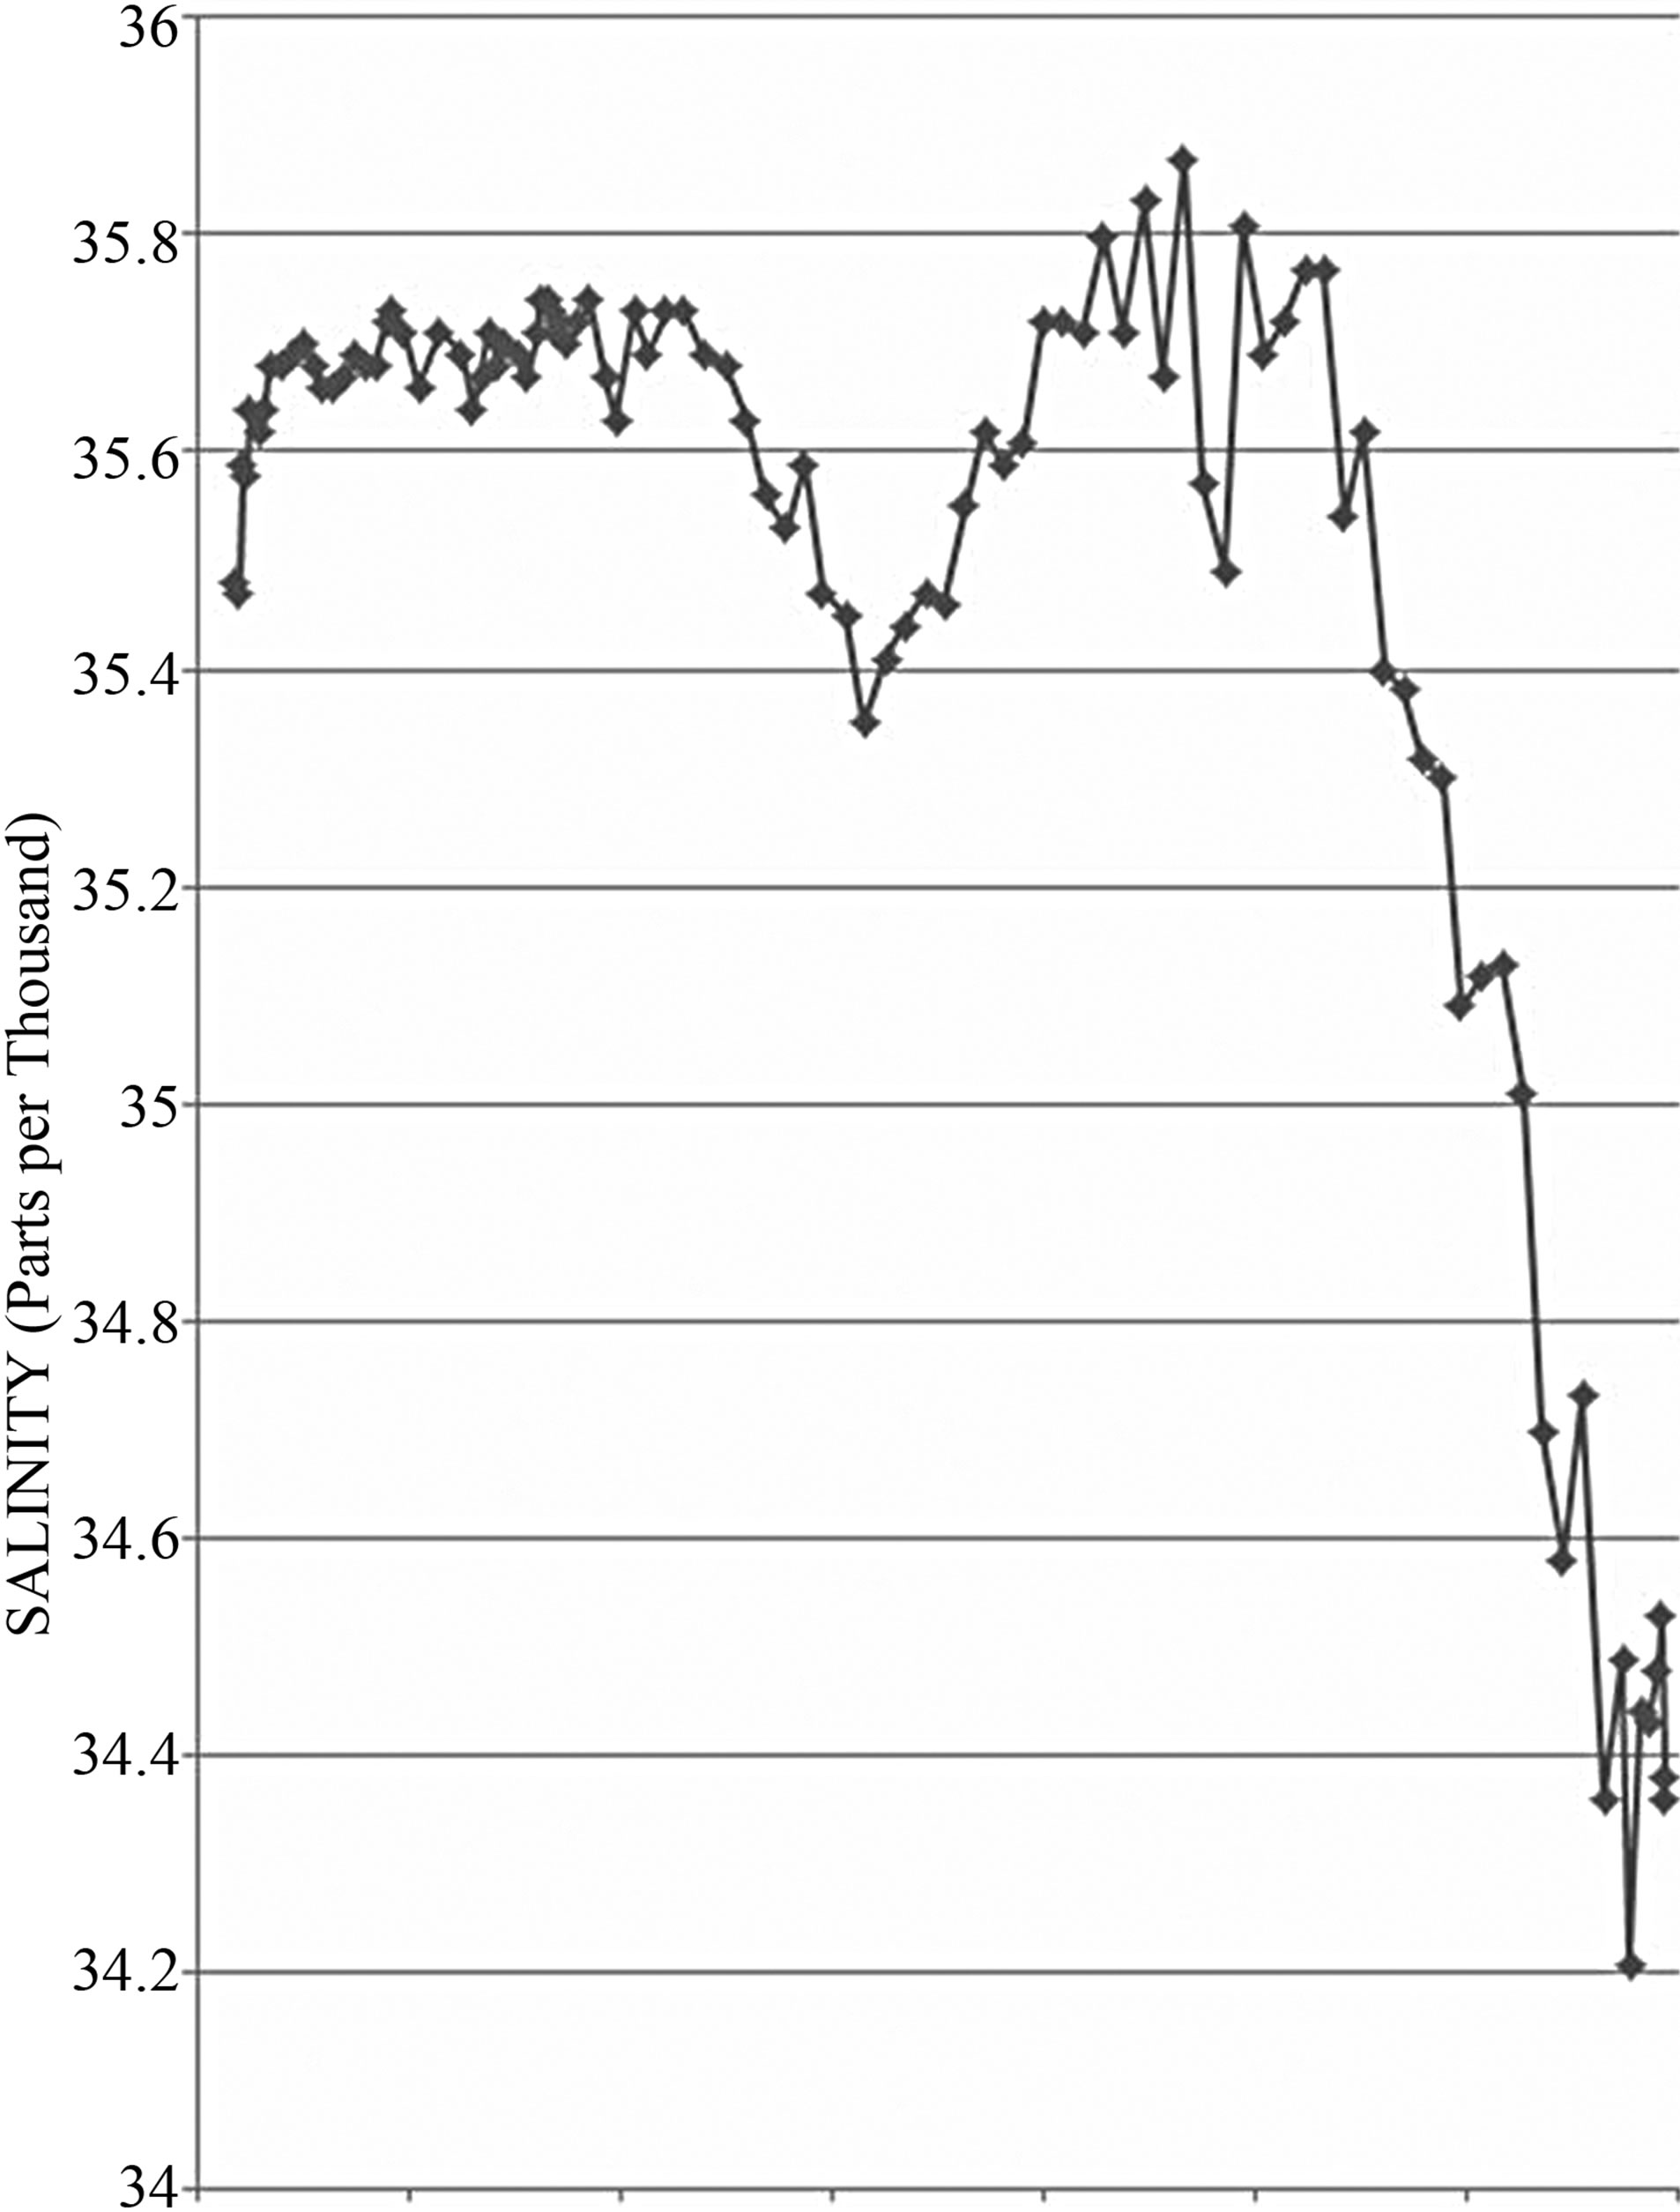
Figure 2. Surface salinity as a function of longitude at 28˚ - 15' S between Australia (left) and South America (right).
gitudinal temperature maximum (The amplitude of this feature is 0.4 parts per thousand whereas salinity was measured to 0.001 of a part per thousand). This is at least consistent with the warm water coming from lower latitudes where it is generally considered that evaporation will exceed precipitation most of the time in the open ocean.
From Scorpio surface temperatures and surface salinities the surface densities were calculated and presented in the data report. Surface densities (Figure 3) are the lowest anywhere in the section around the temperature maximum, which agrees with the density being dominated by temperature, as is normally the case far from continental influences. Longitudes and variable values graphed in Figures 1-3 were taken directly from the published data report; mixed layer depths (Figure 4) involve two intermediate steps.
Calculations of the thickness of the mixed layer were carried out as follows. At a given station and starting at the surface the vertical temperature gradient was computed between all consecutive pairs of temperatures, taken at a discrete set of depths (that varied from station to station), until the first significantly larger value was found. Then the depth of the mixed layer was taken to be the depth of the upper value of that pair of temperatures. In several cases the depth separation between pairs of
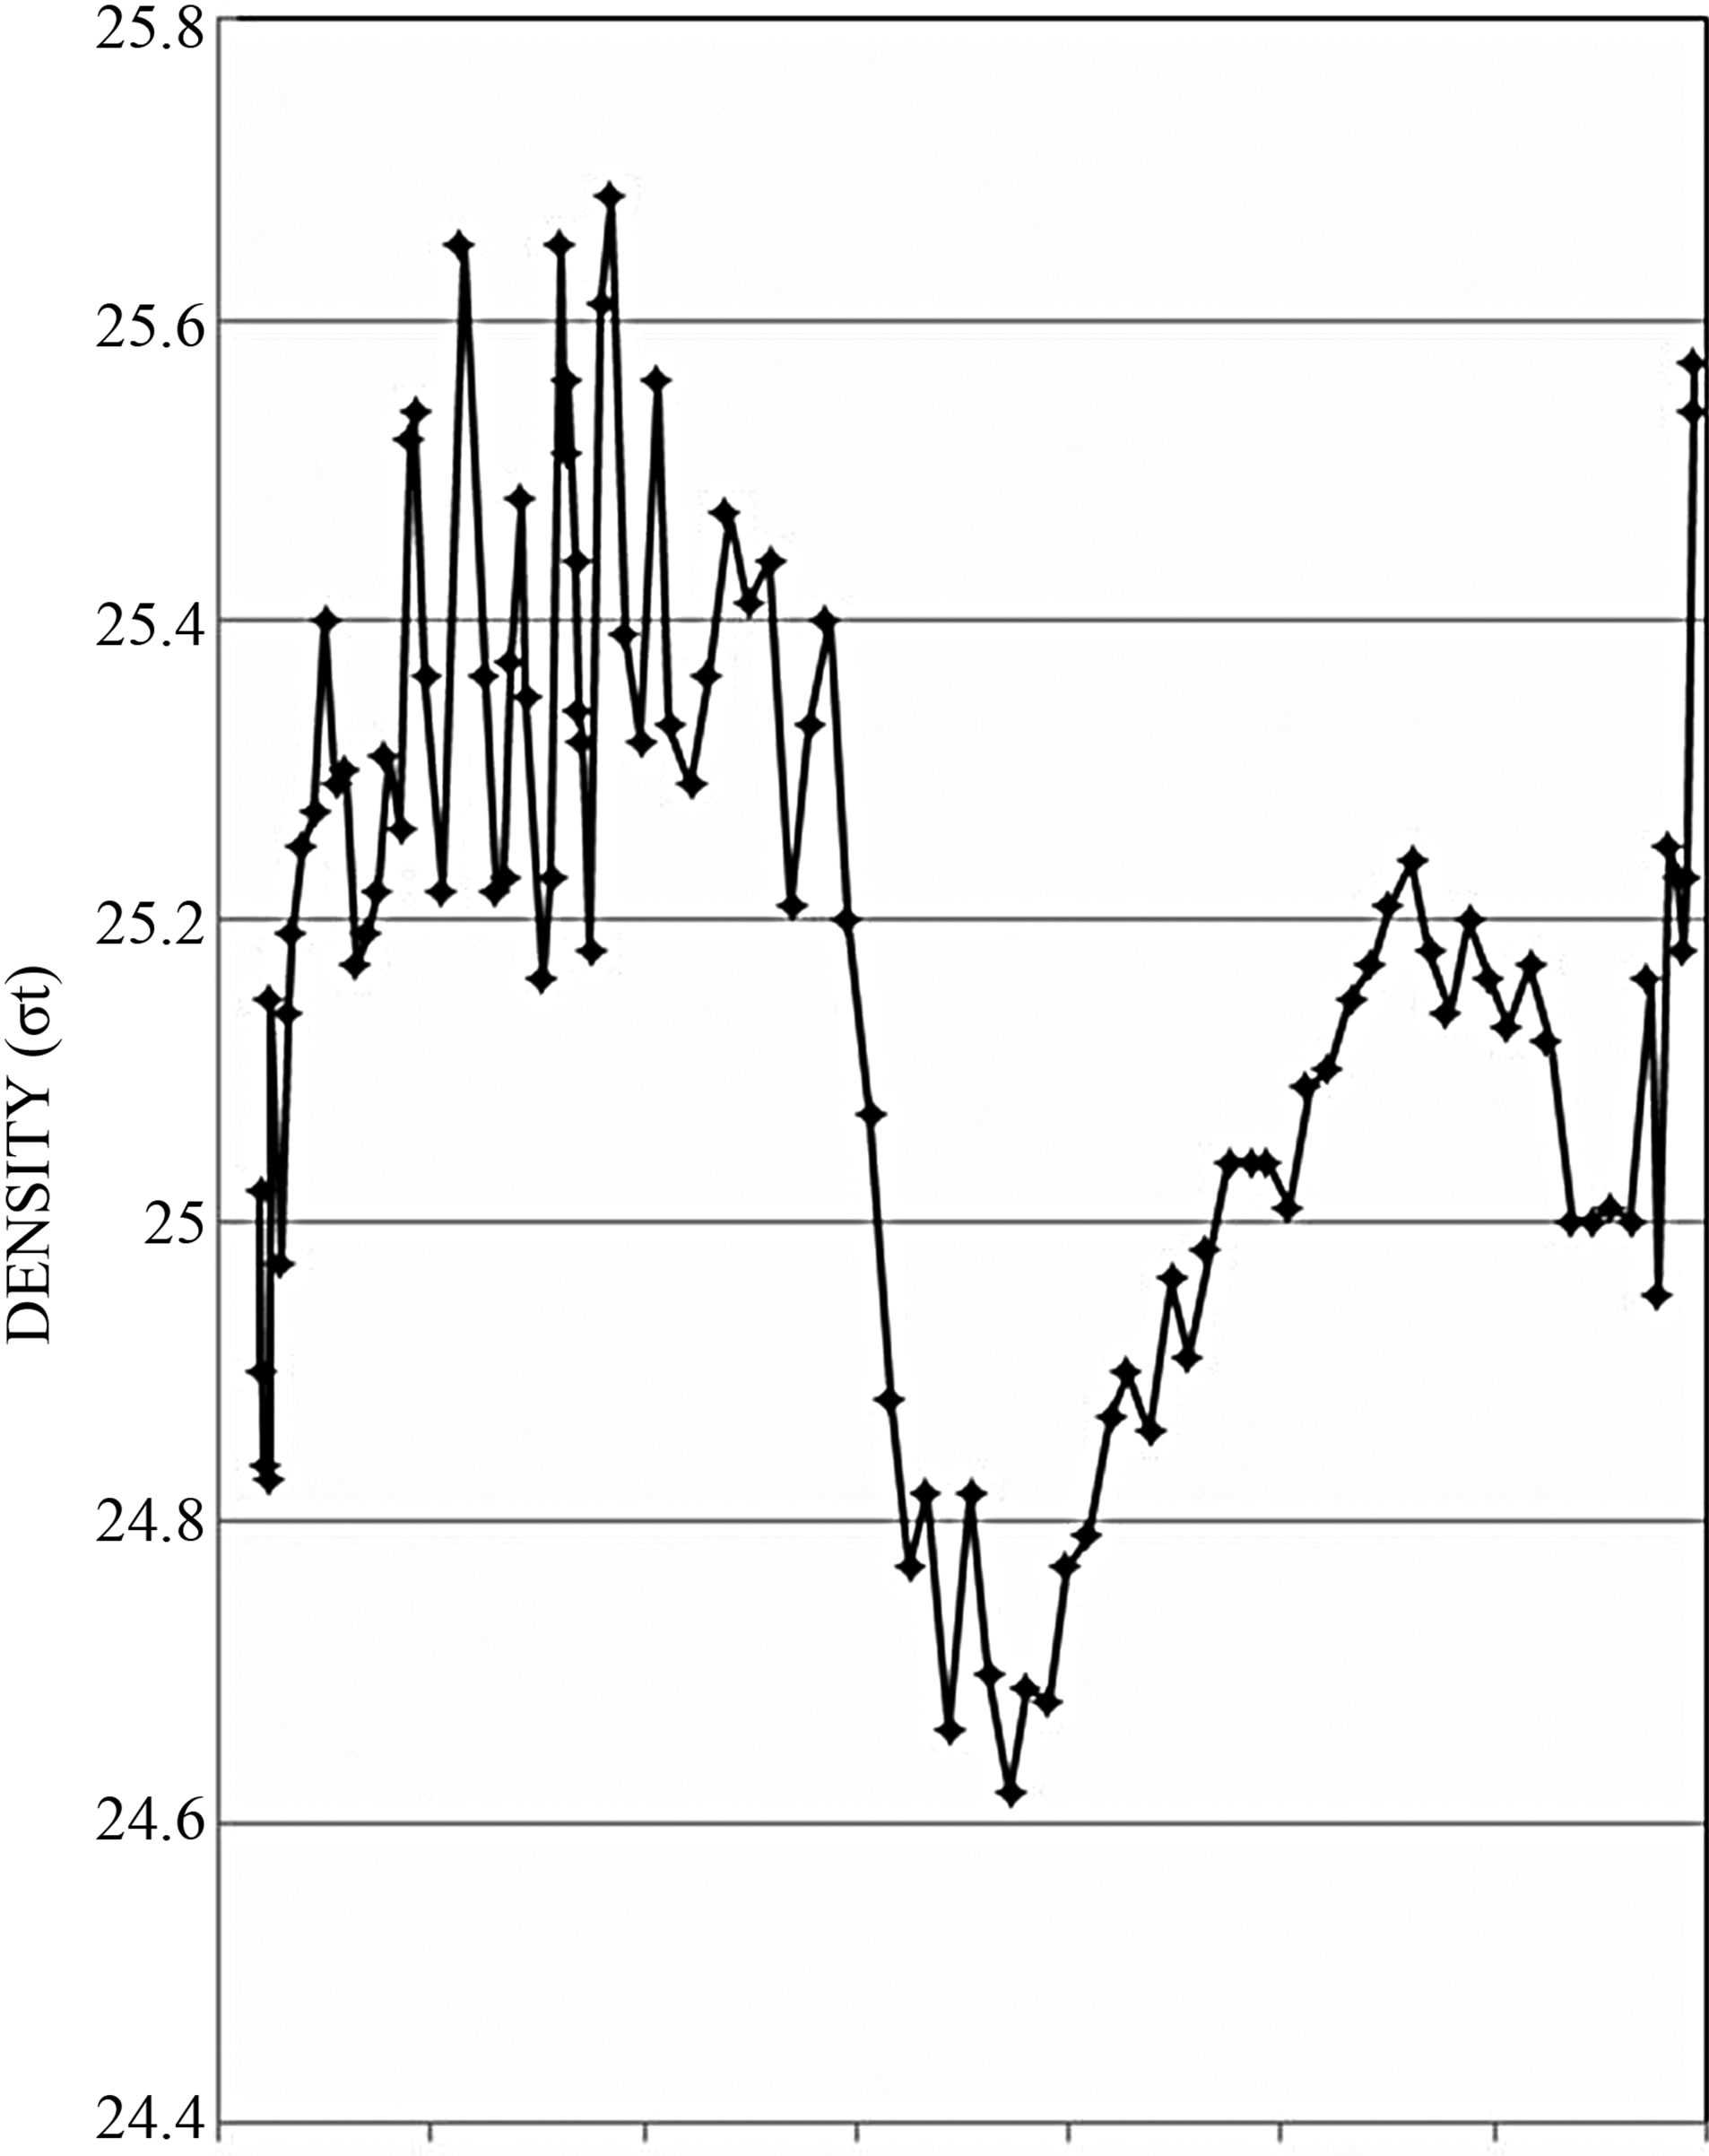
Figure 3. Surface density as a function of longitude at 28˚15'S between Australia (left) and South America (right).
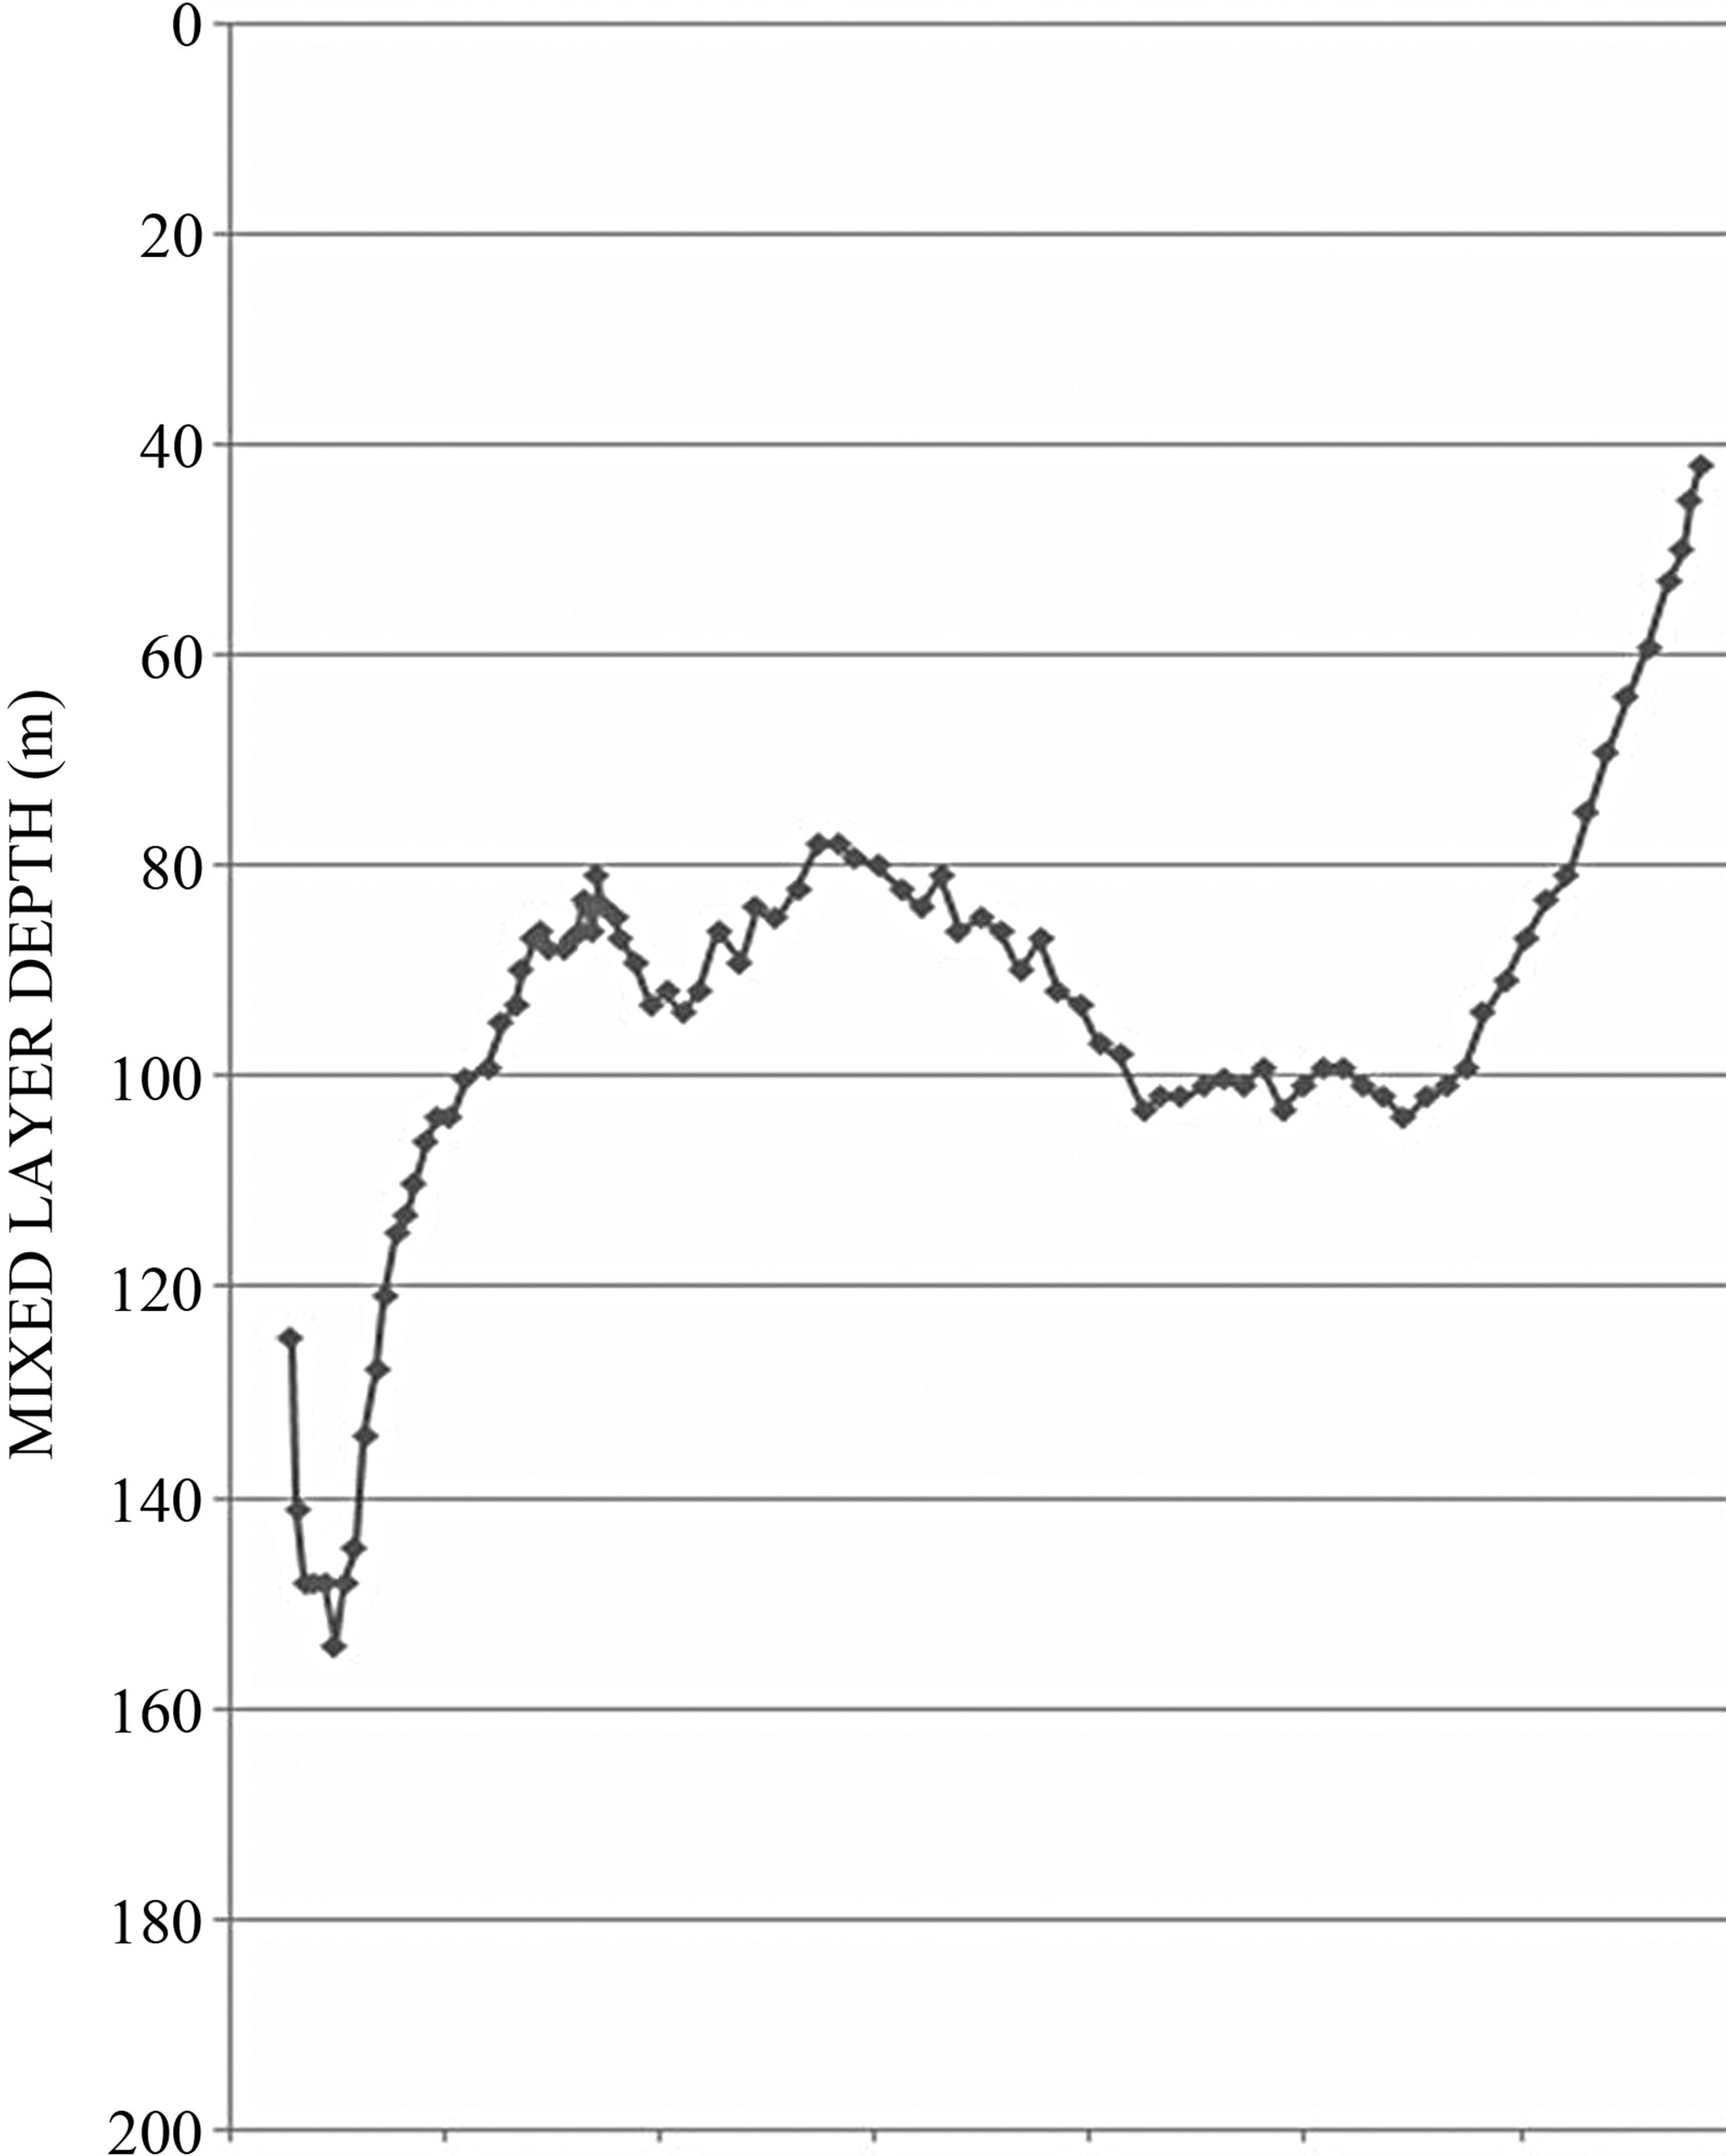
Figure 4. Mixed layer depth as a function of longitude at 28˚15'S between Australia (left) and South America (right). A 10 point running mean has been applied to the calculated values.
temperatures was not optimum for making this calculation, causing the mixed layer depth to sometimes be noisy from one station to the next. A 10 point running mean was then applied to the mixed layer depth values, which makes the curve of mixed layer depth vs. longitude smoother without compromising the integrity of the underlying physics, hopefully. Another way to obtain a smoother mixed layer depth curve would be to start with a different set of data, continuous in the vertical (i.e. from XBTs or STDs), as was done for the 35˚N section [3]. This is a possible project for another time.
Below the large-scale longitudinal surface temperature maximum of the central/eastern part of the section the mixed layer depth also has a broad maximum, the greatest depths bottoming out at about 100 m (Figure 4). Therefore, where the surface temperature is relatively high, in the middle of the basin, the mixed layer depth is relatively large. That overall correlation is consistent with warm surface water moving southward and being cooled from above. Alternative explanations for the correlation may occur to the reader, but no credible ones have emerged from the present study. Exactly the same correlation was found for the wide warm current of the North Pacific: high surface temperature equals deep mixed layer, in general.
As Figures 3 and 4 indicate the warm current is floating on top of denser water.
Comparing Figures 1 and 4 it can be seen that the highest temperatures of the longitudinal maximum are significantly west of the center of the region of greatest mixed layer depths. This same asymmetry, surprising at first, has already been found for the large-scale temperature maximum of the eastern North Pacific, an explanation of which has been offered [5].
Figures 2-4 confirm that the east/west scale to be associated with the temperature maximum of Figure 1 is at least 60 degrees of longitude, which makes this South Pacific feature twice as big longitudinally as is the comparable temperature maximum in the North Pacific. One reason for why this is so may be that at 28˚S the flow has a more easterly component, in relation to its southward component, compared to that of the northeastward flow at 35˚N. Verification of the reasoning awaits the accumulation of further data.
In Figure 4 the maximum depths of the mixed layer in the eastern part of the section are 100 m below the surface temperature maximum; this is the same as that under the temperature maximum of the North Pacific. An apparent upper limit of 100 m for the mixed layer depth could be an indicator of the greatest depth of the southward horizontal flow being in the neighborhood of 100 m also, but it may prove difficult to obtain a definitive check on that idea in the South Pacific. However, in the North Pacific the distinctive shallow salinity minimum lies parallel to and just below the mixed layer along 35˚N providing a signal that the northward flow has reversed direction there, now coming from higher latitudes where precipitation exceeds evaporation [2].
One very large mixed layer depth of relatively small horizontal scale occurs in the far western side of Figure 4. Four very large mixed layer depths of small scale were found on the western side of 35˚N section [3]. These interesting features remain unexplained largely because they are incompletely defined by measurements along a single east/west line.
4. OTHER LATITUDES
Scorpio I took place along 43˚S. There is no surface temperature maximum similar to that in Figure 1 along that line. Rather the surface temperature steadily increases, on the large scale, eastward from about 125˚W to the coast of South America, so the maximum in the eastern Pacific is at the coast. One might be inclined to guess that only the left limb of the maximum in Figure 1 remains after the warm current has run into the continent at latitudes between 28˚S and 43˚S. More data between these two latitudes would be needed before further discussions of this point can be continued.
Some years after the Scorpio Expedition, and at the same time of year, a second east/west hydrographic section was made in the South Pacific at about five degrees south of 28˚15'S as part of the WOCE program (World Ocean Circulation Experiment). Data from this WOCE line (P06), as well as all the others, and color coded vertical section displays of temperature, salinity, etc. can be found on the web: HUhttp://www.ewoce.orgUH. A feature very similar to that shown in Figure 1 can be seen in these data as well. From the coast of South America the surface temperature gradually increases westward to a maximum and then decreases again. The fact that the surface temperature maximum is a real feature that shows up in the data from two different cruises, made fairly close to the same east/west line in different years, but at the same time of year, provides some evidence that the maximum may be a permanent feature. If the longitudinal surface temperature maximum along 28˚S is the analogue of the similar feature in the North Pacific, as is proposed here, then it can be considered permanent by extrapolation, assuming the 30 years of ship-injection temperature data in the North Pacific are sufficient to prove it.
One difference between the two South Pacific sections is that the longitude of the surface temperature maximum in the WOCE line is closer to 120˚W than to 130˚W as it is in Figure 1. In moving south about five degrees of latitude the maximum has shifted eastward by about 10˚ of longitude. This eastward shift of the longitudinal maximum with increasing latitude in the South Pacific is to be anticipated as explained next based on what has already been discovered in the North Pacific. It is also in qualitative agreement with a mean direction of flow being southeast.
Between 35˚N and 40˚N the longitudinal maximum in surface temperature in the eastern North Pacific shifts eastward by a mean value of about 7.5 degrees of longitude, which is based on ship-injection surface temperature data, the mean being taken over all twelve months and all thirty years [3]. Thus the approximate 10 degree eastward shift over about five degrees of latitude for the South Pacific maximum between two separate cruises is in accord with the mean eastward shift of 7.5 degrees in the surface temperature maximum of the North Pacific between 35˚N and 40˚N Pacific documented before.
Only one other east/west line (P21) of surface temperatures (and other hydrographic properties) was made in the South Pacific as part of WOCE, along about 18˚S, but it exhibits no large-scale temperature maximum in the central or eastern part of the basin.
5. DISCUSSION
The world’s largest ocean is also the one most barren of data that are applicable to the present project. For example, if a data base of ship-injection temperatures exists for the South Pacific, I am not aware of it. Very likely the number of merchant ships crossing back and forth between South America and Australia is considerably smaller than what has been happening in the North Pacific between California and Japan for a long time. However, two transoceanic hydrographic sections are enough to uncover the southeast surface flow of warm water and to suggest that this current is the analogue of the wide northeast flow of warm water off California.
More data in the South Pacific would of course be desirable for exploring in greater detail the characteristics of the longitudinal temperature maximum. Not very likely is the probability that further hydrographic cruises will come along anytime soon. They are very costly. Monitoring of just the surface temperature along one or more east/west lines could be done in the future in a more inexpensive way, using less accurate thermometers, such as XBTs, more widely spaced. Also useful information could be obtained along lines that are long but do not extend all the way from South America to Australia, perhaps about half way across.
Although fairly strong evidence has been accumulated for a broad and shallow southeast flow in the middle of the South Pacific, based on temperatures and salinities along two east/west lines across the ocean, what is the most likely range of speeds of the flow? That question remains open, but the average speed is probably slow, in the range of 1 - 10 cm/sec, if the flow is the similar to the one in the North Pacific. A “drift” may be a more realistic description than a “current”.
Just because a current is slow does not mean it is unimportant. Poleward transport of excess heat from the tropics, over 90% of which is received within the top 100 m of the ocean, due to the constant absorption, per square meter and per second, of solar radiation, is one important job this surface current, which has a suggested depthscale also of about 100 m, carries out every minute of every day. That is one of the jobs that the wide warm surface current of the North Pacific has been proposed to do too [2]. Such (thermohaline) currents are not driven by the winds but by a horizontal pressure force related to the unstable equator to pole temperature gradient at and near the surface. That thermohaline and wind-driven currents can exist side by side at the surface of the ocean has apparently not been fully recognized before.
Sitting directly on top of the surface temperature maximum at mid-latitudes in the eastern North Pacific is the center of the North Pacific High pressure cell at sea level, at least in the thirty year mean [5]. Establishing a similar ocean/atmosphere connection for the South Pacific does not appear to be possible at the present time for lack of observations.
6. CONCLUSION
A very wide warm surface flow, with a southward component, is postulated for the central South Pacific based on an interpretation of closely spaced and accurately measured temperatures and salinities taken along two coast to coast transects between South America and Australia in two different southern hemisphere winters. Maximum depths of the current are estimated to be about 100 m; speeds are not known but presumed to lie in the range: 1 - 10 cm/sec. The most striking feature of the data along 28˚S (Figure 1) is a longitudinal temperature maximum at about 130˚W; it has a temperature amplitude of at least 5˚C and an east/west range of around 60˚ of longitude. This temperature maximum is hypothesized to be the surface signature of the southward warm drift, which is not predicted by any theory and does not appear on current charts or globes. An analogous wide northward warm flow in the North Pacific off California was documented in greater detail in the 1970s.
7. ACKNOWLEDGEMENTS
Phil Schneider commented on Figure 1’s implications, and Tony Sturges read the text, which now incorporates many of his suggestions. Computer assistance in making the figures was provided by Jack Holzhauer.
REFERENCES
- Scripps Institution of Oceanography (1969) Physical and chemical data from the Scorpio expedition in the South Pacific aboard USNS Eltanin, cruises 28 and 29, 12 March- 31 July 1967. Scripps Institution of Oceanography and Woods Hole Oceanographic Institution, La Jolla.
- Kenyon, K.E. (1981) A shallow northeastward current in the North Pacific. Journal of Geophysical Research, 86, 6529-6536. HUdoi:10.1029/JC086iC07p06529UH
- Kenyon, K.E. (1978) The surface layer of the eastern North Pacific in winter. Journal of Geophysical Research, 83, 6115-6122. HUdoi:10.1029/JC083iC12p06115U
- U S Hydrographic Office (1944) World atlas of sea surface temperatures. 2nd Edition, US Navy Hydrographic Office, Washington DC.
- Kenyon, K.E. (1999) North Pacific high: An hypothesis. Atmospheric Research, 51, 15-34. HUdoi:10.1016/S0169-8095(98)00110-0U