Health
Vol.5 No.8C(2013), Article ID:35784,7 pages DOI:10.4236/health.2013.58A3003
Performance of waist circumference relative to BMI in predicting risk of obesity and hypertension among affluent Indian adults
![]()
Biometry and Nutrition Unit, Agharkar Research Institute, Pune, India *Corresponding Author: raoari@yahoo.com
Copyright © 2013 Shobha Rao, Prajakta Parab-Waingankar. This is an open access article distributed under the Creative Commons Attribution License, which permits unrestricted use, distribution, and reproduction in any medium, provided the original work is properly cited.
Received 23 June 2013; revised 19 July 2013; accepted 29 July 2013
Keywords: Abdominal Adiposity; Asians; Blood Pressure; Body Mass Index; Waist Circumference; Waist to Hip Ratio
ABSTRACT
In view of the fact that Asians have higher abdominal fat at lower levels of body mass index (BMI), measures of abdominal adiposity such as waist circumference (WC) and waist to hip ratio (WHR) were investigated as predictors of hypertension. Data on BMI, WC, WHR and blood pressure (BP) were recorded through a crosssectional study on 419 urban adults (210 men and 209 women; aged 30 - 60 years) in Pune, India. Abdominal obesity was higher among women than men (35.9% vs. 32.4%). However, age adjusted mean systolic BP (124.3 ± 15.1 mmHg vs. 114.7 ± 17.2 mmHg), diastolic BP (82.9 ± 10.5 mmHg vs. 76.4 ± 10.7 mmHg) and prevalence of hypertension (34.3% vs. 21.5%) was significantly higher (p < 0.01) among men than among women. Although both WC and WHR increased with increase in BMI, correlation coefficient of BMI with WC was significantly (p < 0.01) higher than that with WHR in both sexes, suggesting that WC could be better for assessing adiposity. In men, odds ratio [OR (95% CI) = 2.19 (1.08 - 4.45)] for hypertension was significant (p < 0.05) only for those in highest tertile of WC while it was significant (p < 0.01) even in the middle tertile in case of women [8.24 (2.67 - 25.43) for higher and 5.71 (1.82 - 17.89) for middle tertile]. Optimal cutoff for identifying obesity and hypertension showed significant (p < 0.01) area under curve (AUC) and sensitivity for WC than WHR in both sexes. The risk cutoffs were lower compared to those proposed by the World Health Organization especially for men, but were comparable with reported Asian studies. Thus, it was evident that WC performed better than BMI and WHR for assessing the risk of hypertension and may be used as a simple, convenient and inexpensive screening tool in epidemiological studies.
1. INTRODUCTION
The worldwide prevalence of overweight and obesity has been increasing at an alarming rate, indiscriminately affecting populations of both higher and lower middle income countries [1]. Excess adiposity has been shown to be an independent risk factor for cardiovascular diseases (CVD) like Type II diabetes, dyslipidemia and hypertension. Although body mass index (BMI) is the most frequently used index of adiposity, it does not reflect fat mass uniformly in all populations [2]. In fact, it is reported that Indians and other Asians have a smaller body frame and the BMI classification of obesity based on large framed Europid populations may be inappropriate for them [3].
In recent years, evidence is accumulating which suggests that for a given BMI, adiposity can substantially be greater in Asian individuals compared with Caucasian individuals [4]. In particular, at a similar value of BMI, Asian Indians have significantly greater total abdominal fat and visceral fat area [5,6] compared with white Caucasians resulting in increased risks of metabolic disorders at much lower levels of BMI.
Abdominal adiposity is suggested to be more closely associated with CVD risk and has been highlighted as a growing problem particularly in countries of Asia-Pacific region where individuals may exhibit a relatively normal BMI (<25 kg/m2) but have a disproportionately large waist circumference [7]. There is thus an increasing interest in investigating other measures such as waist circumference (WC) and waist to hip ratio (WHR) which reflect abdominal adiposity, as predictors of obesity related risks rather than BMI.
In this scenario, the World Health Organization (WHO) has proposed lower values of general and abdominal obesity indicators to define obesity and risk of CVD for inhabitants of the Asia-Pacific region. However, it has been suggested that more studies need to be performed to determine the relationship between BMI, WC and risk of development of co-morbidities to allow for the establishment of validated cut-points [8].
The predictive power of an anthropometric index is population dependent and varies from race to race [9]. The appropriate cutoffs for measurement of abdominal obesity i.e. WC and WHR also need to be validated in case of different populations in India. Present study thus examines BMI, WC and WHR for predicting obesity as well as hypertension among urban affluent adults from Pune, India.
2. MATERIALS AND METHODS
2.1. Subjects
Subjects selected for the study were members of various Rotary Clubs in Pune city, Maharashtra, and generally represented the higher middle class of the population which was confirmed with socio-economic information. Health camps were organized in the institute usually on the weekend and members were given necessary instructions with regard to the obesity assessment. The Research Advisory Committee of the institute approved the study protocol. The written consent of each participant was also taken before taking the measurements. Data were collected on 419 Rotarians (210 men and 209 women) aged 30 - 60 years.
2.2. Measurements
Detailed socio-economic information, anthropometry and blood pressure were recorded for each subject. Questionnaire for socio-economic information comprised of socio-demographic variables such as age, sex, marital status, family type and education. Additionally, it contained questions for detailed economic assessment seeking information on occupation, economic assets related to ownership of house, real estate, vehicle, annual income category and visits abroad.
Anthropometric variables included measurements on weight, height, and circumferences of the waist and hip. Body weight was measured (up to 20 g) using an electronic weighing balance (SUYSAN, India) and height was measured (up to 1 mm) barefoot with a stadiometer. BMI was computed as the ratio of weight (kg) to height (m2). WC was measured at the midpoint between the lower border of the ribcage and the iliac crest while the hip circumference was measured at the largest circumference between the waist and the knees [10] using a flexible fiber glass tape. WHR was computed as a ratio of WC (cm) to hip circumference (cm). All the readings were taken in duplicate and average was used in the analysis.
Systolic (SBP) and diastolic (DBP) blood pressure measurements were taken in sitting position on left arm using OMRON Blood Pressure monitor (OMRON T4, OMRON Corporation, Japan) after 10 minutes rest. Appropriate adult sized cuff was used to measure blood pressure. Two readings were recorded and the second reading was used in the analysis. Measurements were recorded by trained researchers and care was taken to keep personal errors to minimum.
2.3. Definitions
BMI was used to assess overweight (≥23 kg/m2) and obesity (≥25 kg/m2) according to revised WHO criteria for Asians. Abdominal obesity was assessed according to WHR (≥0.95 for men and 0.80 for women) and the revised ethnic specific cutoffs for WC (≥90 cm for men & 80 cm for women) [1]. Hypertension was defined as blood pressure ≥140/90 mmHg or if the subject was taking anti-hypertensive medication according to the report of JNC VII [11].
2.4. Statistical Methods
Continuous variables are reported as mean ± SD. Linear trend in mean values of WC and WHR by BMI tertiles was tested using one-way analysis of variance (ANOVA). While computing mean SBP and DBP levels, subjects on anti-hypertensive medication were not considered. Age-adjustment was done using linear regression to compute age-adjusted means and prevalence. Using logistic regression analysis, the odds ratios (OR’s) and 95% confidence intervals (CI) for the occurrence of hypertension were computed relative to the reference category i.e. lower tertile of BMI, WC and WHR. Optimal cutoff values of BMI, WC and WHR for identifying the risk of hypertension were determined using Receiver Operating Characteristic (ROC) analysis. In ROC, the true positive rate is plotted against the false positive rate across range of values from the diagnostic test. This provides an estimate of the cutoff that corresponds to the best trade off between sensitivity and (1-specificity) of the anthropometric cutoffs to discriminate between healthy and unhealthy subjects. The decision threshold for the best trade off is the criterion value with the highest accuracy that maximizes the sum of the sensitivity and specificity [12]. Distributions for SBP and DBP in both sexes and for BMI and WC in women were skewed and as such required logarithmic transformations. All analysis was done using a statistical program (SPSS/PC Version 11.0 for Windows, SPSS Inc. Chicago IL).
3. RESULTS
Mean values of various measurements are given for males and females in Table 1. Mean age for men and women was comparable, but men were heavier (p < 0.01) and taller (p < 0.01) compared to women. Mean BMI values were comparable for the two sexes but the prevalence of obesity (BMI ≥ 25 kg/m2) was marginally higher in women (65.1% vs. 57.1%). Thus an alarming high of 50% of men and women were obese. Although the mean WC and WHR values for men were slightly higher, the prevalence of abdominal obesity was also higher among women based on WC (35.9% vs. 32.4%) as well as WHR (25.4% vs. 7.1%). On the other hand, the overall age adjusted mean SBP and mean DBP as well as the prevalence of hypertension were significantly higher (p < 0.01) among men (34.3%) compared to women (21.5%).
Correlation coefficients were computed to see how blood pressure levels are associated with overall adiposity and with abdominal obesity (Table 2). It can be seen that correlation of BMI with SBP was significant in both sexes but with DBP it was significant only in case of women. Further, although both WC and WHR showed significant correlations with SBP and with DBP, correlations with WC were marginally higher than those seen for WHR or for BMI.
In order to see whether abdominal obesity increases with BMI, mean WC and WHR values by tertiles of BMI were computed (Table 3). Mean WC increased significantly from lower tertile of BMI to higher tertile both in men (79.8 cm to 93.0 cm, p < 0.01) and women (70.8 cm to 85.3 cm, p < 0.01). The trends with respect to mean WHR values were increasing too, in both sexes. However, the correlation coefficient of BMI with WC was much higher than with WHR in both men (0.852 vs. 0.331) and women (0.825 vs. 0.251). Thus, abdominal obesity defined in terms of WC was seen to be more closely associated with the overall adiposity defined in terms of BMI among adult Indians.
Among men, age adjusted mean values of SBP and DBP levels increased significantly from lower tertile to higher tertile of WC and WHR but it was not true in case of BMI (Figure 1). However, in women increasing trend in mean blood pressure levels was significant for all the three measures of adiposity.
Age adjusted prevalence of hypertension was computed for subjects in different tertiles of various measures of adiposity such as BMI, WC and WHR that confer increased risk of hypertension (Table 4). Among men, the

Table 1. Characteristics (m ± SD) of the study population.
aBMI: Body mass index; bWC: Waist circumference; cWHR: Waist to hip ratio; dSBP: Systolic blood pressure; eDBP: Diastolic blood pressure.
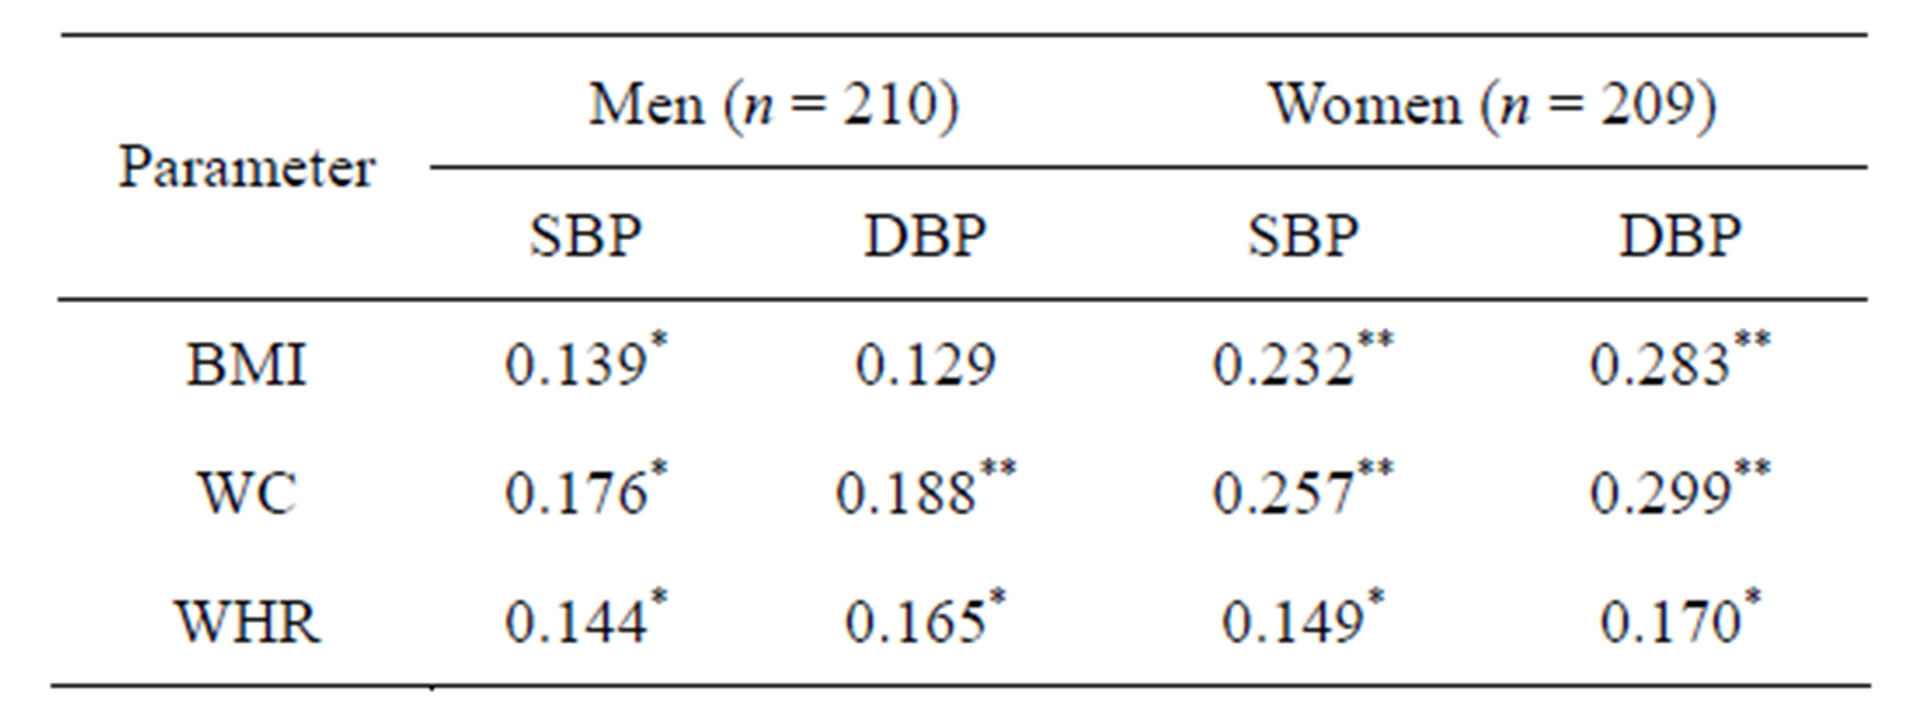
Table 2. Correlation of BMIa, WCb and WHRc with age-adjusted SBPd and DBPe.
*p < 0.05; **p<0.01; aBMI: Body mass index; bWC: Waist circumference; cWHR: Waist to hip ratio; dSBP: Systolic blood pressure; eDBP: Diastolic blood pressure.
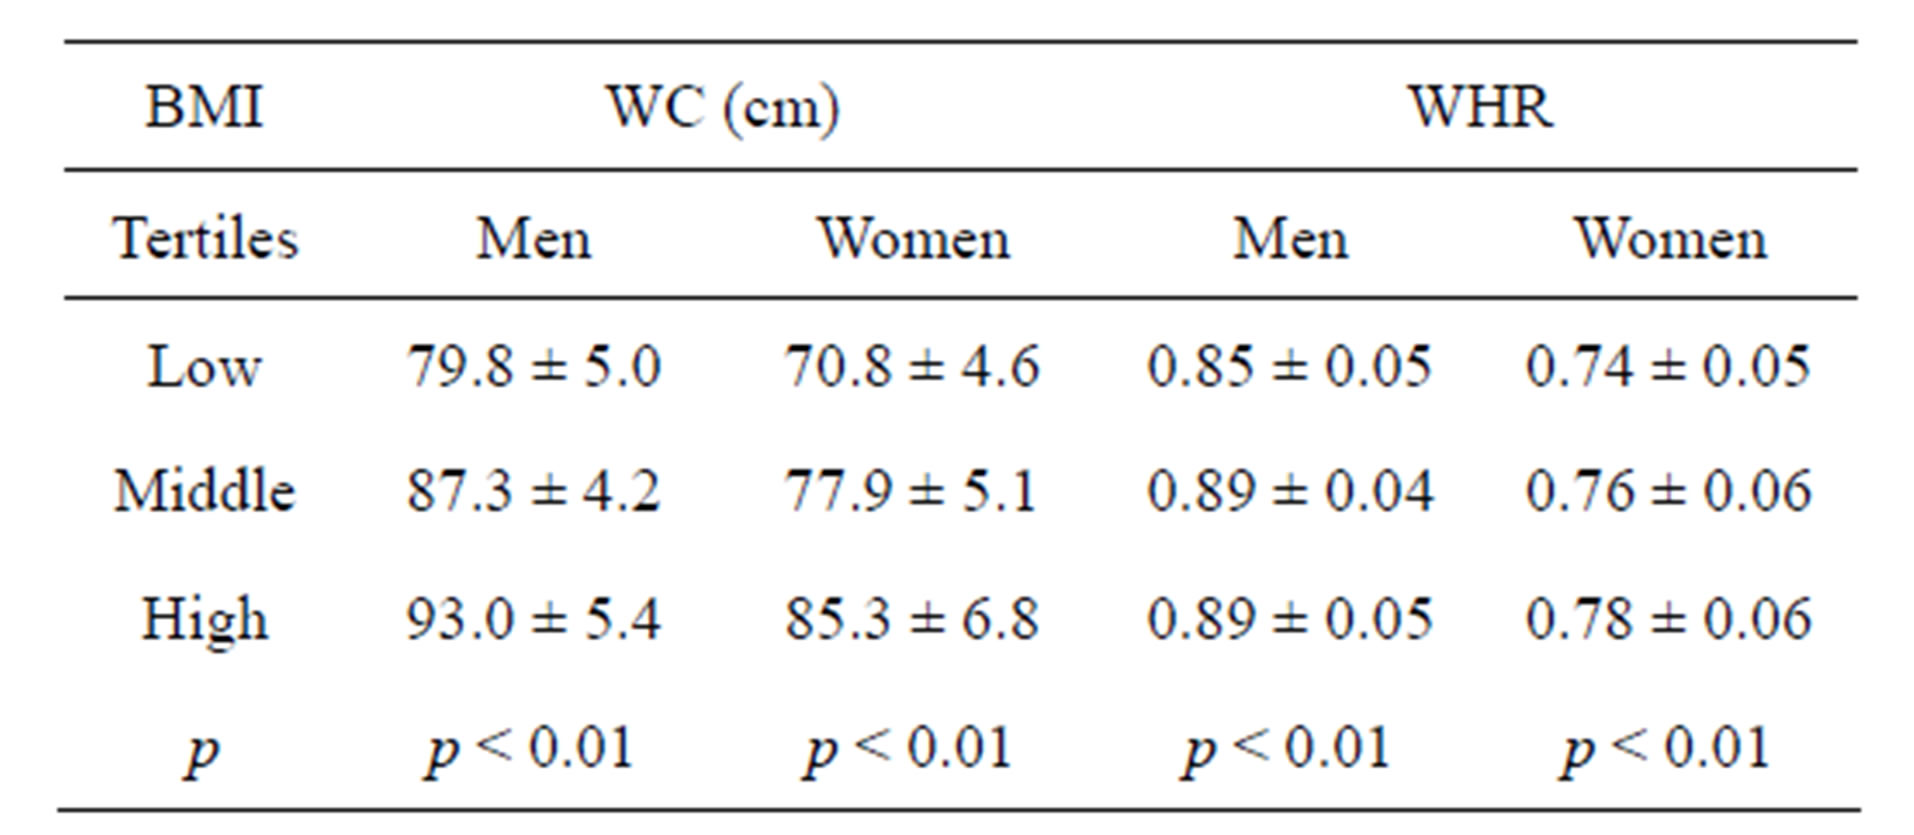
Table 3. Mean (±SD) WCa and WHRb according to tertiles of BMIc.
aWC: Waist circumference; bWHR: Waist to hip ratio; cBMI: Body mass index.
prevalence of hypertension was significantly higher even in the lowest tertile of BMI, WC or WHR (27.1, 28.4, 31.8%, respectively) compared to that observed in women (8.6, 5.7, 11.4%, respectively). Further, the increase in the prevalence of hypertension from lower to higher tertile of these measures was modest among men, but was 3 to 5 times higher (39.1% in case of BMI; 33.3% in case of WC and 30.0% in case of WHR) among women.
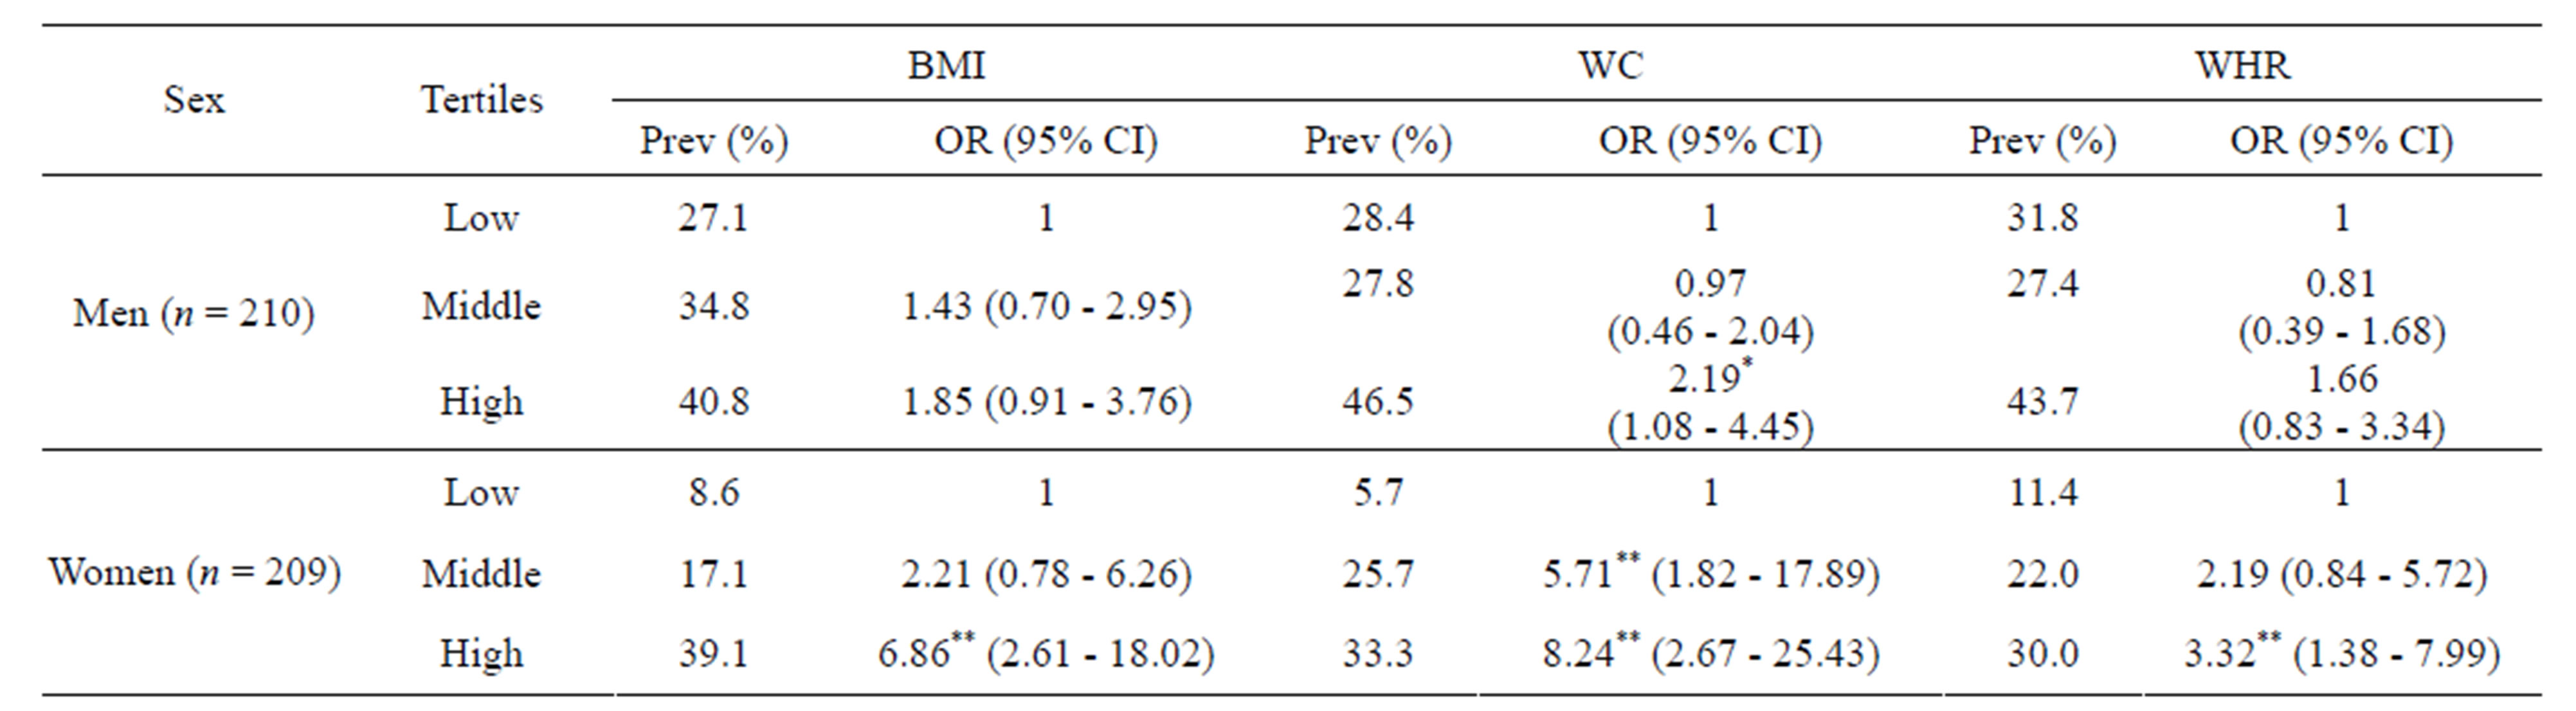
Table 4. Prevalence (%) and ORa (95% CIb) of age adjusted hypertension according to tertiles of BMIc, WCd and WHRe.
*p < 0.05; **p < 0.01; aOR = Odds ratio; bCI = Confidence interval; cBMI: Body mass index; dWC: Waist circumference; eWHR: Waist to hip ratio.
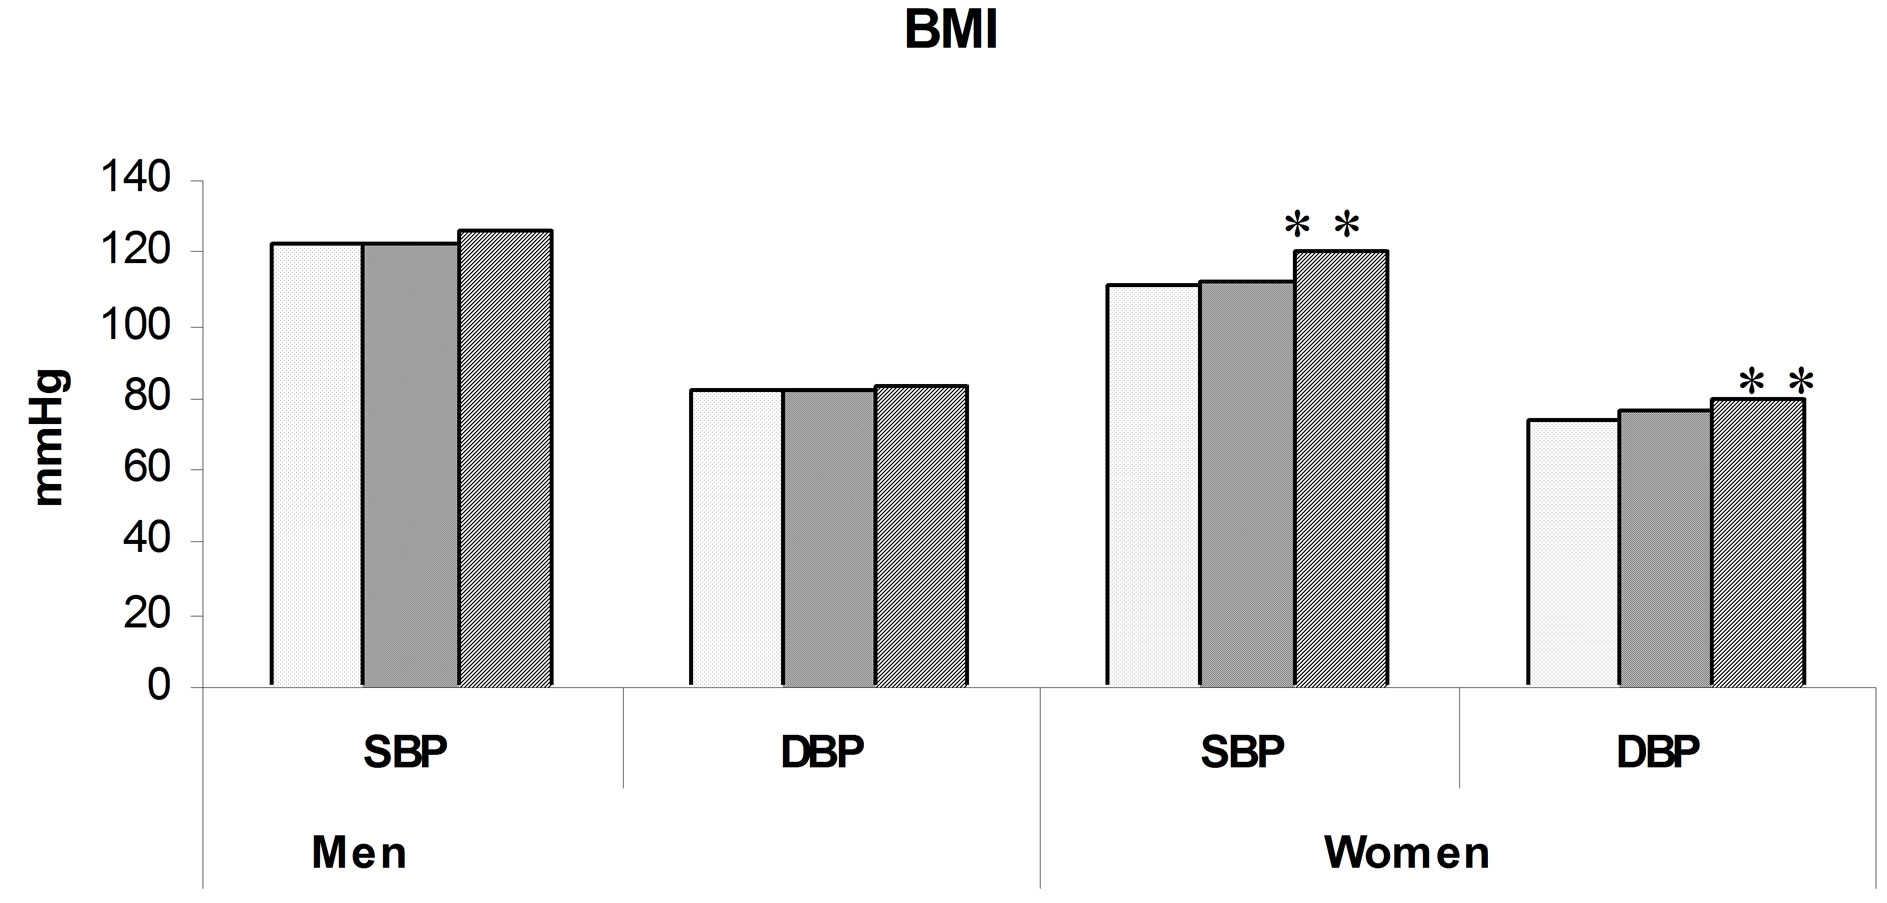
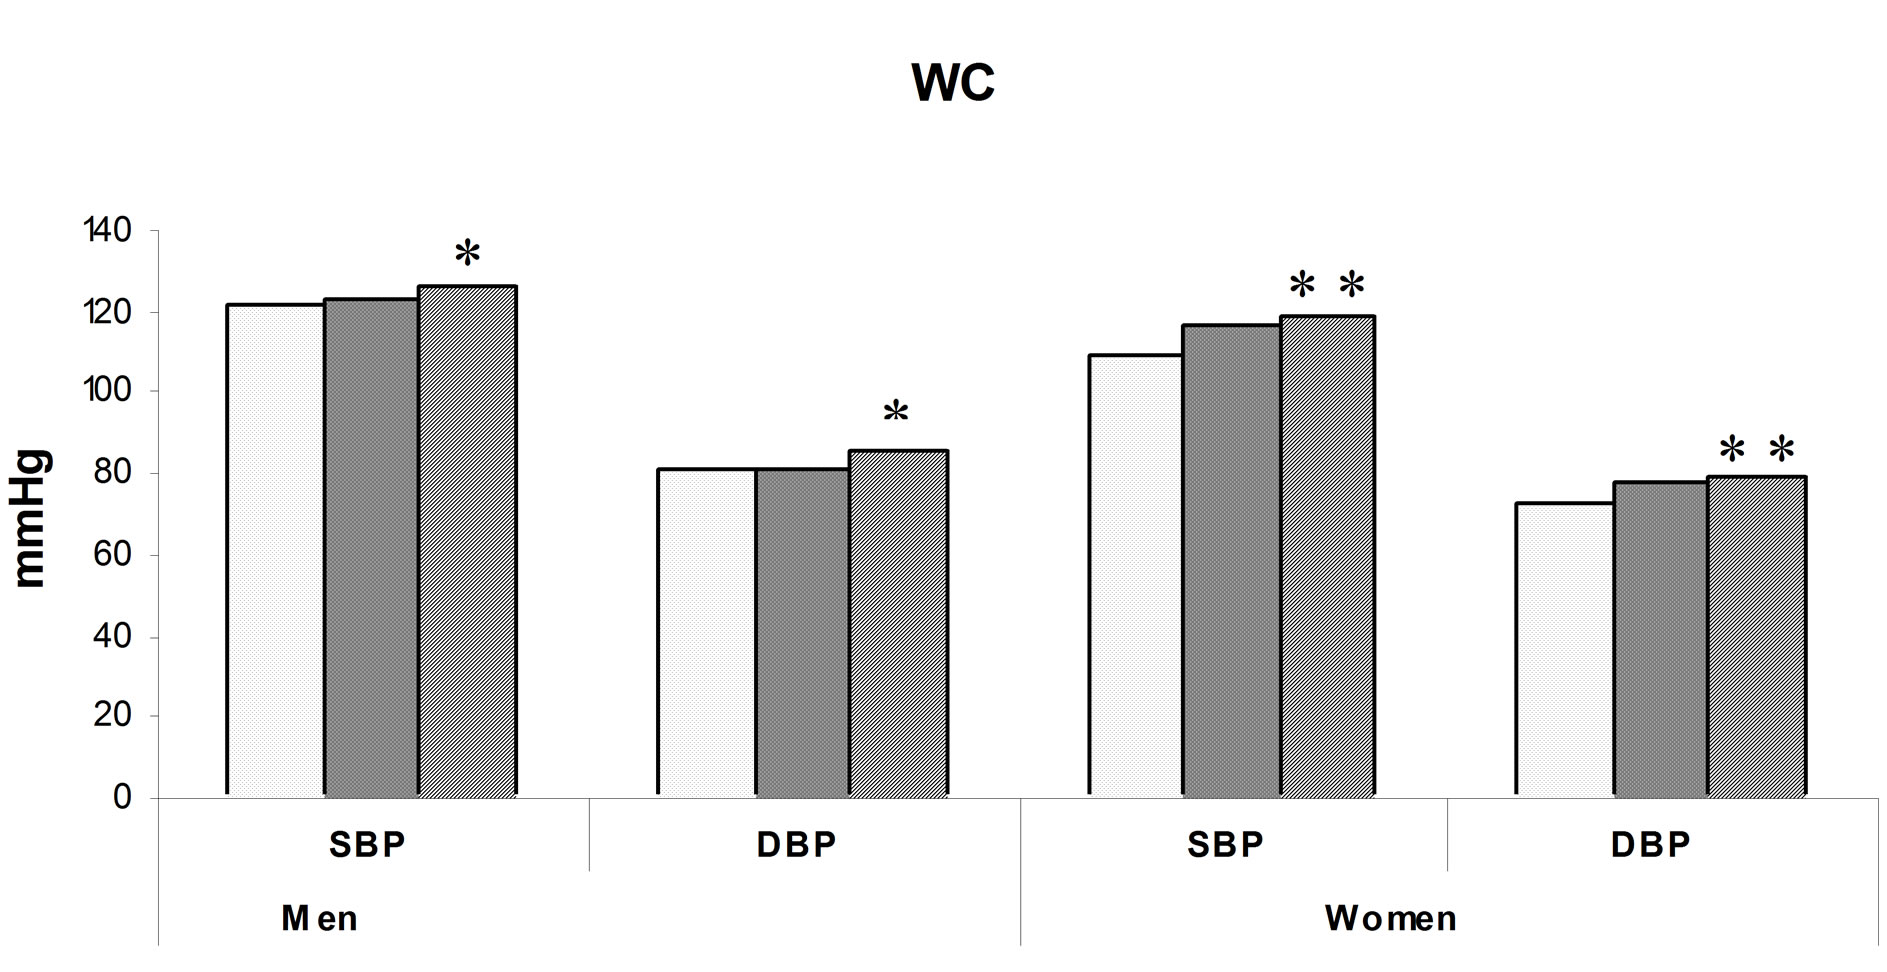
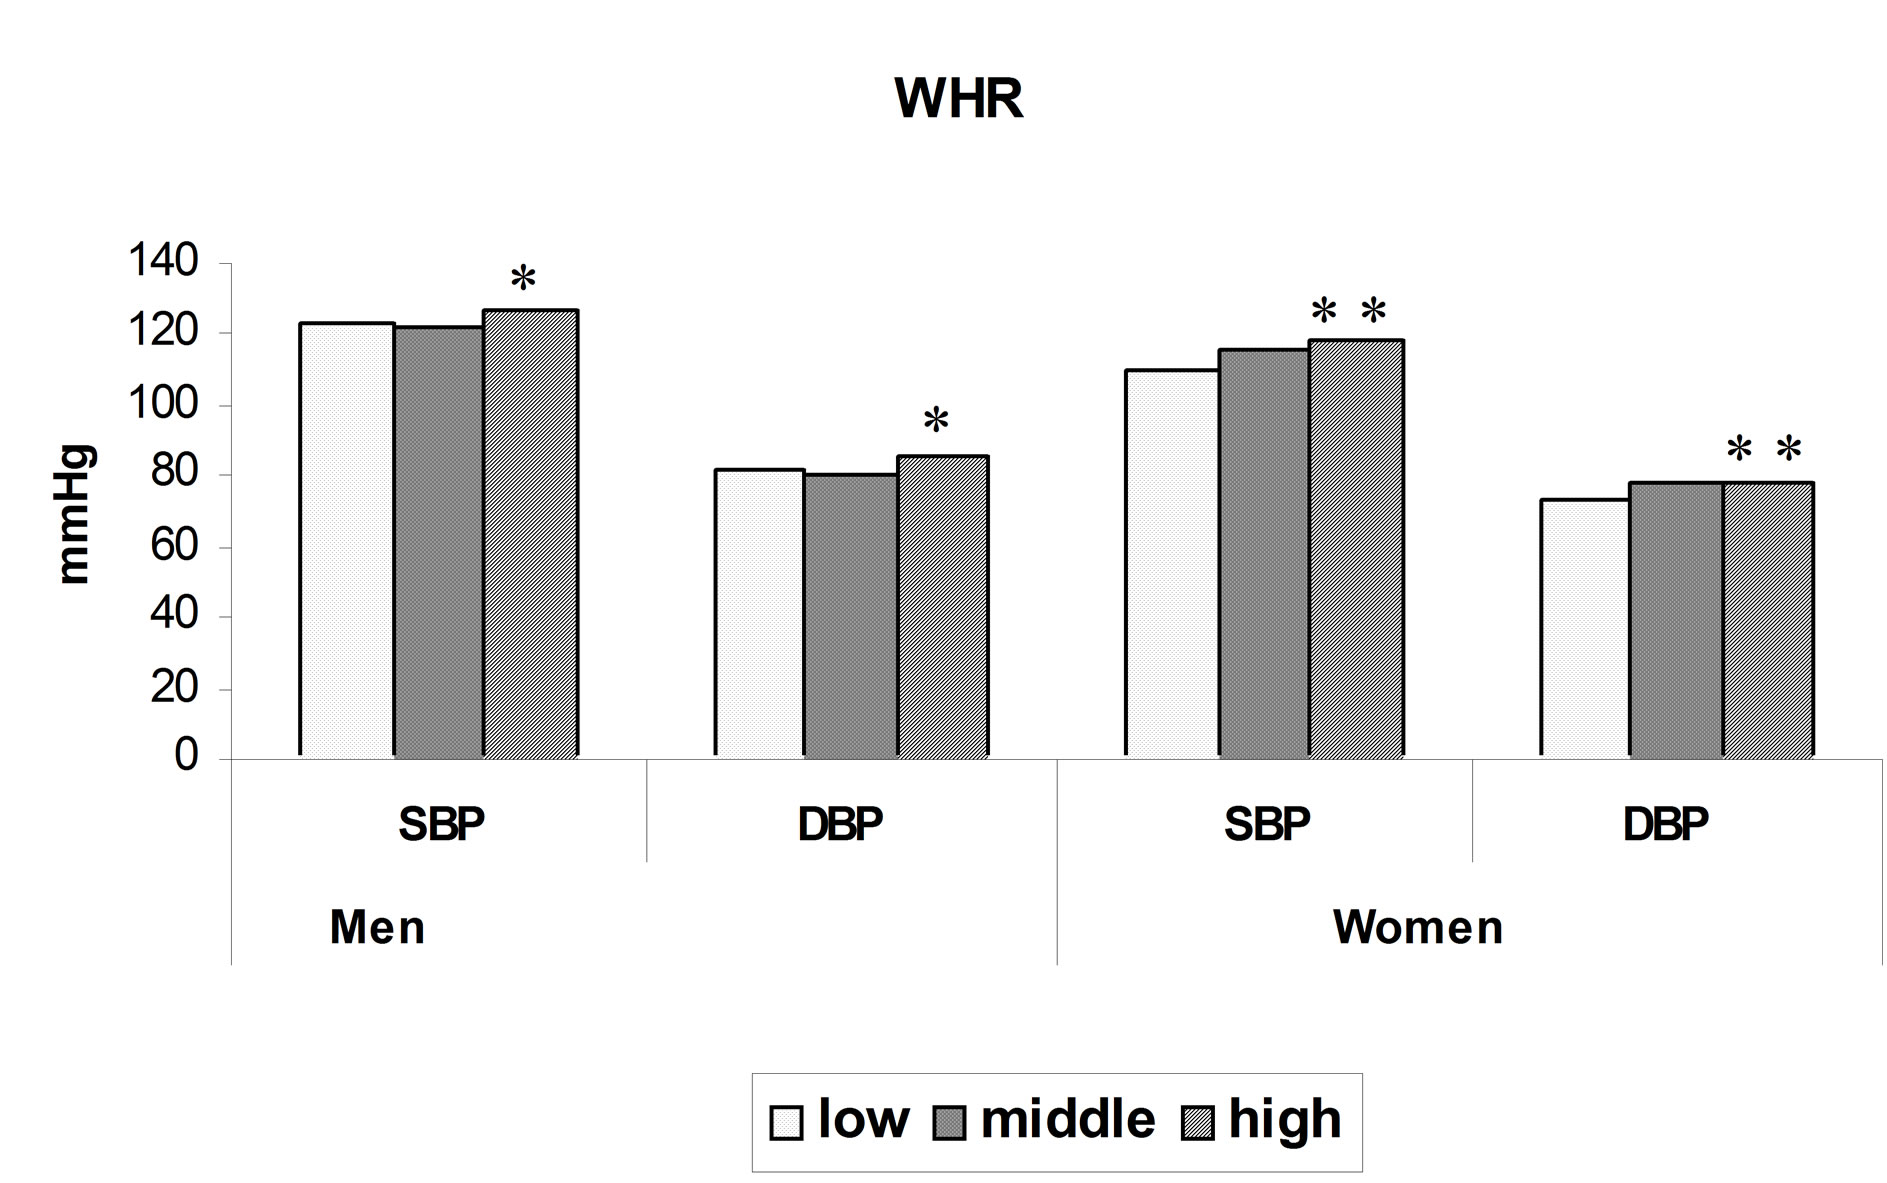
Figure 1. Mean SBPa and DBPb levels by BMIc, WCd and WHRe tertiles in men and women . Note: *p < 0.05, **p < 0.01; aSBP: Systolic blood pressure; bDBP: Diastolic blood pressure; c BMI: Body mass index; dWC: Waist circumference; eWHR: Waist to hip ratio.
The ORs for hypertension were computed (Table 4) for subjects in higher tertiles of these measures considering the lower tertile as a reference category. It can be observed that the OR for hypertension was significant (p < 0.05) only for higher tertile of WC [2.19, (1.08 - 4.45), p < 0.05] in men indicating the higher sensitivity of WC for predicting risk of hypertension as compared to BMI or WHR. On the other hand, among women, the OR’s were significant (p < 0.01) for higher tertile of BMI [6.86, (2.61 - 18.02), p < 0.01] and WHR [3.32, (1.38 - 7.99), p < 0.01]. The highest OR was however seen in the third tertile of WC [8.24, (2.67 - 25.43), p < 0.01] and significance was seen even in the middle tertile [5.71, (1.82 - 17.89), p < 0.01]. This once again indicates higher sensitivity of WC as compared to BMI and WHR.
Optimal cutoffs for assessing obesity (BMI ≥ 25 kg/m2) were obtained for WC and WHR using Receiver Operating Characteristic (ROC) analysis (Table 5). It was observed that area under the curve (AUC) was significantly higher for WC in both sexes (0.92) compared to that for WHR (0.70 in men and 0.65 in women). This was also true with regard to sensitivity and specificity in both sexes. Thus, WC performs better than WHR in identifying obesity. These indicators were further examined using similar analysis for their optimal cut offs in identifying risk of hypertension (Table 6). It can be observed that in case of men, values for AUC were not significant both for BMI and WHR but were significant only for WC. However, among women, AUC values were significant for all the three indicators but were largest in case of WC [0.75, (0.67 - 0.82), p < 0.01) and BMI [0.73, (0.65 - 0.81), p < 0. 01] compared to that for WHR [0.64, (0.55 - 0.73), p < 0.01]. The observations thus show that WC performs better in identifying risk of obesity as well as hypertension in both sexes.
4. DISCUSSION
Epidemiological studies in India show a steadily increasing trend in prevalence of hypertension over the last forty years especially in urban areas [13]. Attention has been given to the adverse health consequences of a moderate increase in BMI in different ethnic groups. However, several studies have shown that Asians have higher amounts of body fat, especially abdominal or truncal
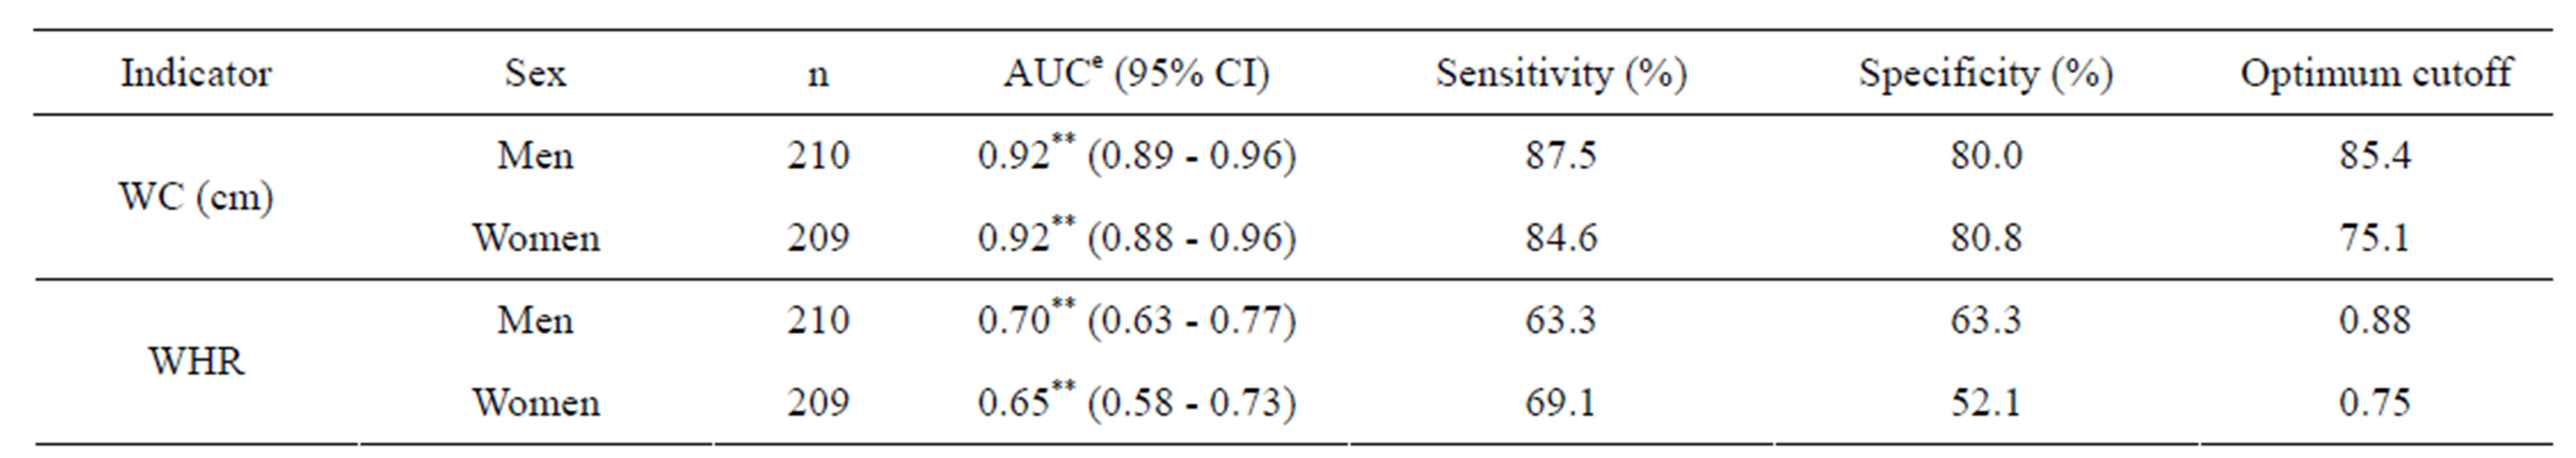
Table 5. ROCa cutoffs of WCb and WHRc for obesity (BMId ≥25 kg/m2).
*p < 0.05; **p < 0.01; aROC: Receiver operating characteristic analysis; bWC: Waist circumference; cWHR: Waist to hip ratio; dBMI: Body mass index; eAUC: Area under curve.
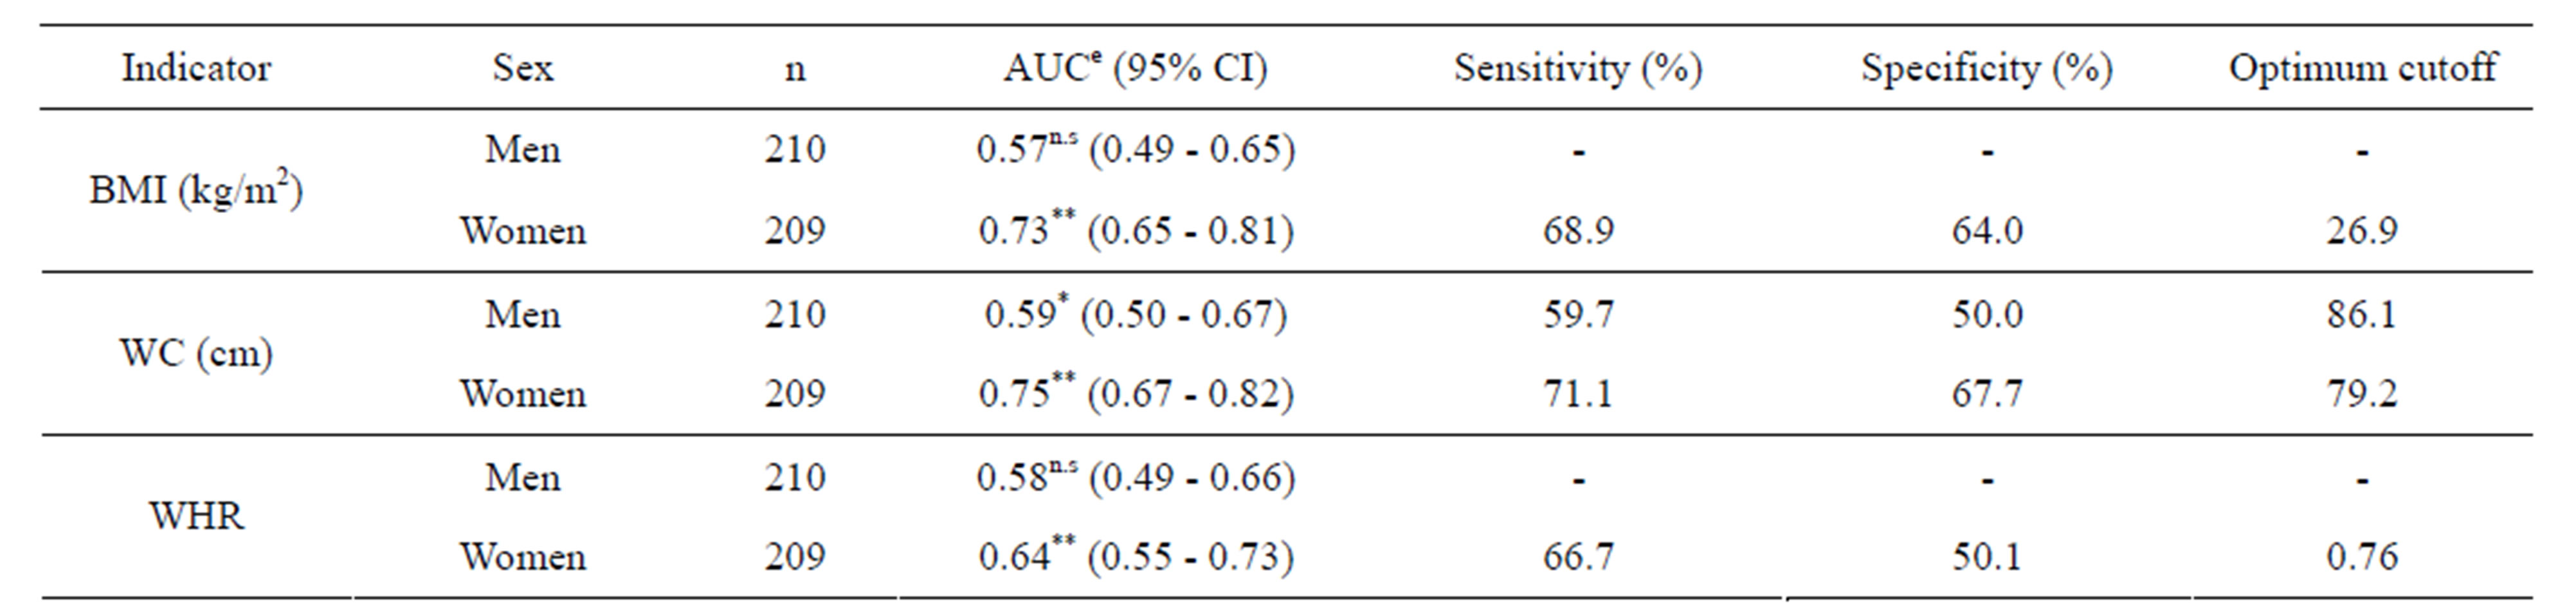
Table 6. ROCa cutoffs of BMIb, WCc and WHRd for age adjusted hypertension.
*p < 0.05; **p < 0.01; n.s: Non Significant; aROC: Receiver operating characteristic analysis; bBMI: Body mass index; cWC: Waist circumference; dWHR: Waist to hip ratio; eAUC: Area under curve.
subcutaneous fat at low levels of BMI and WC than Caucasians [2,6,14]. Thus, due to variations in body proportions, BMI may not correspond to the same body fat in different populations [1]. Data are therefore required to delineate the differences in BMI-disease relations between different populations. In particular, several investigators have stressed the need for establishing population specific cutoffs for BMI and WC for Asian populations [15,16]. The issue of identifying cut offs for BMI and other indicators such as WC and WHR that confer increased risk of CVD in urban adults in India is thus of high relevance. We observed that WC performs better than WHR in identifying risk of obesity as well as risk of hypertension.
Some of the points need consideration before discussing the major findings of the study. Rather than considering a large cross sectional sample, the present study considered mainly the urban affluent population with a moderate sample size in view of the fact that the increasing prevalence of noncommunicable diseases is primarily reported in such populations. Although Omron blood pressure monitor was used for measuring blood pressure, it was compared with sphygmomanometer before starting the study. Finally, out of the two readings of blood pressure, the second reading was used for analysis and is in line with the practice used in field studies.
In our study, the prevalence of adiposity was higher among women and was significantly so in case of abdominal obesity as assessed by either WC or WHR. Similar observation has been reported in parts of Rajasthan [17] and Delhi [18] in India. However, the prevalence of hypertension was higher among men than women. The fact that it was high even in the lower tertile of BMI, WC and WHR among men compared to that in women, suggests that factors other than adiposity, especially life style related ones, also have an independent effect on disease risk. For example, in India, men enjoy more freedom than women with regard to smoking and alcohol consumption, which are known to increase the CVD risks [19]. Secondly, the observed sex differences in the prevalence could also be due to the known benefits of estrogen hormone in women [20].
It was observed that although both WC and WHR increased with increase in BMI, the Pearson correlation coefficient of BMI with WC was significantly higher than that with WHR. Similar values of correlations have been reported for adult Caucasian women by Lofgren, I., et al. [21]. It is worthwhile to mention that the stronger correlation of intra abdominal fat as measured by MRI and CT scan with WC, compared to that with WHR [22], has led to the suggestion that WC should be used as an index of abdominal obesity and may be more sensitive in the assessment of disease risk than BMI alone.
The odds ratio for risk of hypertension in men was not significant for those in higher tertile of BMI or in higher tertile of WHR but was significant (p < 0.05) for those in higher tertile of WC. Among women, although it was significant for those in higher tertile of either BMI or WC or WHR, it was highest for WC. In fact, in case of WC alone, significant OR was seen even for those in the second tertile. High WC thus clearly identified risk of hypertension in both sexes.
The ROC analysis for risk of obesity (BMI >25 kg/m2) showed that WC was superior to WHR as the AUC as well as the sensitivity were considerably higher for WC in both sexes. Snehalatha, C., et al. [23] in a recent study on adult population from six cities in India have reported that WC appeared to be a more sensitive index than WHR for upper body adiposity, too. ROC cutoffs for risk of hypertension showed that among women, AUC was significant for all the three indices of adiposity, but it was largest and had higher sensitivity and specificity in case of WC. In men, it was only WC, which showed significant AUC while BMI and WHR did not. Thus, WC was a better predictor for obesity related health risk too, especially hypertension, in both sexes. Lean, M.E.J., et al. [10] also report that WC has a stronger association with metabolic functioning than with WHR and better predicted myocardial events. In fact, they found that BMI was not related with many of the known risk factors of CHD, whereas WC was related.
The WC cutoffs for risk of hypertension obtained in this study (86 cm for men and 79 cm for women) are comparable to those reported by Snehalatha, C., et al. [23] for South Indians (85 cm for men and 80 cm for women) and are slightly lower for men than those reported by Misra, A., et al. [15] for North Indians (90 cm for men and 80 cm for women). In case of other Asian populations, such cutoffs reported by Wildman, R.P., et al. [24] for adults from China (86 cm for both sexes) and those reported by Lin, W.-Y., et al. [25] for adults from Taiwan (80.5 cm for men and 71.5 cm for women) were on lower side. The predictive power of WC for CVD risk factors is thus population dependent and ethnic descent modifies the relationship between WC and metabolic risk factor.
In conclusion, our study provides compelling evidence that WC performs better in identifying obesity related health risk, specifically hypertension. Association of blood pressure and stroke is believed to be stronger in Asians than Western population. It has been estimated that reduction of 3 mmHg in DBP would reduce the number of strokes in Asia by one third. Identification of indicators predicting risk of hypertension therefore has an important societal implication [26]. Although there is no easy way to determine how low the cutoff should be, the important implication of the findings in this study is that WC can be used as a screening parameter, it could be used in health promotion programs to identify individuals who could be offered advice and would be the simplest measurement given that most people cannot calculate their BMI. Nevertheless, it cannot be denied that more studies on Asian population are required before singling out WC for assessment of CVD risks.
5. ACKNOWLEDGEMENTS
The authors are grateful to the Director, Agharkar Research Institute, Pune for giving institutional funding for carrying out the study and providing the necessary facilities. We greatly appreciate the help of other staff members in the department during the data collection.
REFERENCES
- WHO/IASO/IOTF. (2000) The Asia-Pacific perspective: redefining obesity and its treatment. Health Communications Australia Pty Limited. http://www.wpro.who.int/nutrition/documents/docs/Redefiningobesity.pdf
- Deurenberg, P., Yap, N. and van Staveren, W.A. (1998) Body mass index and percent body fat: A meta analysis among different ethnic groups. International Journal of Obesity and Related Metabolic Disorders, 22, 1164-1171. doi:10.1038/sj.ijo.0800741
- James, W.P., Chunming, C. and Inoue, S. (2002) Appropriate Asian body mass indices? Obesity Reviews, 3, 139. doi:10.1046/j.1467-789X.2002.00063.x
- Deurenberg, P., Deurenberg-Yap, M. and Guricci, S. (2002) Asians are different from Caucasians and from each other in their body mass index/body fat percent relationship. Obesity Reviews, 3, 141-146. doi:10.1046/j.1467-789X.2002.00065.x
- Banerji, M.A., Faridi, N., Atluri, R., Chaiken, R.L. and Lebovitz, H.E. (1999) Body composition, visceral fat, leptin and insulin resistance in Asian Indian men. The Journal of Clinical Endocrinology & Metabolism, 84, 137-144. doi:10.1210/jc.84.1.137
- Raji, A., Seely, E.W., Arky, R.A. and Simonson, D.C. (2001) Body fat distribution and insulin resistance in healthy Asian Indians and Caucasians. The Journal of Clinical Endocrinology & Metabolism, 86, 5366-5371. doi:10.1210/jc.86.11.5366
- Reddy, K.S., Prabhakaran, D., Shah, P. and Shah, B. (2002) Differences in body mass index and waist hip ratios in north Indian rural and urban populations. Obesity Reviews, 3, 197-202. doi:10.1046/j.1467-789X.2002.00075.x
- WHO Expert Consultation. (2004) Appropriate body mass index for Asian populations and its implications for policy and intervention strategies. Lancet, 363, 157-163. doi:10.1016/S0140-6736(03)15268-3
- Esmaillzadeh, A., Mirmiran, P. and Azizi, F. (2004) Waist to hip ratio is a better screening measure for cardiovascular risk factors than other anthropometric indicators in Tehranian adult men. International Journal of Obesity and Related Metabolic Disorders, 28, 1325-1332. doi:10.1038/sj.ijo.0802757
- Lean, M.E.J., Han, T.S. and Morrison, C.E. (1995) Waist circumference as a measure for indicating need for weight management. British Medical Journal, 311, 158-161. doi:10.1136/bmj.311.6998.158
- Chobanian, A.V., Bakris, G.L., Black, H.R., Cushman, W.C., Green, L.A., Izzo, J.L. et al. (2003) The 7th report of the joint national committee on prevention, detection, evaluation, and treatment of high blood pressure. The Journal of the American Medical Association, 289, 2560-2572. doi:10.1001/jama.289.19.2560
- Altman, D.G. (1991) Practical statistics for medical research. Chapman & Hall, London.
- Gupta, R. (1999) Hypertension in India—Definition, prevalence and evaluation. Journal of the Indian Medical Association, 97, 74-80.
- Banerji, M.A., Lebowitz, J., Chaiken, R.L., Gordon, D., Kral, J.G. and Lebovitz, H.E. (1997) Relationship of visceral adipose tissue and glucose disposal is independent of sex in black NIDDM subjects. American Journal of Physiology, 273, E425-E432.
- Misra, A., Vikram, N.K., Gupta, R., Pandey, R.M., Wasir, J.S. and Gupta, V.P. (2006) Waist circumference cutoff points and action levels for Asian Indians for identification of abdominal obesity. International Journal of Obesity, 30, 106-111. doi:10.1038/sj.ijo.0803111
- McNeely, M.J., Boyko, E.J., Shofer, J.B., Newell-Morris, L., Leonetti, D.L. and Fujimoto, W.Y. (2001) Standard definitions of overweight and central adiposity for determining diabetes risk in Japanese Americans. The American Journal of Clinical Nutrition, 74, 101-107.
- Gupta, R., Deedwania, P.C., Gupta, A., Rastogi, S., Panwar, R.B. and Kothari, K. (2004) Prevalence of metabolic syndrome in an Indian urban population. International Journal of Cardiology, 97, 257-261. doi:10.1016/j.ijcard.2003.11.003
- Gopalan, C. (1998) Obesity in the Indian Urban “middle class”. NFI Bulletin, 19, 1-4.
- Stranges, S., Wu, T., Dorn, J.M., Freudenheim, J.L., Muti, P., Farinaro, E., Russell, M., Nochajski, T.H. and Trevisan, M. (2004) Relationship of alcohol drinking pattern to risk of hypertension: A population based study. Hypertension, 44, 813-819.
- Lovejoy, J.C. (2003) The menopause and obesity. Primary Care, 30, 317-325. doi:10.1016/S0095-4543(03)00012-5
- Lofgren, I., Herron, K., Zern, T., West, K., Patalay, M., Shachter, N.S., Koo, S.I. and Fernandez, M.L. (2004) Waist circumference is a better predictor than body mass index of coronary heart disease risk in overweight premenopausal women. Journal of Nutrition, 134, 1071-1076.
- Han, T.S., McNeil, G., Seidell, J.C. and Lean, M.E. (1997) Predicting intra-abdominal fatness from anthropometric measures: The influence of stature. International Journal of Obesity and Related Metabolic Disorders, 21, 587-593. doi:10.1038/sj.ijo.0800446
- Snehalatha, C., Vishwanathan, V. and Ramachandran, A. (2003) Cutoff values for normal anthropometric variables in Asian Indian adults. Diabetes Care, 26, 1380-1384. doi:10.2337/diacare.26.5.1380
- Wildman, R.P., Gu, D., Reynolds, K., Duan, X. and He, J. (2004) Appropriate body mass index and waist circumference cutoffs for categorization of overweight and central adiposity among Chinese adults. The American Journal of Clinical Nutrition, 80, 1129-1136.
- Lin, Y.-W., Lee, L.-T., Chen, C.-Y., Lo, H., Hsia, H.-H., Liu, I.-L., Lin, R.S., Shau, W.Y. and Huang, K.C. (2002) Optimal cut off values for obesity: using simple anthropometric indices to predict cardiovascular risk factors in Taiwan. International Journal of Obesity and Related Metabolic Disorders, 26, 1232-38. doi:10.1038/sj.ijo.0802040
- Cheung, Y.B., Low, L., Osmond, C., Barker, D. and Karlberg, J. (2000) Fetal growth and early post natal growth are related to blood pressure in adults. Hypertension, 36, 795-800. doi:10.1161/01.HYP.36.5.795