Health
Vol. 4 No. 9A (2012) , Article ID: 23240 , 8 pages DOI:10.4236/health.2012.429109
Effects of healthy aging on human primary visual cortex
![]()
Department of Cognitive Sciences, University of California, Irvine, USA; *Corresponding Author: Haabrewer@uci.edu
Received 1 August 2012; revised 30 August 2012; accepted 8 September 2012
Keywords: Aging; Vision; Visual Field Mapping; Population Receptive Field Modeling
ABSTRACT
Aging often results in reduced visual acuity from changes in both the eye and neural circuits [1-4]. In normally aging subjects, primary visual cortex has been shown to have reduced responses to visual stimulation [5]. It is not known, however, to what extent aging affects visual field representations and population receptive sizes in human primary visual cortex. Here we use functional MRI (fMRI) and population receptive field (pRF) modeling [6] to measure angular and eccentric retinotopic representations and population receptive fields in primary visual cortex in healthy aging subjects ages 57 - 70 and in healthy young volunteers ages 24 - 36 (n = 9). Retinotopic stimuli consisted of black and white, drifting checkerboards comprising moving bars 11 deg in radius. Primary visual cortex (V1) was clearly identifiable along the calcarine sulcus in all hemispheres. There was a significant decrease in the surface area of V1 from 0 to 3 deg eccentricity in the aging subjects with respect to the young subjects (p = 0.039). The coherence of the fMRI% BOLD modulation was significantly decreased in the aging subjects compared to the young subjects in the more peripheral eccentricity band from 7 to 10 deg (p = 0.029). Finally, pRF sizes were significantly increased within the 0 to 3 deg foveal representation of V1 in the aging subjects compared to the young subjects (p = 0.019). Understanding the extent of changes that occur in primary visual cortex during normal aging is essential both for understanding the normal aging process and for comparisons of healthy, aging subjects with aging patients suffering from age-related visual and cortical disorders.
1. INTRODUCTION
Human visual cortex can be partitioned into distinct visual areas which serve separate perceptual functions and hierarchical stages of visual processing [7,8]. One important organizing principle within many visual areas is a topographical map of visual space, also called a visual field map. The organization of these maps follows the organization of the retina; hence, retinotopic visual field maps are cortical regions in which nearby neurons analyze the properties of nearby points of an image on the retina. The ability to measure visual field maps in vivo, along with the receptive field properties and stimulus selectivity of the various classes of neurons within these maps, is essential for understanding visual computations. In addition, knowledge of the normal cortical representations of the visual field allows us to study potential changes or reorganization within visual cortex under conditions that may lead to a disruption of the normal inputs to these maps [9-11].
While the organization and function of early visual cortex (i.e., V1, V2, V3) have been well characterized in human, these measurements have almost exclusively been in healthy young adults [5,12-15]. Very little is known about the effects of aging on the structural and functional properties of early visual field maps in human visual cortex. Behavioral, anatomical, and neuroimaging measurements have demonstrated several changes in healthy aging visual pathways that may contribute to reduced visual acuity in aging. For example, Elliot et al. [1,4] demonstrated that the decrease in contrast sensitivity at medium and high spatial frequencies seen with increasing age is likely due to retinal and cortical changes rather than optical changes in the eye. Although there was not a measurable decrease in the volume of primary visual cortex with age in one study [16], other studies showed a decline with age in the retinal nerve fiber layer thickness [17,18] and a loss of retinal photoreceptors [2]. In addition, aging has been shown to significantly increase neural response variability and decrease the response-to-noise ratio in V1 and MT in aging macaque monkeys, possibly from a degradation of inhibitory intra-cortical circuits in aging [19]. Together, these findings suggest that changes in V1 visual field representations and pRF properties may also occur in the normal aging process.
In one of the only studies that has focused on measurements of visual field maps in the aging population, Crossland et al. [5] used fMRI with traveling wave visual field mapping methods to show that V1 in healthy aging subjects has lower blood-oxygen-level-dependent (BOLD) activity compared to healthy young adults, but found no change in the overall size of V1. Importantly, their results also demonstrated that aging has no effect on fixation stability, thus paving the way for future aging studies also using visual field mapping methods, which rely on stable eye position for optimal measurements.
Understanding the changes that primary visual cortex undergo, if any, during normal aging is essential both for understanding the normal aging process and for comparison of healthy, age-matched controls with aging patients suffering from such age-related disorders as Alzheimer’s disease. Visual deficits, for example, are often reported as one of the first symptoms of AD and can include problems with contrast sensitivity, visual attention, visual processing speed, visual field defects, color discrimination, and feature recognition of complex objects such as faces [20-22]. As we begin to further investigate changes in visual cortex in age-related disorders like AD, it will be very important to distinguish cortical changes related to healthy aging from those resulting from the pathophysiology of the disease.
Here we use population receptive field (pRF) modeling [6] to further characterize detailed changes in primary visual cortex in healthy aging subjects compared to healthy young adults.
2. METHODS
2.1. Subjects
Nine subjects were recruited for this study: five healthy young adult subjects aged 24 - 36 years (mean age = 28 years; two female), and four healthy, normally aging subjects aged 57 - 70 years (mean age = 63.5 years; three female). The young adult subjects were recruited from the students and faculty at the University of California, Irvine (UCI). The aging subjects were recruited from the normally aging cohort enrolled at the Alzheimer’s Disease Research Center (ADRC) at UCI. Subjects are included in this cohort based upon neuropsychiatric testing and clinical diagnosis through the ADRC, with a normal Mini-Mental State Exam (MMSE) [23] score between 27 - 30. ADRC cohorts undergo a battery of tests and longitudinal data collection including: demographics, medical history, medications, family history, physical exam, neurological exam, cognitive testing and diagnosis, APOE genotypes, and comprehensive neuropsychological testing. Subjects recruited for this study had no history of previous head injury, alcoholic brain damage, a pre-existing visual disorder, or any additional significant physical or psychiatric conditions. All subjects had normal or corrected-to-normal visual acuity (20/25) with no underlying visual disease.
The experimental protocol was approved by the Institutional Review Board at UCI, and informed consent was obtained from all subjects. Each subject underwent 1 - 2 functional magnetic resonance imaging (fMRI) scan sessions, in which one high-resolution, T1-weighted anatomical volume, one T1-weighted in-plane anatomical scan, and 8 functional visual field mapping scans were collected.
2.2. Stimulus Presentation
Stimuli were generated using the Psychophysics Toolbox [24,25] in the Matlab programming environment on a Dell Optiplex desktop. Stimuli were back-projected via a Christie DLV1400-DX DLP projector onto a screen at the head end of the bore of the magnet (spatial resolution: 1024 × 768 pixels, refresh rate: 60 Hz). Subjects viewed the display on an angled front surface mirror mounted on the head coil close to the eyes with a viewing distance of approximately 70 cm. Head movements were minimized with padding and tape. Subjects were required to maintain fixation on a central cross for the duration of a single scan; regular blinking was encouraged. Each scan was approximately 3 minutes in length, with short breaks between each scan. Subjects were reminded to fixate before beginning the next scan. Eye position was verified using an MR-compatible long range remote eye tracking system (Applied Science Laboratories, Bedford, MA).
2.3. Anatomical Data
Scanning was conducted on the 3T Philips Achieva MR scanner at UCI with an 8 channel SENSE imaging head coil. One high-resolution, whole-brain anatomical data set was acquired for each subject (T1-weighted 3-D MPRAGE, 1 mm3 voxels, TR = 8.4 ms, TE = 3.7 ms, flip = 8˚, SENSE factor = 2.4). White matter for each individual subject was segmented using custom software and hand-edited to minimize segmentation errors [26]. Gray matter was grown from the segmented white matter to form a 4 mm layer covering the white matter surface. The cortical surface was then represented as a mesh at the white/gray-matter border, which was used to render a smooth 3-D cortical surface and to flatten the cortical representation, with light gray regions indicating gyri and dark gray regions representing sulci [27].
In addition, one anatomical in-plane image was acquired before each set of functional scans, with the same slice prescription as the functional scans (see Functional Data, below), but with a higher spatial resolution (1 mm × 1 mm × 3 mm voxels). These T1-weighted slices were physically in register with the functional slices and were used to align the functional data with the high-resolution anatomical data, first by a manual co-registration and then by a semi-automated 3-D co-registration algorithm, a mutual information method [28,29].
2.4. Functional Data
Functional MR data were acquired on the same scanner as the anatomical data, with ~35 oblique slices oriented close to parallel to the calcarine sulcus (T2-weighted, gradient echo imaging, TR = 2 s, TE = 30 ms, flip = 90˚, SENSE factor = 1.7, reconstructed voxel size of 1.875 × 1.875 × 3 mm, no gap). We analyzed fMRI data using custom Matlab software (http://white.stanford.edu/software) that is now widely used for neuroimaging analysis. For each subject, data in each fMRI session were analyzed voxel-by-voxel with no spatial smoothing. Head movements across scans were examined by comparing the mean value maps of the BOLD signals. No motion correction algorithm was applied here, because all scans had less than one voxel of head motion. The time series from each scan was high-pass filtered to remove low-frequency sources of physiological noise and averaged together to form one mean time series for each subject, which was then used in the pRF model analysis [6].
2.5. Visual Field Mapping Bar Stimuli
The moving bar stimulus was comprised of high-contrast, flickering, black and white checkerboard contrast patterns subtending a maximum radius of 11 deg of visual angle. The contrast pattern of the bar aperture consisted of rows that appeared to be moving in the opposite direction to adjacent rows, with each column spanning the length of the bar aperture and each row spanning its width. The bar apertures were displaced in discrete steps every 2 s in synchrony with the fMRI volume acquisition. The contrast pattern motion was at 2-Hz temporal frequency, and the motion direction changed randomly every 2 - 3 s. Four bar orientations (0, 45, 90, and 135 deg from vertical) with two motion directions orthogonal to each orientation were used, giving 8 different bar configurations for a total presentation time of 192 s at one cycle/scan. Four meanluminance periods for use in the pRF analysis [6] were inserted in the last 12 s of each 48 s period, at a frequency of 4 cycles/scan (a non-stimulus frequency). Subjects maintained fixation on one of two large fixation crosses, spanning either the diagonals from the corners of the field of view or the midpoints of each of the sides of the field of view. The lines of each fixation cross were roughly 0.5 deg wide, and they randomly switched between the two every 2 - 4 s as a drifting bar moved passed across the visual field. Subjects were instructed to attend to these moving bar apertures and were required to respond with a button press (not in sync with the visual stimulus position changes or mean-luminance periods) to an intermittent, subtle change in the motion direction of the checkerboard pattern.
2.6. Population Receptive Field Modeling Analysis
Population receptive field (pRF) modeling is a method for detailed visual field mapping experiments that was recently developed by Dumoulin and Wandell [6]. This method can estimate cortical visual field responses to any stimulus that periodically covers visual space (e.g., moving bars, expanding rings, rotating wedges).
Briefly, pRF modeling treats each voxel in a visual field map, which contains a population of neurons with similar RFs, as a pRF with a preferred center (x, y) and spread (σ) (also called pRF size). The model creates a bank of 2D Gaussian pRFs of numerous possible sizes and visual field locations spanning the field of view, convolves each predicted response to the presented stimulus with the hemodynamic response function (HRF) [30,31], and tests the result against the data. The pRF which best matches the data is then used to determine that voxel’s coherence and visual field representation. This method not only replicates results of visual field map measurements from the travelling wave method in a model-based way, but allows for additional measures such as pRF sizes (measured as σ). Complete details of the pRF model analysis are described in [6].
We used this model-based method to estimate visual field maps and population receptive fields (pRFs), defined as the region of visual space that activates the recording site. For each subject, eccentricity ( ) and angle (
 ) were derived from the 2D Gaussian models and plotted on the unfolded cortical surface.
We show parameter map estimates only when the percent variance explained of the pRF model estimate for the time series of that voxel’s blood oxygen-level dependent (BOLD) response is equivalent to or exceeds a coherence of 0.20. PRF modeling uses percent variance explained as a primary measurement of goodness-of-fit; here we convert to coherence values for comparison to typical phase-encoded travelling wave visual field mapping studies [6,7,32]. In typical phase-encoded measurements, each voxel is independently assigned a coherence value, which is equal to the amplitude of the BOLD signal modulation at the stimulus frequency divided by the square root of the power of the BOLD modulation at all other frequencies except the first and second harmonic. Only voxels with coherence values exceeding 0.20 are assigned a phase corresponding to that voxel’s peak response to the stimuli presented and considered for further analysis. This threshold has been commonly used in similar visual field mapping experiments both in normal subjects and in studies of cortical responses to retinal scotomas [10,32].
3. RESULTS
3.1. V1 Visual Field Map Definitions
We were able to easily define the boundaries of primary visual cortex in all subjects (Figure 1). In all hemispheres, as expected, V1 was located along the calcarine sulcus on the medial wall of the occipital lobe. The eccentricity gradient corresponding to the 11 deg radius of our stimulus spanned from the foveal representation (Figure 1, eccentricity-red/orange) on the occipital pole along calcarine to the more anterior peripheral representation (Figure 1, eccentricity-green/blue/ purple). Similarly, the polar angle gradient, the second dimension necessary to define a complete visual field map, spanned from the dorsal edge of the calcarine sulcus on the cuneus (Figure 1, polar angle-cyan) to the ventral edge of the calcarine sulcus on the lingual gyrus (Figure 1, polar angle-magenta), with the lower vertical
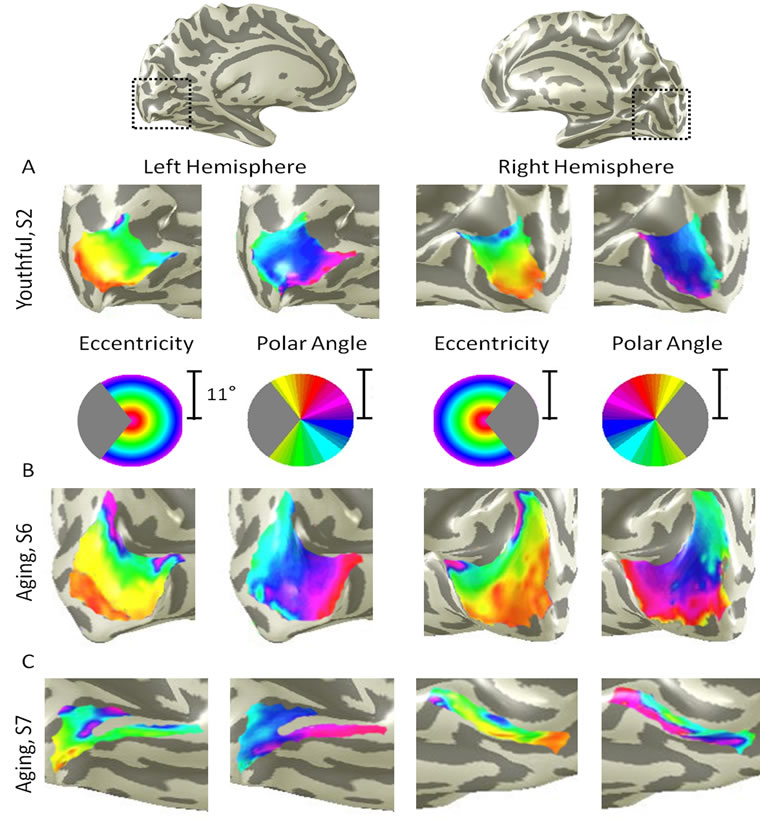
Figure 1. Primary visual cortex measurements in healthy young and aging subjects. (A) V1 example from a healthy young adult. A cropped, close-up view of the cortical surface near calcarine sulcus is shown for each measurement (polar angle, eccentricity) and each hemisphere. The pseudo-color overlay on each 3-D cortical rendering represents the position in visual space that produces the strongest response at each cortical location (see colored legend insets). The stimuli covered the central 11 deg radius of visual space. For clarity, the visual responses are only shown for the area of interest, V1, and only voxels with a powerful response at a coherence ≥0.20 are colored. Full hemisphere 3-D renderings at top depict the region of calcarine sulcus from which the cropped views are drawn (black dotted lines); (B) V1 example from a healthy aging subject. Note regular, organized, orthogonal V1 maps as seen in (A); (C) A second example from a healthy aging subject. While the organized V1 maps are still present in both hemispheres in this subject, note the visibly smaller size of V1.
meridian of visual space represented dorsally and vice versa. Because hemodynamic changes have been shown to occur with age, we identified the phases at which boundary reversals occurred in order to compare the correct stimulus location in visual space with the corresponding cortical responses [33,34]. V1 in all hemispheres contained a complete representation of the contralateral hemifield, as expected from previous measurements [5,7].
For the following measurements of V1 surface area, coherence, and pRF sizes, we divided up the eccentricity representation in each hemisphere of each subject into specific bands. For each V1, we created 10 regions of interest (ROIs) spanning 1 deg of visual angle along the eccentricity gradient from 0 to 10 deg, centered on every half degree (Figure 2). Each measurement was drawn from these 10 eccentricity-band ROIs for each subject and then averaged across subjects within each group.
3.2. V1 Surface Area
In order to examine differences in V1 sizes between groups, we compared the average surface area for each of the 10 eccentricity-band ROIs between the young and aging subjects (Figure 2A). Although we standardly define the boundaries of visual field maps on a flattened representation of cortex for optimal visualization of the polar angle and eccentricity gradients and boundaries, all ROIs are always transformed back into the 3-D cortical representation to make the measurements of surface area along the 3-D, folded cortical manifold to avoid the distortions induced by flattening cortex [7,15]. The total average surface area of V1 was 2160 mm2 (SD = 922 mm2) for aging subjects and 3350 mm2 (SD = 1034 mm2) for young subjects. A multivariate analysis of variance (MANOVA) found no significant difference in the surface area across the 10 eccentricity-band ROIs between youthful and aging subjects, F(6, 1) = 0.435, p = 0.820.
Figure 2A shows, however, a clear trend for decreased surface area in aging relative to youthful subjects for the subset of foveal ROIs ranging from 0 to 3 deg eccentric from fixation (Figure 2A, ROIs within dotted black lines). To determine whether the average surface area for the summed area of this subset of ROIs was significantly lower for aging relative to youthful subjects, we performed a post-hoc analysis using a one-tailed, independent-samples t-test. This analysis revealed a significant decrease in surface area within the central 3 deg of eccentricity for aging (M = 535 mm2, SD = 327 mm2) relative to youthful (M = 1182 mm2, SD = 456 mm2) subjects, t(6) = 2.123, p = 0.039.
3.3. V1 Coherence
To compare the levels of BOLD activity of V1 between young and aging subjects, we measured the average coherence of all voxels (no threshold) within each of the 10 eccentricity-band ROIs in V1 (Figure 2B). This average coherence per ROIs was then averaged by ROI across V1 maps within each subject group. A MANOVA revealed no significant difference in coherence across the 10 eccentricity-band ROIs between youthful and aging subjects, F(7, 1) = 1.492, p = 0.560.
However, note the trend in Figure 2B for decreased coherence for aging relative to youthful subjects for the subset of relatively peripheral ROIs ranging from 7 to 10 deg eccentric from fixation (ROIs within dotted back lines). To determine whether the average coherence for this subset of ROIs was significantly lower for aging relative to youthful subjects, we performed a post-hoc analysis using a one-tailed, independent-samples t-test. This analysis revealed a significant decrease in coherence within the peripheral 7 to 10 deg of eccentricity for aging (M = 0.57, SD = 0.04) relative to youthful (M = 0.67, SD = 0.04) subjects, t(7) = 2.347, p = 0.029.
3.4. pRF Sizes across V1
Finally, we measured the sizes of pRFs (σ) in V1 as a function of eccentricity, again averaged across subjects for each of the 10 eccentricity-band ROIs (Figure 2C). A MANOVA revealed no significant difference in pRF sizes across the 10 eccentricity-band ROIs between youthful and aging subjects, F(7, 1) = 2.632, p = 0.443.
Now note the trend in Figure 2C for increased pRF sizes for aging relative to youthful subjects for the subset of foveal ROIs ranging from 0 to 3 deg eccentric from fixation (ROIs within dotted back lines). To determine whether the average pRF size for this subset of ROIs was significantly larger for aging relative to youthful subjects, we again performed a post-hoc analysis using a onetailed, independent-samples t-test. This analysis revealed a significant increase in pRF sizes within the central 3 deg of eccentricity for aging (M = 2.08 deg, SD = 1.16 deg) relative to youthful (M = 0.76 deg, SD = 0.23 deg) subjects, t(7) = 2.541, p = 0.019.
4. DISCUSSION
Here we have shown differences in specific structural and functional characteristic of V1 between healthy aging and young subjects. We can next expand upon these measurements by examining such questions as whether similar changes are also seen in the surrounding maps of early visual cortex or in higher-order visual field maps of healthy aging subjects.
Our measurements of the V1 cortical surface area across the entire 10 eccentricity-band ROIs showed no significant difference between the subject groups. This result is consistent with the previous findings in healthy
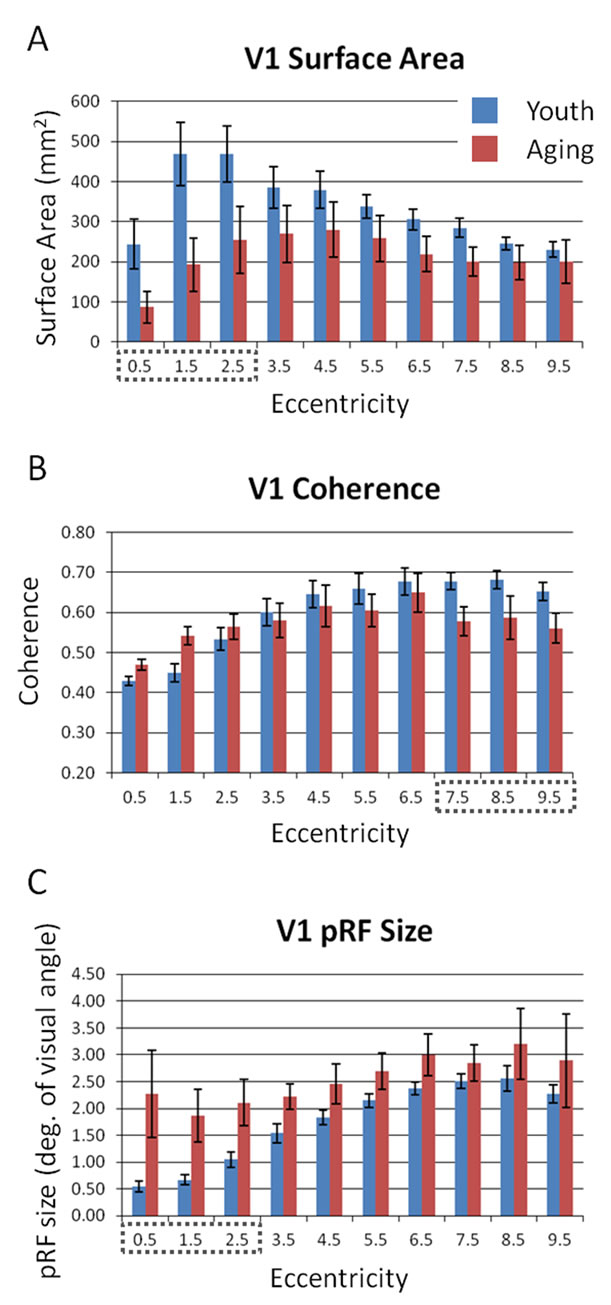
Figure 2. Comparisons of V1 properties between healthy young and aging subjects. (A) V1 surface area; (B) V1 coherence; (C) V1 pRF size. Red bars represent data from aging subjects, while blue bars represent data from young subjects. Each bar represents data measured in individual subjects and then averaged by eccentricity band across hemispheres. Error bars indicate SEM. Black dotted lines denote regions for each measurement shown to be significantly different between aging and youthful subjects; see text for details.
aging showing both no change in V1 volume [16] and no change in V1 surface area spanning the tested 15 deg radius field of view [5]. However, our post-hoc examination of the differences between subject groups demonstrated a significant decrease in the foveal surface area of V1 from 0 to 3 deg eccentricity for aging subjects. This foveal difference could be consistent with the decrease in visual acuity seen normally in aging [1-4]. Such a decrease in the size of the V1 foveal representation could lead to a loss in the resolution of cortical processing of visual information within the fovea, thus diminishing visual acuity.
We also found a significant difference for a subset of the eccentricity-band ROIs between subject groups for measures of V1 coherence. The coherence of the peripheral eccentricity band ROIs from 7 to 10 deg was significantly lower in aging subjects than in youthful subjects. This decrease in aging V1 coherence in the relative periphery may reflect cortical effects of the greater loss of photoreceptors in the peripheral retina seen in normal aging [2].
The few previous studies of aging in visual cortex have not measured this change in cortical activity in peripheral V1, but Crossland et al. [5] did note a decrease of activity in the aging foveal V1. However, they measured this change by first defining the surface area of V1 using the wedge stimulus (polar angle response) and then measuring the proportion of voxels activated by their ring stimulus (eccentricity response) within the polarangle defined span of V1. This produces a measure of the extent of activity within a visual field map more similar to our surface area measurements than to the coherence level. Our surface area measurements showing a decrease in foveal V1 size in aging subjects are consistent with this decreased active proportion of foveal V1 in their study. However, using coherence, which more directly measures the level of BOLD activity within these voxels driven by the visual stimulus, we did not measure a similar decrease in the activity of the foveal representations in aging subjects relative to youth. If anything, we note a small trend in Figure 2B toward an increase in the coherence of foveal V1 in the aging subjects. Perhaps such a trend for an increase in coherence could reflect the increased pRF size in the aging foveal representation, which may theoretically increase activity by averaging visual information over a set of larger receptive fields. A small number of highly active voxels could similarly produce an increase of coherence in this region with a small area of active voxels.
Finally, we measured a significant increase in pRF size in the foveal representation in aging V1 from 0 to 3 deg eccentricity. The ~2 deg foveal pRF size in the aging subjects is near that of the more peripheral pRFs (e.g., 5 - 7 deg eccentricity) in young adults seen in this study and previously [6]. It is possible that this increase in pRF size is a compensatory mechanism for the decrease in the aging V1 foveal surface area. This increase in pRF size could also account for the previously reported decrease in visual acuity in healthy aging [1-4]. In addition, the broadening of pRF sizes in the aging V1 fovea is consistent with the reports of decreased contrast sensitivity at medium and high spatial frequencies in normal aging [1]. It remains to be seen whether these changes in the pRF sizes in aging V1 are intrinsic to V1 or are the result of changes in other regions, such as retinal thinning or changes in feedback from higher order visual areas to V1.
Our present measurements represent what can be expected of healthy aging control subjects for studies of changes in visual cortex for such age-related disorders as Alzheimer’s disease. Thus, understanding the extent of changes that occur in primary visual cortex during normal aging is essential for understanding the normal aging process and can direct our examination of age-related visual and cortical disorders.
5. ACKNOWLEDGEMENTS
This work was supported by a grant to A.A.B. from the iMIND Institute and Alzheimer’s Disease Research Center at the University of California, Irvine, supported by the National Institutes of Health grant no. AG16573. The authors have no actual or potential conflicts of interest. A.A.B. and B.B. conceived of and designed the experiment and collected the data. B.B. processed and analyzed the data. The manuscript was written by A.A.B and then revised by B.B.
![]()
![]()
REFERENCES
- Elliott, D.B. (1987) Contrast sensitivity decline with ageing: a neural or optical phenomenon? Ophthalmic and Physiological Optics, 7, 415-419. doi:10.1111/j.1475-1313.1987.tb00771.x
- Gao, H. and Hollyfield, J.G. (1992) Aging of the human retina. Differential loss of neurons and retinal pigment epithelial cells. Investigative Ophthalmology & Visual Science, 33, 1-17.
- Kline, D.W., et al. (2001) Aging effects on vernier hyperacuity: a function of oscillation rate but not target contrast. Optometry & Vision Science, 78, 676-682. doi:10.1097/00006324-200109000-00013
- Whitaker, D. and Elliott, D.B. (1992) Simulating agerelated optical changes in the human eye. Documenta Ophthalmologica, 82, 307-316. doi:10.1007/BF00161018
- Crossland, M.D., et al. (2008) The effect of age and fixation instability on retinotopic mapping of primary visual cortex. Investigative Ophthalmology & Visual Science, 49, 3734-3739. doi:10.1167/iovs.07-1621
- Dumoulin, S.O. and Wandell, B.A. (2008) Population receptive field estimates in human visual cortex. Neuroimage, 39, 647-660. doi:10.1016/j.neuroimage.2007.09.034
- Wandell, B.A., Dumoulin, S.O. and Brewer, A.A. (2007) Visual field maps in human cortex. Neuron, 56, 366-383. doi:10.1016/j.neuron.2007.10.012
- Felleman, D.J. and Essen, D.C.V. (1991) Distributed hierarchical processing in the primate cerebral cortex. Cerebral Cortex, 1, 1-47. doi:10.1093/cercor/1.1.1-a
- Baseler, H.A., et al. (2011) Large-scale remapping of visual cortex is absent in adult humans with macular degeneration. Nature Neuroscience, 14, 649-655. doi:10.1038/nn.2793
- Baseler, H.A., et al. (2002) Reorganization of human cortical maps caused by inherited photoreceptor abnormalities. Nature Neuroscience, 5, 364-370. doi:10.1038/nn817
- Smirnakis, S.M., et al. (2005) Lack of long-term cortical reorganization after macaque retinal lesions. Nature, 435, 300-307. doi:10.1038/nature03495
- DeYoe, E.A., et al. (1996) Mapping striate and extrastriate visual areas in human cerebral cortex. Proceedings of the National Academy of Sciences (USA), 93, 2382-2386.
- Dougherty, R.F., et al. (2003) Visual field representations and locations of visual areas V1/2/3 in human visual cortex. Journal of Visual, 3, 586-598. doi:10.1167/3.10.1
- Sereno, M.I., et al. (1995) Borders of multiple visual areas in humans revealed by functional magnetic resonance imaging. Science, 268, 889-893. doi:10.1126/science.7754376
- Brewer, A.A. and Barton, B. (2012) Visual field map organization in human visual cortex. in: Molotchnikoff, S., Ed.,Visual cortex, InTech.
- Raz, N., et al. (2004) Aging, sexual dimorphism, and hemispheric asymmetry of the cerebral cortex: replicability of regional differences in volume. Neurobiology of Aging, 25, 377-396. doi:10.1016/S0197-4580(03)00118-0
- Parikh, R.S., et al. (2007) Normal age-related decay of retinal nerve fiber layer thickness. Ophthalmology, 114, 921-926. doi:10.1016/j.ophtha.2007.01.023
- Balazsi, A.G., et al. (1984) The effect of age on the nerve fiber population of the human optic nerve. American Journal of Ophthalmology, 97, 760-766.
- Yang, Y., et al. (2009) Aging affects response variability of V1 and MT neurons in rhesus monkeys. Brain Research, 1274, 21-27. doi:10.1016/j.brainres.2009.04.015
- Cronin-Golomb, A., et al. (1993) Incomplete achromatopsia in Alzheimer’s disease. Neurobiology of Aging, 14, 471-477. doi:10.1016/0197-4580(93)90105-K
- Holroyd, S. and Shepherd, M.L. (2001) Alzheimer’s disease: a review for the ophthalmologist. Survey of Ophthalmology, 45, 516-524. doi:10.1016/S0039-6257(01)00193-X
- Tang-Wai, D.F., et al. (2004) Clinical, genetic, and neuropathologic characteristics of posterior cortical atrophy. Neurology, 63, 1168-1174. doi:10.1212/01.WNL.0000140289.18472.15
- Folstein, M.F., Folstein, S.E. and McHugh, P.R. (1975) “Mini-mental state”. A practical method for grading the cognitive state of patients for the clinician. Journal of Psychiatric Research, 12, 189-198. doi:10.1016/0022-3956(75)90026-6
- Brainard, D.H. (1997) The psychophysics toolbox. Spatial vision, 10, 433-436. doi:10.1163/156856897X00357
- Pelli, D.G. (1997) The VideoToolbox software for visual psychophysics: transforming numbers into movies. Spatial vision, 10, 437-442. doi:10.1163/156856897X00366
- Teo, P.C., Sapiro, G. and Wandell, B.A. (1997) Creating connected representations of cortical gray matter for functional MRI visualization. IEEE Transactions on Medical Imaging, 16, 852-863. doi:10.1109/42.650881
- Wandell, B.A., Chial, S. and Backus, B.T. (2000) Visualization and measurement of the cortical surface. Journal of Cognitive Neuroscience, 12, 739-752. doi:10.1162/089892900562561
- Nestares, O. and Heeger, D.J. (2000) Robust multiresolution alignment of MRI brain volumes. Magnetic Resonance in Medicine, 43, 705-715. doi:10.1002/(SICI)1522-2594(200005)43:5<705::AID-MRM13>3.0.CO;2-R
- Maes, F., et al. (1997) Multimodality image registration by maximization of mutual information. IEEE Transactions on Medical Imaging, 16, 187-198. doi:10.1109/42.563664
- Boynton, G.M., et al. (1996) Linear systems analysis of functional magnetic resonance imaging in human V1. The Journal of Neuroscience, 16, 4207-4221.
- Friston, K.J., et al. (1998) Event-related fMRI: characterizing differential responses. Neuroimage, 7, 30-40. doi:10.1006/nimg.1997.0306
- Brewer, A.A., et al. (2005) Visual field maps and stimulus selectivity in human ventral occipital cortex. Nature Neuroscience, 8, 1102-1129. doi:10.1038/nn1507
- D’Esposito, M., Deouell, L.Y. and Gazzaley, A. (2003) Alterations in the BOLD fMRI signal with ageing and disease: a challenge for neuroimaging. Nature Reviews Neuroscience, 4, 863-872. doi:10.1038/nrn1246
- D’Esposito, M., et al. (1999) The effect of normal aging on the coupling of neural activity to the bold hemodynamic response. Neuroimage, 10, 6-14. doi:10.1006/nimg.1999.0444