Engineering
Vol.11 No.02(2019), Article ID:90878,12 pages
10.4236/eng.2019.112010
Prediction of Weld Penetration Size Factor (WPSF) of TIG Mild Steel Weldment Using Fuzzy Logic
Nweze Stephanie1, Achebo Joseph Ifeanyi2
1Department of Mechanical and Mechatronics Engineering, AE-FUNAI University, Ikwo, Nigeria
2Department of Production Engineering, University of Benin, Benin City, Nigeria

Copyright © 2019 by author(s) and Scientific Research Publishing Inc.
This work is licensed under the Creative Commons Attribution International License (CC BY 4.0).
http://creativecommons.org/licenses/by/4.0/


Received: December 26, 2018; Accepted: February 25, 2019; Published: February 28, 2019
ABSTRACT
Predicting weld responses is a very important but difficult area in the field of welding which can greatly reduce the overall cost of try and error method for any fabrication industry. Fuzzy logic expert tool was used to predict the weld penetration size factor of a weld. The aim of this study is to predict the weld penetration size factor (WPSF) of TIG mild steel welds using fuzzy logic. In this study, the weld specimens were produced using the TIG welding process guided by the central composite experimental design, and thereafter the weld penetration size factor (WPSF) was measured. The process parameters include the voltage, current, gas flow rate and welding speed. The model’s significance, strength and adequacy were checked; for fuzzy logic, fuzzification was done using fuzzy linguistic variable, fuzzy linguistic terms and membership function after which an inference was made based on a set of rules and the output result was defuzzified to a crisp output. Fuzzy logic predicted beyond the boundaries of the given range of parameters. The model developed has proven to be very effective in predicting responses even before actual weld is initiated.
Keywords:
WPSF, Fuzzy Logic, Weld Penetration, Defuzzified

1. Introduction
Low weld quality can result from poor combination of the welding input parameters. Therefore, the need for optimization of input parameters in order to obtain the best quality of weld is unending. In Nigeria, the need for quality weld is gradually attracting the interest of Manufacturing and Industrial Engineers, as the importance of a good quality welded joint, which will result in good service life of weld, cannot be over emphasized. Injuries/damages result from catastrophic weld failures in fabrication yards; construction sites, such as church building collapse, have remained uninvestigated in most cases in Nigeria and therefore there is a need to educate local welders on the relevance to improve the weld quality. The mechanical strength of a weld can give good insights about the quality of the weld bead geometry, which can be described by the Bead Width, Height, Reinforcement, Weld Reinforcement Form Factor (WRFF) and Weld Penetration Size Factor (WPSF). WRFF and WPSF fall under the umbrella of the weld bead shape. [1] opined that the weld bead shape of a welded joint determined the mechanical properties of the joint. [2] said that weld bead shape was an indication of bead geometry. The quality of weld deposit also known as weld bead depends on the metallurgical formulation of its bead geometry. [3] said that the study of weld bead geometry dealt with the estimation of depth of penetration, area of bead, and dilution. [1] defined Weld Penetration Shape Factor as the ratio of the weld width to the penetration and, also defined Weld Reinforcement Form Factor as the ratio of weld width to reinforcement height. According to [4] , the welded joint is considered to be sound and economical if it has a maximum penetration, minimum bead width, reinforcement and dilution. These qualities can be achieved if the input parameters are optimally selected. [5] had the opinion that the strength of a welded joint could be influenced by the composition of the metal, distortion of the heat affected zone and also the weld bead shape. Welding Technology and Science is a dominant phenomenon in the area of Manufacturing Engineering. This has made it a field of global interest for engineers and scientists who have continually developed new methods for investigating the scope and quality of weld metal deposits. Weld metal deposits constitute the welded joint of structural materials where failure resulting from weld decay which mostly occurs due to the distortion of metal grains and absorption of moisture within the heat affected zones during welding.
To have real control over the strength of the eventual weld product, precise relationships between the process parameters and the bead parameters controlling the bead shape need to be established. [6] investigated the effect of welding parameters on bead geometry. [7] investigated the effect of process parameters of TIG welding like weld current, gas flow rate, work piece thickness on the bead geometry of SS304. It was found that the process parameters considered affected the mechanical properties to a great extent. [8] developed a relationship between welding parameters and weld bead profile parameters of GTAW welded experimental data by using conventional regression analysis and the neural network based approach. [9] was of the opinion that welding parameters must be optimized in order to obtain a good weld joint with the required bead geometry and bead quality. [10] wrote that in the field of welding, weld quality mainly depended on the mechanical properties of the weld metal and heat affected zone (HAZ) which in turn is influenced by metallurgical characteristics and chemical compositions of the weld. Moreover, according to the authors, these mechanical-metallurgical features of the weldment depend on the weld bead geometry, which are directly related to welding process parameters. In other words, weld quality depends on welding process parameters. [11] predicted the GMAW bead geometry. In their work the GMAW bead height, bead width, weld penetration and weld cross sectional area were predicted accurately by using the fuzzy clustering algorithm. [2] opined that quality has now become an important issue in today’s manufacturing world.
In this study, fuzzy logic inferential capability was applied to predict the response. This investigation is geared towards improving the quality and strength properties of weld bead shape factors and geometry.
2. Materials and Methods
2.1. Materials
The Tungsten Inert Gas (TIG) machine was used to weld 10 mm mild steel plates measuring 60 mm in length, 40 mm in width. One hundred and Fifty (150) pieces of plate were cut with the edges bevelled, machined and etched with a 2% NaCl. This experiment was repeated 30 times with each experiment having five specimens, thereby producing a total of one hundred and fifty welded joints. The input parameters used for this study were welding speed, current, arc voltage, and gas flow rate as shown in Table 1. The TIG machine was connected to a welding gun and shielding gas consisting of 100% argon. The weld planimeter and weld bead profiler were used to determine the dimensions of the bead geometry. Figure 1 shows the General structure of fuzzy inference system.
2.2. Methods
In this study, thirty experimental runs were carried out, each experimental run comprising the current, voltage, welding speed and gas flow rate, used to join two pieces of mild steel plates measuring 60 mm × 40 mm ×10 mm. The weld penetration size factor was measured. The results are shown in Table 2.
2.2.1. Modelling and Prediction Using Fuzzy Logic
A fuzzy logic system (FLS) can be defined as the nonlinear mapping of an input data set to a scalar output data.
The process of fuzzy logic is explained as follows: Firstly, a crisp set of input data are gathered and converted to a fuzzy set using fuzzy linguistic variables,

Table 1. Welding process parameters limits.
Table 2. Experimental result for the WPSF.
fuzzy linguistic terms and membership functions. This step is known as fuzzification. Afterwards, an inference is made based on a set of rules. Lastly, the resulting fuzzy output is mapped to a crisp output using the membership functions, in the defuzzification step.
In this study we developed a fuzzy logic system to predict the weld penetration size factor (WPSF), based on four input variables, namely, voltage, current, welding speed and gas flow rate.

Figure 1. General structure of fuzzy inference system.
2.2.2. Prediction of Weld Penetration Size Factor Using Fuzzy Logic
Defining the Linguistic Variables and Terms
Linguistic variables are the input or output variables of the system whose values are words or sentences from a natural language, instead of numerical values. A linguistic variable is generally decomposed into a set of linguistic terms. Consider a welding process aimed at predicting the weld penetration size factor (WPSF). Let voltage (v), current (c), welding speed (ws) and gas flow rate (gfr) be the linguistic variables which represents the weld factors. To qualify the voltage, current, welding speed and gas flow rate, terms such as (very low, low, moderate, high and very high) are used in real life.
For this problem, the linguistic variables and their range of values include:
1) Voltage; this range from 20 to 24 volts;
2) Current; this range from 140 to 160 amps;
3) Welding speed; this range from 150 to 170 mm/min;
4) Gas flow rate; this range from 12 to 14 L/min;
5) Weld penetration size factor; this range from 1.002 to 2.990 mm.
The range of the input and output variable were extracted from the experimental design summary presented in Table 1. The fuzzy logic tool box that defines the input and output variables is presented in Figure 2.
1) Defining the Inputs and Output Membership Function
Membership functions are used in the fuzzification and defuzzification steps of a Fuzzy Logic Systems (FLS), to map the non-fuzzy input values to fuzzy linguistic terms and vice versa. A membership function is used in most cases to quantify a linguistic term. An important characteristic of fuzzy logic is that a numerical value does not have to be fuzzified using only one membership function. In other words, a value can belong to multiple sets at the same time.
As mentioned earlier, five membership functions were selected for each input and output variable namely; very low, low, moderate, high and very high. Figure 3 shows the definition of the membership function for voltage.
Figure 3 shows the membership function for voltage. The voltage range is specified as (18 26) while the membership set that defines very low voltage is given as (16 18 20). The membership function type is the triangular membership function.
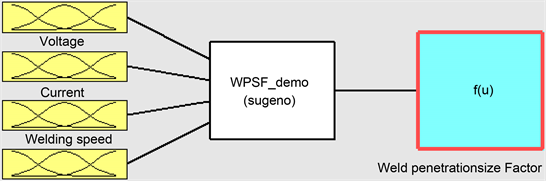
Figure 2. Defining the input and output variables.
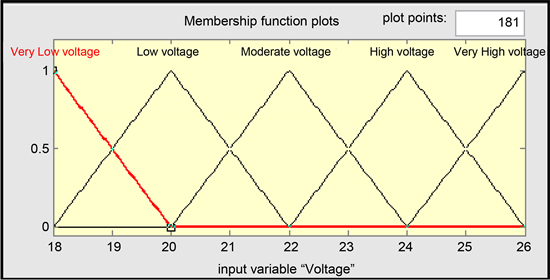
Figure 3. Definition of membership function for voltage (very low voltage).
Figure 4 shows the membership function for voltage. The voltage range is specified as (18 26) while the membership set that defines low voltage is given as (18 20 22). The membership function type is the triangular membership function.
Figure 5 shows the membership function for voltage. The voltage range is specified as (18 26) while the membership set that defines moderate voltage is given as (20 22 24). The membership function type is the triangular membership function.
Figure 6 shows the membership function for voltage. The voltage range is specified as (18 26) while the membership set that defines high voltage is given as (22 24 26). The membership function type is the triangular membership function.
Figure 7 shows the membership function for voltage. The voltage range is specified as (18 26) while the membership set that defines very high voltage is given as (24 26 28). The membership function type is the triangular membership function.
We applied same method to set up the membership function current, welding speed and gas flow rate. Our result summary is presented in Table 3 showing all the membership steps.
2) Fuzzy Rules
A simple fuzzy logic code is written to control the output variable. Fuzzy rule
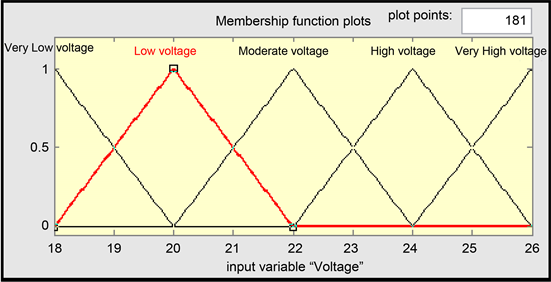
Figure 4. Definition of membership function for voltage (low voltage).

Figure 5. Definition of membership function for voltage (moderate voltage).

Figure 6. Definition of membership function for voltage (high voltage).
is simply an “IF-THEN” rule with a condition and a conclusion. Five critical rules were constructed to predict the weld penetration size factor based on fuzzy logic. Figure 8 shows the fuzzy rule editor containing the five critical rules

Figure 7. Definition of membership function for voltage (very high voltage).

Figure 8. The critical rules constructed for predicting WPSF using fuzzy logic.
constructed for this problem.
The simplified form of Figure 8 is presented as follows:
1) If voltage is low and current is high and welding speed is high and gas flow rate is high, weld penetration size factor is very low;
2) If voltage is high and current is high and welding speed is low and gas flow rate is low, weld penetration size factor is low;
Table 3. Summary results of membership function and membership sets.
3) If voltage is high and current is low and welding speed is low and gas flow rate is low, weld penetration size factor is moderate;
4) If voltage is low and current is high and welding speed is low and gas flow rate is low, weld penetration size factor is high;
5) If voltage is moderate and current is moderate and welding speed is moderate and gas flow rate is very low, weld penetration size factor is very high.
3. Results and Discussion
3.1. Predicting WPSF Using Fuzzy Logic
Figure 9 shows the predictions interface for fuzzy logic systems using matlab.
From the result of Figure 9, it was observed that; for a voltage of 22 volt, current of 150 Amp, welding speed 160 mm/min and gas flow rate of 11 L/min, the predicted weld penetration size factor was 2.99 mm. The same procedure was applied in generating the rest result as shown in Table 4.
3.2. Discussion of Results
The surface plot which shows the relationship between the input and the output variable is presented in Figure 10 and Figure 11.
Result of Figure 10 and Figure 11 shows the dependence of the output variables on the input variable (weld penetration size factor). It shows clearly that any change in the input variable will result in a significant change in the output variable.
To check the prediction accuracy of the fuzzy logic tool, values form Table 2 were selected at random and compared with our fuzzy logic values corresponding to the same process parameters, where the results are presented in Table 4. It can also be deduced from the graph that the fuzzy logic prediction.
The randomized selected results obtained from fuzzy logic for maximized weld penetration size factor, is presented in Table 4 in relation to the actual experiment which indicates that result of Fuzzy logic were very close to results of the actual or observed experiment as shown in Figure 12.
This research work has thrived in developing a prediction of welds of extremely high quality of TIG welding process using fuzzy logic through which the effects of their various process parameters and their interactions were determined and predictions made on expected quality of the weld at known process

Figure 9. Prediction of WPSF using fuzzy logic.

Figure 10. Influence of voltage and welding speed on WPSF.
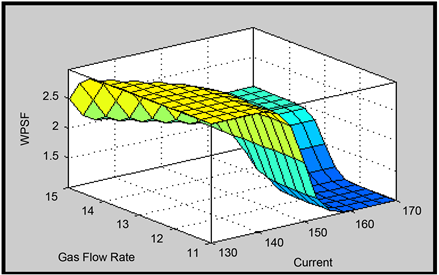
Figure 11. Influence of gas flow rate and current on WPSF.
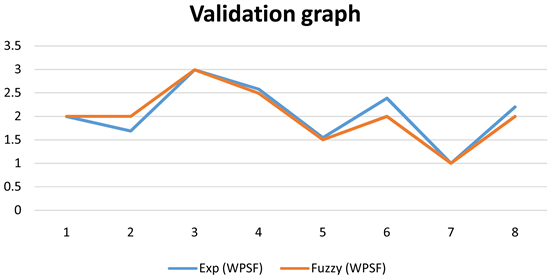
Figure 12. Graph of exp and fuzzy against number of randomly selected samples.
Table 4. Prediction of WPSF using fuzzy logic and experimental means.
parameters.
Additionally, the following have been ascertained in this study:
1) Welding speed and gas flow rate are found to have great influence on weld penetration size factor as compared to current and voltage at a moderate level;
2) Fuzzy logic was able to predict the expected responses accurately even beyond the boundaries of the given parameters.
4. Conclusion
A novel concept of an intelligent model has been developed to predict welding process parameters (current, voltage, welding speed and gas flow rate) and bead parameters (WPSF) for improved quality welds using fuzzy logic. The results of this study will help reduce the cost of expensive analytical methods employed during welding operation and it will help fabrication industries to maximize the quality of their products with minimal stress and eliminate time used for trial and error experiment during welding.
Conflicts of Interest
The authors declare no conflicts of interest regarding the publication of this paper.
Cite this paper
Stephanie, N. and Ifeanyi, A.J. (2019) Prediction of Weld Penetration Size Factor (WPSF) of TIG Mild Steel Weldment Using Fuzzy Logic. Engineering, 11, 119-130. https://doi.org/10.4236/eng.2019.112010
References
- 1. Mistry, P.J. (2016) Effect of Process Parameters on Bead Geometry and Shape Relationship of Gas Metal Arc Weldments. International Journal of Advanced Research in Mechanical Engineering & Technology, 2, 24-27.
- 2. Kumar, V. (2011) Modeling of Weld Bead Geometry and Shape Relationships in submerged Arc Welding Using Developed Fluxes. Jordan Journal of Mechanical and Industrial Engineering, 5, 461-470.
- 3. Narayama, A. and Srihari, T. (2011) Optimization of Weld Bead Geometry in MIG Welding Process Using Response Surface Methodology. International Journal of Science and Technology, 2, 27-34.
- 4. Dhasand, J.E.R. and Satheesh, M. (2013) Sensitivity Analysis of Submerged Arc Welding Parameters for Low Alloy Steel Weldment. Indian Journal of Engineering and Materials Sciences, 20, 425-434.
- 5. Omajene, J.E., Martikainen, J. and Kah, P. (2014) Effect of Welding Parameters on Weld Bead Shape for Welds Done Underwater. International Journal of Mechanical Engineeering and Applications, 2, 128-134. https://doi.org/10.11648/j.ijmea.20140206.17
- 6. Choudhary, D., Jindal, S. and Mehta, N.P. (2011) To Study the Effect of Welding Parameters on Weld Bead Geometry in SAW Welding Process. Elixir Mech. Engg, 40, 5519-5524.
- 7. Gadewar, S.P., Swaminadhan, P., Harkare, M.G. and Gawande, S.H. (2010) Experimental Investigation of Weld Characteristics for a Single Pass TIG Welding with SS304. International Journal of Engineering Science and Technology, 2, 3676-3686.
- 8. Dutta, P. and Partilhar, D.K. (2007) Modeling of TIG Welding Process Using Conventional Regression Analysis and Neural Network-Based Approaches. Journal of Material Processing Technology, 184, 56-68. https://doi.org/10.1016/j.jmatprotec.2006.11.004
- 9. Benyonnis, K.Y. and Olabi, A.G. (2008) Optimization of Different Welding Processes Using Statistical and Numerical Approaches. Advances in Engineering Software, 39, 483-496. https://doi.org/10.1016/j.advengsoft.2007.03.012
- 10. Esme, U., Bayramoglu, M., Kazancoglu, Y. and Ozgun, S. (2009) Optimization of Weld Bead Geometry in TIG Welding Process Using Grey Relation Analysis and Taguchi Method. Materials and Technology, 43, 143-149.
- 11. Kim, I.S., Son, J.S., Kim, H.H., Kim, I.J. and Kang, B.Y. (2006) A Study on Fuzzy Logic Theory to Predict the Process Parameters in GMA Welding Process. Materials Science Forum, 505-507, 541-546. https://doi.org/10.4028/www.scientific.net/MSF.505-507.541