Materials Sciences and Applications
Vol. 4 No. 4A (2013) , Article ID: 30410 , 8 pages DOI:10.4236/msa.2013.44A003
Magnetooptical Properties of Layer-by-Layer Deposited Ferromagnet—Dielectric Nanocomposites*
![]()
1Physics Faculty, Lomonosov Moscow State University, Moscow, Russia; 2Voronezh State Technical University, Voronezh, Russia.
Email: #v.e.buravtsova@gmail.com
Copyright © 2013 V. E. Buravtsova et al. This is an open access article distributed under the Creative Commons Attribution License, which permits unrestricted use, distribution, and reproduction in any medium, provided the original work is properly cited.
Received February 5th, 2013; revised March 1st, 2013; accepted April 2nd, 2013
Keywords: Magnetooptics; Nanostructure; Composites
ABSTRACT
The present work was initiated to investigate how technology of preparation of nanocomposites (Co45Fe45Zr10) Z(Al2O3)1−Z affects their magneto-optical (MO) properties. The spectral, magnetic field and concentration dependences of the transversal Kerr effect (TKE) have been studied either for bulk or layer-by-layer deposited nanocomposites within a wide range of the ferromagnetic (FM) phase concentrations and for various thicknesses of layers. It was found that the MO response of the layer-by-layer deposited nanocomposites with compositions inside the percolation interval differs essentially from the one of the bulk composites and depends on the layer thicknesses. With decreasing thicknesses of layers the percolation threshold has been shifted towards the lower contents of the FM phase. In addition, it has been established that the size and shape of the granules inside the nanocomposite layer also depends on the layer thickness as well as the microstructure of the layer-by-layer sputtered composites considerably differs from the microstructure of the bulk nanocomposite.
1. Introduction
The steady current interest to nanostructures is caused by possibility to modify and fundamentally change properties of the known materials when they turn into a nanocrystalline state. New nanodimensional magnetic materials exhibit a number of extraordinary properties: a giant magnetoresistance (GMR), giant magnetic impedance (GMI) [1], anomalous Hall effect (AHE) [2], strong magnetooptical (MO) response [3] and anomalous optical effects [4]. All these phenomena open vast prospects both for fundamental investigations and most promising possibilities for their applications. Wide use of nanocomposites as magnetic layers in multilayer structures ferromagnet/semiconductor [5,6] for reduction of diffusion on the metal-semiconductor interfaces requires both optimization of their compositions and technologies of manufacturing film nanocomposites and investigation how their microstructure affects their electrical, magnetic and optical properties.
The properties of nanocomposites depend critically on their composition and microstructure, particularly on the size of the granules, their distribution by volume of the sample, on the magnetic phase concentration and interface properties. That is why optical and MO investigation techniques are of much interest, since they possess a number of advantages, the main of which is that these methods are sensitive to presence of magnetic heterogeneities, to changes of particle shape and size, their threedimensional distribution and appearance of new magnetic phases. This is confirmed by recent investigations of optical and MO spectra of granular systems [4,7-13], that revealed many particularities of linear and non-linear optical and MO Kerr effect and many other properties.
In the present publication we compare MO properties of the thin-film nanocomposites, prepared by evaporation on a fixed substrate (bulk composites) and the nanocomposites, prepared by layer-by-layer deposition of thin layers.
First a brief description of MO properties of bulk nanocomposites. Studies of MO properties of bulk nanocomposites with various chemical compositions, both ferromagnetic granules (Co84Nb14Ta2, Co40Fe40B20, Co45- Fe45Zr10, Со, FePt), and a dielectric matrix (SiO2, Al2O3 LiNbO) [14-17] have shown that MO spectra substantially differ from witnesses’ spectra, FM alloys and Co. The TKE spectra demonstrate a strong nonmonotonous dependence on the metallic volume fraction with a crossover at the percolation threshold. In the near IR range we observed appreciable enhancement of the TKE in the granulated system which occurs near to the percolation threshold.
Studies of MO properties of amorphous metal-dielectric bulk nanocomposites have shown that changes of MO properties in all our systems with increasing concentration proceed virtually identically [14,15]. The TKE spectra of nanocomposites of all systems demonstrate similar frequency dependencies, varying only in details, namely by magnitude of the effect, as well as position of maximums and zero points of the effect Figure 1(А)
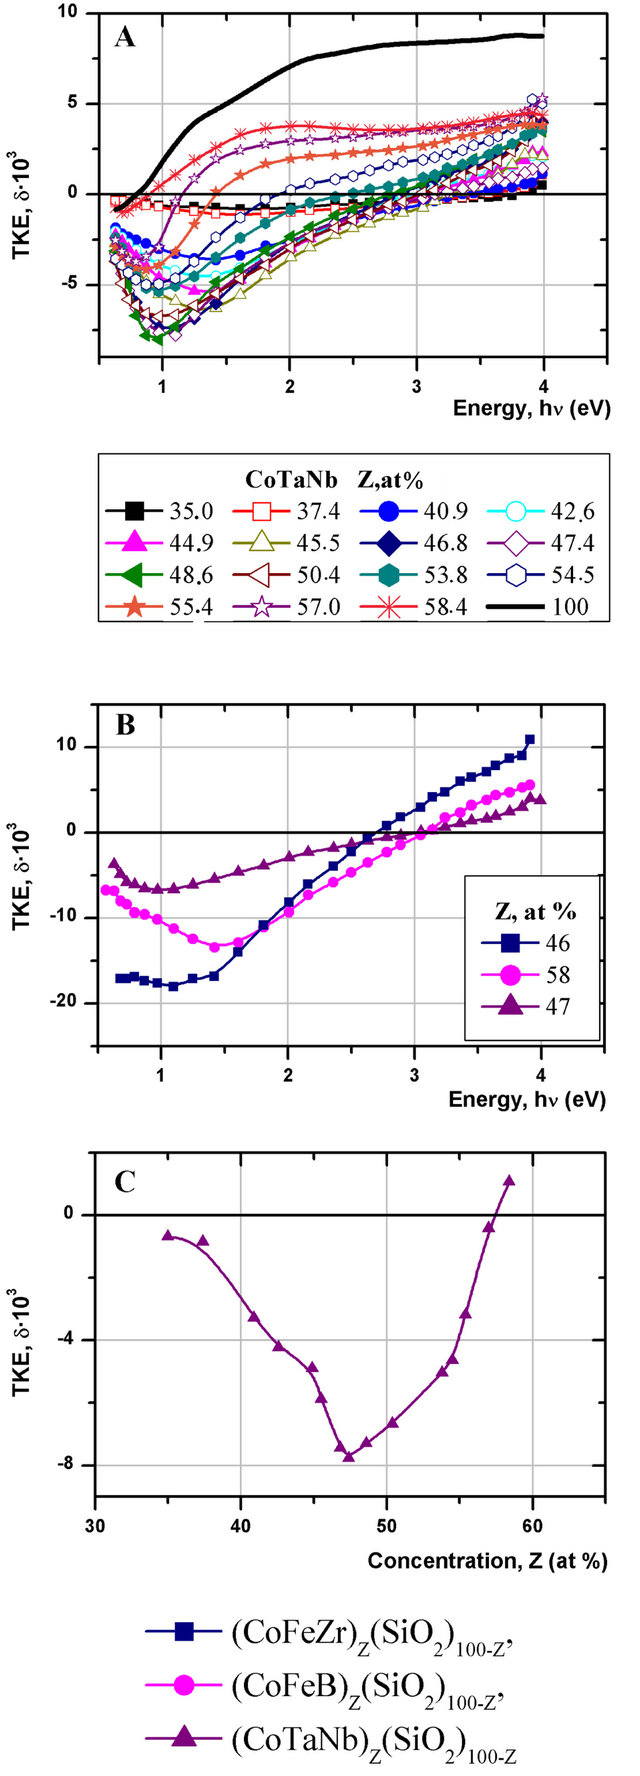
Figure 1. (А), (В)—spectral, (C)—concentration dependences of TKE for nanocomposites: (Co45Fe45Zr10)Z(SiO2)100−Z, (Co40Fe40B20)Z(SiO2)100−Z, (Co84Nb14Ta2)Z(SiO2)100−Z.
example of spectra of nanocomposite (Co86Nb12Ta2)Z (SiO2)100−Z in the wide concentration range, В—spectra of nanocomposites with different compositions, the FM phase concentration being near the percolation threshold). Particularly large variations of δ(hν) are found in energy range hν < 1.5 eV. While in pure alloys (Co84Nb14Ta2, Co40Fe40B20, Co45Fe45Zr10) and in Co with decrease of light energy the TKE magnitude decreases to zero (δ ≈ 0 at hν = 0.7 eV), in nanocomposites the effect changes sign and reaches extreme negative values in the energy range 0.7 - 1.2 eV. By their absolute value the TKE of nanocomposites in this spectral interval is several times larger, than in the witness, i.e. pure ferromagnetic alloy. At the same time it should be remembered that in amorphous nanocomposites, demonstrating the largest TKE magnitudes, the magnetic phase content is virtually two times less as compared with the ferromagnetic alloy.
The TKE dependence on content of the FM phase is nonmonotonic (Figure 1(С)) shows the TKE dependence on concentration for the nanocomposite (Co86Nb12Ta2)Z (SiO2)100−Z). The largest variations of TKE demonstrate the samples with magnetic phase concentration corresponding to the relevant percolation threshold. The effect magnitude essentially depends on chemical composition of the granules. Maximum magnitudes of MO response are achieved in the systems with Zr as amorphizator, at Z = 47 at%, in the system with Boron content at Z = 58 at% and in the system with niobium and tantalum at Z = 46 at% [15]. Concentration position of the maximum is determined by geometrical particularities of the composites, which are near percolation threshold—minimal thickness of the dielectric barrier, through which the tunneling of polarized electrons is going between the FM granules.
Evolution of the TKE magnetic field dependence with increase of the FM phase content is also similar in all the systems studied [14,15]. As example in Figure 2 are
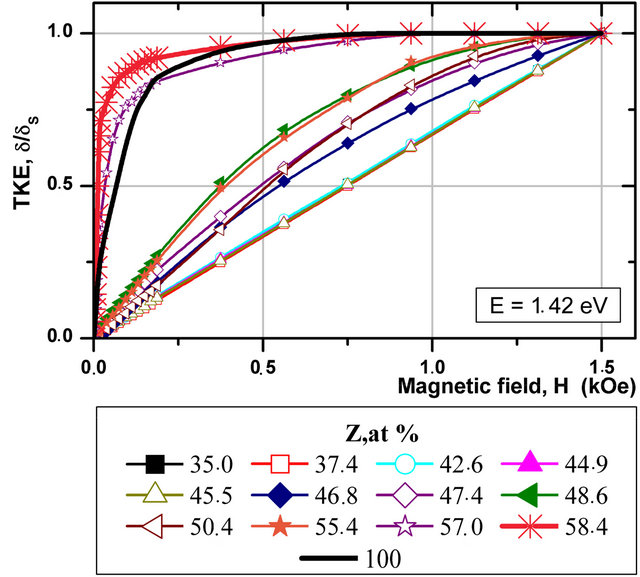
Figure 2. Field dependences of TKE for (Co86Nb12Ta2)Z(SiO2)100−Z.
shown the TKE magnetic field dependence of a series of nanocomposites (Co86Nb12Ta2)Z(SiO2)100−Z, measured at hν = 1.42 eV (normalized). Three concentration regions can be seen which correspond to different magnetization processes. The first group of samples with low content of metallic phase Z < 46 at% demonstrates linear growth of TKE with increase of magnetic field up to H = 1.5 kOe. Such behavior of the d(Н) curves testifies to superparamagnetic type of magnetization, what is typical for samples up to percolation threshold. For these samples the size of equilibrium granules is 2 - 4 nm. For samples of the second group with Z within 46 - 55 at%, the d(Н) dependence changes, acquiring features typical for bulk ferromagnets (witnesses). At that the size of the granules in this structure increases up to 5 - 7 nm. Nanocomposites of the third group, that are beyond percolation threshold (Z > 55 at%), demonstrate magnetization of a ferromagnetic type. For them magnetization process ends mainly in the field up to 1 kOe. Such behavior of the d(Н) dependences may be explained by microstructure change dynamics of our nanocomposites: in structures with low ferromagnet content (Z ≤ 46 at%) the metallic part of the nanocomposite represents independent granules, noninteracting with each other, their magnetic behavior close to the superparamagnetic type; with increase of the ferromagnetic phase content the dielectrical interlayers, which divide these regions, become thinner, thus interaction between granules becomes possible and the ferromagnetic contribution into MO response of the structure increases. The increase of the ferromagnetic contribution may be also caused by growing size of ferromagnetic granules. For ferromagnet content around Z ~ 46 at%, i.e. in the percolation threshold, the ferromagnetic component of the sample is magnetized as a large single cluster, but apparently, there are also small separate magnetic clusters, which do not interact with each other, and add a superparamagnetic contribution into magnetooptical response of the nanostructure.
Investigation of magnetoresistance and magnetostriction [15] of the same samples have shown a correlation between maximum magnitudes of the giant magnetoresistance (GMR), transversal Kerr effect (TKE) and magnetostriction of constituting FM granules (Figure 3). With linear increase of saturation magnitudes of magnetostriction of ferromagnetic inclusions, when passing from CoNbTa to CoFeB and further to CoFeZr both GMR and TKE grow linearly.
The observed correlations between saturation magnetostriction of the ferromagnetic phase, maximum magnitudes of the giant magnetoresistance and the TKE are caused by one and the same mechanism and may be related to increasing contribution of d-electrons and magnitude of the spin-orbital interaction in the series of granular nanocomposites CoNbTa ®CoFeB® CoFeZr. It
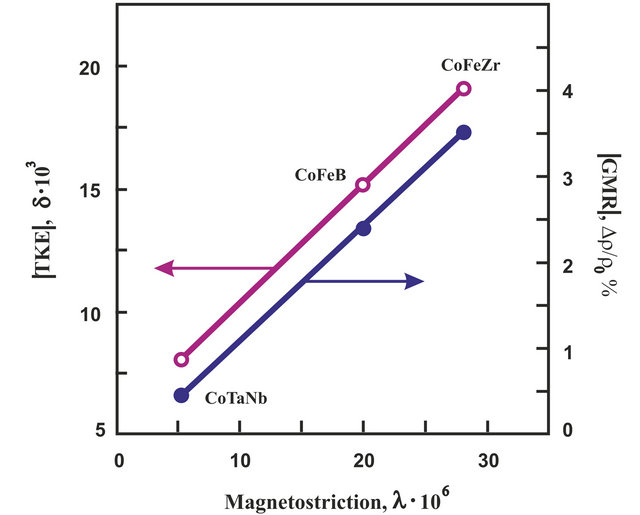
Figure 3. The correlation between the GMR, TKE and magnetostriction of FM granules for nanocomposites (Co45Fe45Zr10)57(SiO2)43, (Co40Fe40B20)60(SiO2)40 and (Co84Nb14Ta2)61(SiO2)39.
was also established that in nanocomposites of this type the dominant charge transfer process from granula to granula is by mechanism of hopping conduction of electrons across the dielectrical barrier [14-17]. Density of states of the polarizerd d-electrons near Fermi level depends on the granule material and it grows in the series of granular nanocomposites CoNbTa®CoFeB®CoFeZr, what as a consequence, leads to increase of magnetoresistance, magnetostriction and MO effects. Thus, MO methods allow to follow the changes of a nanocomposite structure and determine percolation threshold in nanocomposites by maximum magnitudes of the effect in IR region, and by deviation from linearity of the δ(Н) dependence.
Calculations of the MO spectra using different effective medium approximations show that the observed changes in the MO spectra can be described using the optical and MO data typical for the bulk materials, both of grains and the matrix, but taking into account the size and shape of the particles. Thus, MO response of a composite medium depends on the form and size of granules, and its amplification near the percolation threshold is caused by changes of optical and MO parameters under influence of topology and modifications of nanocomposite microstructure [14].
Since the composite layers were supposed to be used as magnetic layers with thickness of the order of several nanometers in multilayer films of nanocomposite/semiconductor type, so there emerged a problem to follow the changes of MO properties of the nanocomposite itself with variation of its thickness. For this purpose we have studied MO properties of bulk nanocomposites (Co45 Fe45Zr10)Z(Al2O3)1−z and layer-by-layer deposited nanocomposites, prepared by the same technology as the multilayer films [(Co45Fe45Zr10)X/(a-Si)Y] in [5].
2. Samples. Preparation and Structure
Bulk granular amorphous films containing nano-dimensional clusters of the Co45Fe45Zr10 alloy randomly distributed in the insulating amorphous matrix Al2O3 were prepared in argon atmosphere by ion-beam sputtering of compound targets, containing both the ferromagnetic and the dielectric components, on pyroceram substrates. The choice of a rather complicated composition of the granules Co45Fe45Zr10 was determined by the requirement to stabilize the amorphous structure of the ferromagnet at room temperatures.
During simultaneous sputtering of both the metallic alloy and the dielectric from the compound target a fragmented structure forms composed of metallic amorphous granules imbedded inside the dielectric matrix, a wide and continuous range of the ferromagnetic phase concentrations x from 30 to 60 at% being obtained. The manufactured film samples were about 4 mm thick. When the concentration of dielectric was maximum the average size of ferromagnetic granules sputtered on a static substrate was 2 - 4 nm. With decrease of the dielectric fraction content the size of ferromagnetic granules increases, and in nanocomposites with large concentrations of the metallic phase (x = 50 - 60 at%) it becomes 5 - 7 nm (Figure 4). Deposition of solid nanocomposites was performed in vacuum 1 × 10⁻⁵ Torr onto non-cooled fixed pyroceram substrates.
The layered granular amorphous films were deposited layer by layer onto rotating substrate by the same technology as the multilayer films [5]. Varying the rotation speed of a special device (“carousel”), on which the substrate is fixed, it is possible to obtain various thicknesses of nanocomposite layers. Number of “carousel” revolutions corresponds to the number of deposited layers, what allows controlling the total film thickness. The thicknesses of the layers in the layered granular films were 1 - 2.7 nm for the 1st series and 2.7 - 5.8 nm for the 2d one. Number of layers in the 1st series structures was 101, and in the 2d series –40.
The magnetooptical properties have been studied by the transversal Kerr effect (TKE). It consists in relative
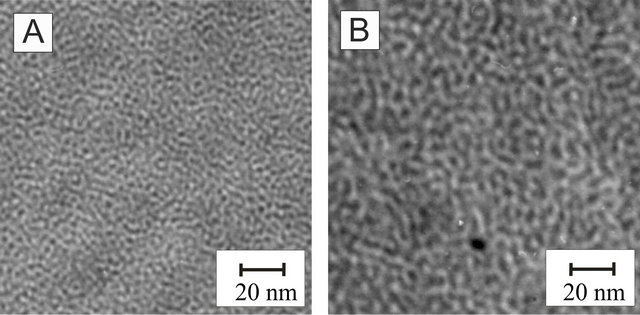
Figure 4. Photomicrographs of bulk nanocomposites (Co45Fe45Zr10)Z(SiO2)100−Z: (A) for Z = 35 at%; (B) Z = 45 at%.
change of the intensity of the linearly polarized light (p-wave) reflected from the sample in the case when magnetization vector is parallel to the surface and at the same time lies perpendicular to the incident light plane (the transversal geometry):
 .
.
Here IH and IH=0 are intensities of the light reflected by the magnetized and non-magnetized sample correspondingly. The measurements of TKE were performed using a dynamic method developed for measuring MO-effects [18] in which the remagnetization of the sample by the AC magnetic field leads to a modulation of the reflected light intensity, the depth of which determines the magnitude d of the MO effect. The TKE spectra d(hn) and the magnetic field dependence curves d(H) were measured in the 0.5 - 4.0 eV photon energy range for the incidence angle j = 70˚ in the AC magnetic field of 78 Hz frequency and amplitude up to 2.5 kOe.
3. Experiment and Discussion
The TKE spectral and magnetic field dependence in layer-by-layer deposited structures of 1 and 2 series and the bulk composite are shown in Figures 5 and 6. Similar
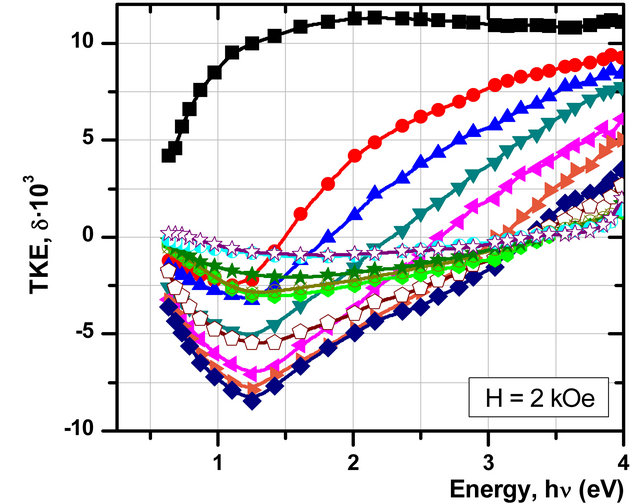
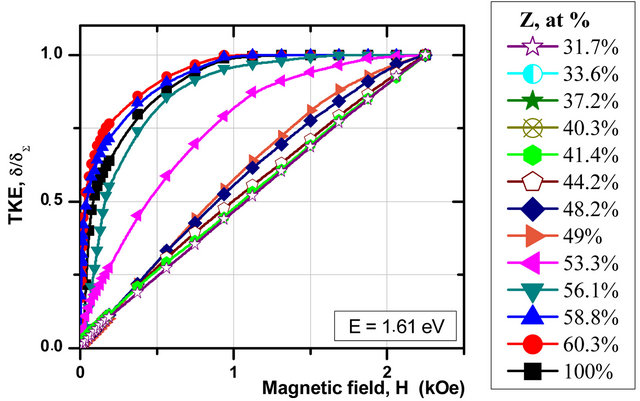
Figure 5. Spectral and field dependences of TKE for bulk nanocomposites (Co45Fe45Zr10)Z(Al2O3)100−Z.
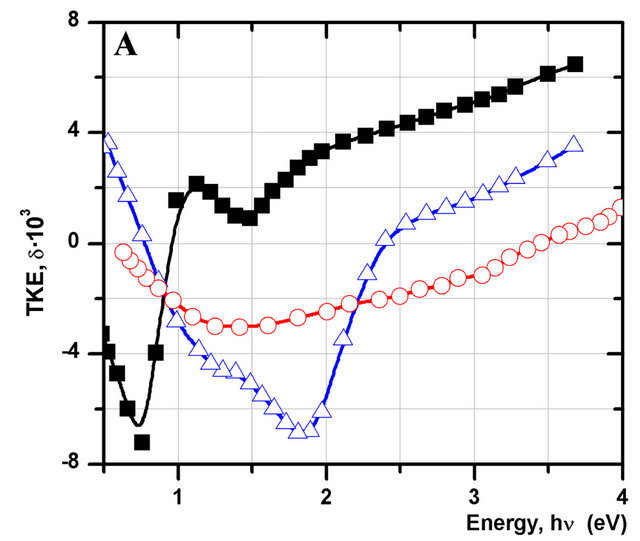

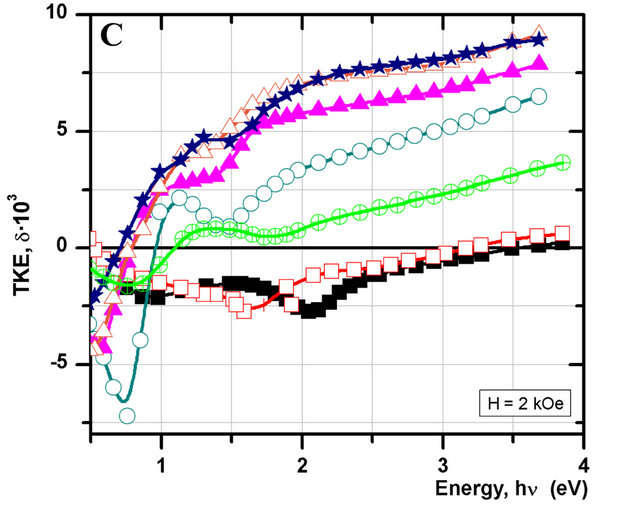
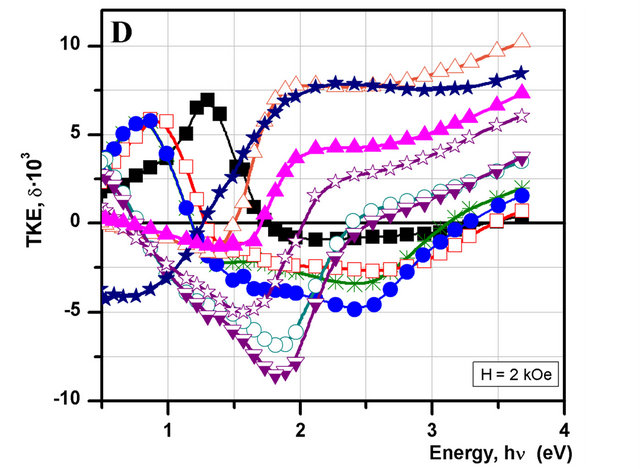
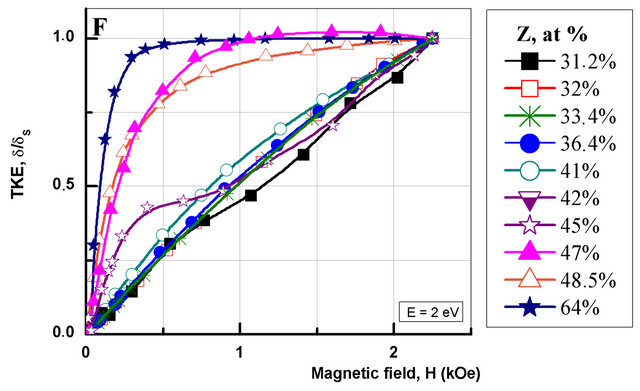
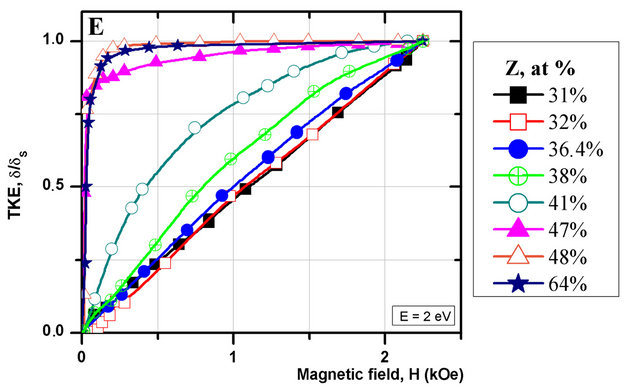
Figure 6. The comparison of spectral (A) and field (B) dependences for bulk and “layer by layer” nanocomposite (Co45Fe45Zr10)Z(Al2O3)100−Z with different thickness of forming layers; (C)-(F) spectral and field dependences for the 1st and 2d series “layer by layer” nanocomposite (Co45Fe45Zr10)Z(Al2O3)100−Z.
to the previously investigated nanocomposites the bulk composites demonstrate substantial modification of the ТKЕ spectra shape and magnitude according to the FM phase concentration and appearance of a big negative effect in the energy range below 2 eV, with concentrations near percolation threshold and smaller. Yet the form of spectra curves substantially changes when we pass to the layer-by-layer deposited nanocomposites.
Thus in the series 1 samples the ТКЕ is negative in the near IR and visible range (0.5 - 3.25 eV) and only on condition that Z ≤ 33.1%, what is similar to the TKE spectra of the bulk nanocomposite with the same concentration Z. With increasing FM phase content (Z ≥ 36.4 at%) the shape of the spectra appreciably changes and becomes similar to the TKE spectrum of the bulk (Co45Fe45Zr10)Z(Al2O3)100−Z with concentration Z ~ 64 at%: the negative sign of the effect was observed in the energy range up to 1 eV, and in the rest part of the spectrum (1 - 3.5 eV) the TKE is positive.
In the TKE spectra of the 2 series samples up to concentration Z = 36.4 at% in the visible light range a negative effect was observed, what corresponds to the spectra of bulk composite films, but in the IR spectral range there is seen a positive peak of the effect uncharacteristic for bulk nanocomposites. At the same time the maximum magnitude of the TKE in the IR range is several times larger than TKE amplitude in a similar content FM phase samples of bulk nanocomposites with increasing the FM phase concentration the positive effect in the IR range sharply falls, and in the rest of the spectrum the effect magnitude grows. At Z = 41 аt% the 2 series samples demonstrate the maximum magnitude of the effect, twice as large as in the bulk sample with the same concentration. With increasing concentration Z up to 64 at% the TKE spectra of both series, deposited by layer-by-layer procedure, become analogous to each other and similar to δ(hν) in the bulk nanocomposite with Z ~ 60 at%.
Changes of the TKE magnetic field dependences of the layer-by-layer deposited samples show the same tendency as the bulk nanocomposite—with increase of Z content the magnetization curves evolve from a superparamagnetic type to the ferromagnetic one (Figure 6). Yet if deviation from the linear (superparamagnetic) type is observed in the bulk nanocomposite with Z ≤ 48 at%, then in the layer-by-layer deposited composites it takes place at Z ≤ 36.4 at% for the 1st series and 41 at% for the 2d one. Such behavior of the magnetic field ТKЕ dependences, together with the observed ТKЕ growth in the near IR region and modifications of the ТKЕ curves shape—all this points to the fact that percolation threshold in the layer-by-layer deposited composites moves into the region of lesser FM phase concentrations. So, taking into consideration all the above resemblances and differences between the layer-by-layer deposited samples and the bulk nanocomposite, one can say that not only the metallic phase concentration affects the МО response of the systems, but as well the thickness of the composite layers essentially affects the magnetooptical properties of nanostructures.
The changes in the preparation technology of the structures lead to changes in microstructure (topology). This results in another grain sizes, different number of contacts between grains, and, therefore, the MO response also changes (Figure 7).
The film thickness is predetermined by the substrate rotation velocity around sputtering targets [5]. Between depositions of each layer some time elapses, during which the thinner film will be cooled faster than the thicker one. The bulk composite was deposited onto a fixed substrate, so the structure formation temperatureremained the same. Supposing that during cooling down of thin layers formation of the granules proceeds differently than in the bulk composite, it will be logical to as sume that the size of the granules in the layer-by-layer
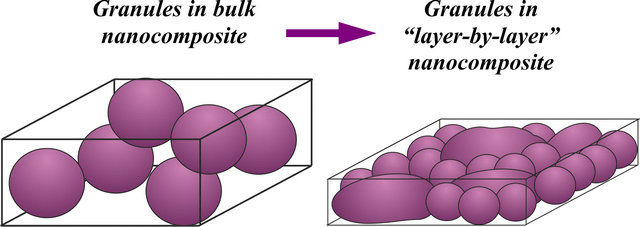
Figure 7. Model of the microstructure of bulk and “layer-by-layer” nanocomposites.
deposited samples is smaller than their characteristic size in the bulk composite. Thus, the probability of the granules to contact each other becomes greater when sizes of the granules diminish. That is the system with most thin layers should have the percolation threshold at smallest Z values among all the studied systems, which is what we observe in experiment.
Figure 8 shows the TKE-concentration dependence for all our systems. It is seen that in the near IR region (Е ≤ 2.55 эВ) all the systems demonstrate a non-monotonic ТКЕdependence on FM phase concentration, the greatest changes taking place in the percolation region. Yet if for the bulk nanocomposite the shape of the curves does not depend on the light wavelength and all the curves show peaks at Z = Zper (where Zper was obtained from magnetic field dependence), then for the layer-by-layer nanocomposite the shape of the curves δ(Z) depends strongly on the light wavelength. At the same time for energies Е ≥ 1.22 eV the series 1 near Zper exhibits only a local minimum on the curve δ(Z) that grows monotonically with increase of concentration Z, while for series 2 the local extremum at Z = Zper is observed in the energy range 1.22 eV ≤ Е ≤ 1.73 eV, at Е = 0.76 eV and 2.55 eV the local extremum shifts into the lesser concentrations region, and at Z = Zper a zero crossover is seen.
More complicated nature of the concentration curves δ(Z) for the layer-by-layer nanocomposites is an evidence of their greater heterogeneity. This is also witnessed by dependence of the δ(Н) curve shape on the light wavelength and appearance of anomalous ТКЕ magnetic field dependences measured in the near IR range. Figure 9 demonstrates anomalous field depend
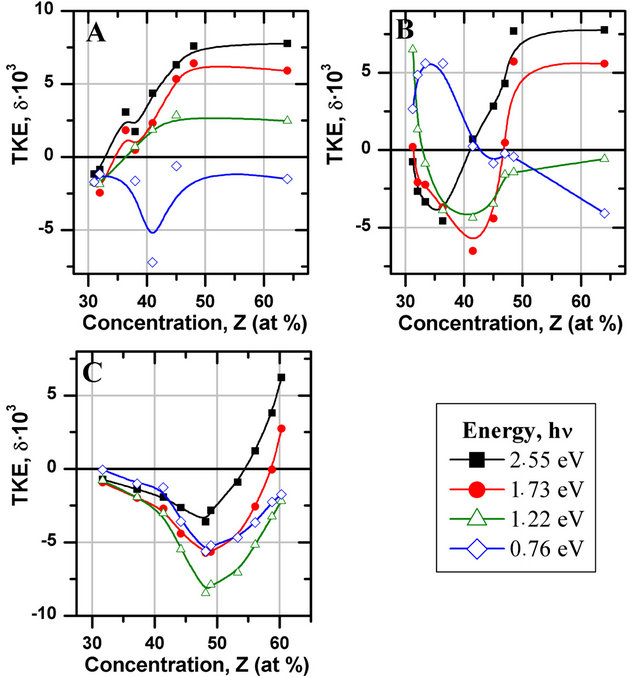
Figure 8. Concentration dependences of TKE for nanocomposite (Сo45Fe45Zr10)Z(Al2O3)100−Z: (А) 1st series (the thickness of forming layers ~1 – 2.3 nm); (B) 2d series (the thickness of forming layers 2.7 - 6 nm); (C) bulk nanocomposite.
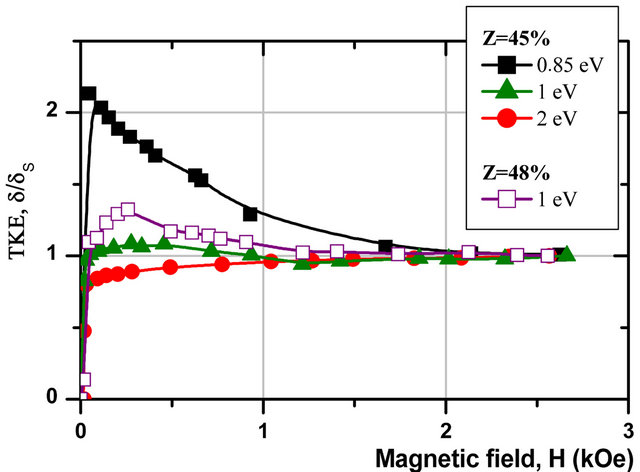
Figure 9. Anomalous field dependencies of TKE for samples 1st series (the values are normalized to the value of TKE at maximum field).
ences for several samples of the series 1. The appearance of these anomalies can be explained if we assume that during fabrication process there are formed not only magnetic granules with the size smaller, than in the bulk composite, but also rather big FM clusters, which add their contribution to the МО response of the whole system. In other words we can say that anomalous curve δ(Н) is a sum of contributions of two magnetically different phases: a ferromagnetic and superparamagnetic one, at that the superparamagnetic granules produce TKE of one sign, and the ferromagnetic ones of the opposite. Thus in small field there appears a sharp saturation for the ferromagnetic phase, and with increasing magnetic field a superparamagnetic phase begins to saturate, for which the TKE have opposite sign, what results in reduction of the cumulative magneto-optical response. Taking into consideration that in the whole investigated energy range the TKE in CoFeZr is positive, and in the nanocomposite (Co45Fe45Zr10)Z(Al2O3)100−Z in the region before percolation—negative, we can suppose that FM contribution in weak fields is associated with remagnetization of big CoFeZr clusters, and superparamagnetic contribution (in stronger fields)—with magnetization of the whole nanocomposite. By competition of these two contributions we can apparently explain a shift of the TKE spectral dependences for the 1 system into the positive region at Z > 36 аt%, relatively the bulk composite (Figure 6). For the 2 system with increase of the deposited layers thickness the contribution of big CoFeZr clusters becomes smaller, and a more complicated dependence of concentration vs. wavelength is observed.
To sum up, the experimental data obtained for the systems of nanocomposites deposited by thin layers, proves that shape and dimensions of the granules in nanocomposite layer depend on the layer thickness; the microstructure of layers is essentially different from the microstructure of the bulk nanocomposite. This should be taken into account in analysis of experimental data for multilayer nanocomposite/semiconductor systems.
4. Conclusion
We have carried out studies of magnetic and magnetooptical properties of (Co45Fe45Zr10)Z(Al2O3)100−Z nanocomposites, prepared by layer-by-layer sputtering of thin layers, over a wide range of layers thickness and concentrations of the ferromagnetic phase. There has been found a strong influence of preparation technology and technological parameters (the resulting layer thickness, ferromagnetic phase concentration) on magnetic and magnetooptical properties. Evolution of the spectra and found anomalies of the TKE magnetic field dependences for a number of samples strongly suggest that the films are magnetically heterogenous, and along with small isolated Co45Fe45Zr10 granules in the layer-by-layer deposited nanocomposite there are rather big FM clusters. In the layer-by-layer deposited composites, there was found a shift of the percolation threshold in the direction of lesser FM phase concentrations, the greater shift found in films with lesser layers thickness. It was proved that both size and shape of the granules in the nanocomposite layer depend on layer thickness, and microstructure of the layer-by-layer deposited composites considerably differs from the microstructure of the bulk nanocomposites.
REFERENCES
- S. Mitani, H. Fujimori, K. Takanashi, K. Yakusiji, J. G. Ha, S. Takanashi, S. Maekawa, S. Ohnuma, N. Kobayashi, T. Masumoto, M. Ohnuma and K. Hono, “Tunnel-MR and Spin Electronics in Metal-Nonmetal Granular Systems,” Journal of Magnetism and Magnetic Materials, Vol. 198-199, 1999. pp. 179-182. doi:10.1016/S0304-8853(98)01041-5
- J. C. Slonczewski, “Conductance and Exchange Coupling of Two Ferromagnets Separated by Tunneling Barrier,” Physical Review B, Vol. 39, No. 10, 1989, pp. 6995-7002. doi:10.1103/PhysRevB.39.6995
- E. Ganshina, A. Granovsky, B. Dieny, R. Kumaritova and A. Yurasov, “Magneto-Optical Spectra of Discontinuous Multilayers Co/SiO2 with Tunnel Magnetoresistance,” Phy- sica B, Vol. 229, No. 3-4, 2001, pp. 260-264. doi:10.1016/S0921-4526(01)00476-8
- A. B. Granovsky, I. V. Bykov, E. A. Gan’shina, V. S. Gushchin, M. Inoue, Y. E. Kalinin, A. A. Kozlov and A. N. Yurasov, “Magnetorefractive Effect in Magnetic Nanocomposites,” Journal of Experimental and Theoretical Physics, Vol. 96, No. 6, 2003, pp. 1104-1112. doi:10.1134/1.1591221
- A. V. Ivanov, Yu. E. Kalinin, V. N. Nechaev, A. V. Sitnikov, “Electrical and Magnetic Properties of [(CoFeZr)x- (Al2O3)1−x/(α-Si:H)]n Multilayer Structures,” Physics of the Solid State, Vol. 51, No. 12, 2009, pp. 2474-2479. doi:10.1134/S1063783409120087
- L. Förster, M. Karski, J. M. Choi, A. Steffen, W. Alt, D. Meschede, A. Widera, E. Montano, J. H. Lee, W. Rakreungdet and P. S. Jessen, “Microwave Control of Atomic Motion in Optical Lattices,” Physical Review Letter, Vol. 103, No. 23, 2009, pp. 233001-233005. doi:10.1103/PhysRevLett.103.233001
- V. G. Kravets, A. K. Petford-Long and A. F. Kravets, “Optical and Magneto-Optical Properties of (CoFe)x- (HfO21)1–x Magnetic Granular Films,” Journal of Applied Physics, Vol. 87, No. 4, 2000, pp. 1762-1768. doi:10.1063/1.372089
- E. Gan’shina, A. Granovsky, V. Gushin, M. Kuzmichev, P. Podrugin, A. Kravetz and E. Shipil, “Optical and Magneto-Optical Spectra of Magnetic Granular Alloys,” Physika A, Vol. 241, No. 1-2, 1997, pp. 45-51. doi:10.1016/S0378-4371(97)00057-5
- E. Gan’shina, M. Kochneva, M. Vashuk, A. Vinogradov, A. Granovsky, V. Guschin, P. Scherbak, Ch.-O. Kim and Ch. G. Kim, “Magneto-optical properties of Magnetic Nanocomposites,” The Physics of Metals and Metallography, Vol. 102, Suppl. 1, 2006, pp. S32-S35. doi:10.1134/S0031918X06140079
- H. Akinaga, M. Mizuguchi, T. Manado, E. Gan’shina, A. Granovsky, I. Rodin, A. Vinogradov and A. Yurasov, “Enhanced Magnetooptical Response of Magnetic Nanoclusters Embedded in Semiconductor,” Journal of Magnetism and Magnetic Materials, Vol. 242-245, 2002, pp. 470-472. doi:10.1016/S0304-8853(01)01067-8
- T. Fukumura, Y. Yamada, K. Tamura, K. Nakajima, T. Aoyama, A. Tsukazaki, M. Sumiya, S. Fuke, Y. Segawa, T. Chikyow, T. Hasegawa, H. Koinuma and M. Kawasaki, “Magneto-Optical Spectroscopy of Anatase TiO2 Doped with Co,” Japanese Journal of Applied Physics, Vol. 42, 2003, pp. 105-107. doi:10.1143/JJAP.42.L105
- E. Gan’shina, R. Kumaritova, A. Bogorodisky, M. Kuzmichov and S. Ohnuma, “Magneto-Optical Spectra of Insulating Granular System Co-Al-O,” Journal of Magnetism and Magnetic Materials, Vol. 203, No. 1, 1999, pp. 241-243. doi:10.1016/S0304-8853(99)00275-9
- T. V. Murzina, E. A. Gan’shina, V. S. Guschin, T. V. Misuryaev and O. A. Aktsipetrov, “Non-Linear Magnetooptical Kerr Effect and Second Harmonic Generation Interferometry in Co-Cu Granular Films,” Applied Physics Letters, Vol. 73, No. 25, 1998, pp. 3769-3771. doi:10.1063/1.122889
- E. A. Gan’shina, M. V. Vashuk, A. N. Vinogradoy, A. B. Granovsky, V. S. Gushchin, P. N. Shcherbak, Yu. E. Kalinin, A. V. Sitnikov, C.-O. Kim and C. G. Kim, “Evolution of the Optical and Magnetooptical Properties of Amorphous Metal-Insulator Nanocomposites,” Journal of Experimental and Theoretical Physics, Vol. 98, No. 5, 2004, pp. 1027-1036. doi:10.1134/1.1767571
- V. E. Buravtsova, V. S. Guschin, Yu. E. Kalinin, S. A. Kirov, E. V. Lebedeva, S. Phonghirun, A. V. Sitnikov, N. E. Syr’ev and I. T. Trofimenko, “Magnetooptical Properties and FMR in Granular Nanocomposites (Co84Nb14Ta2)x- (SiO2)100−x,” Central European Science Journals, Vol. 2, No. 4, 2004, pp. 566-578. doi:10.2478/BF02475564
- E. Gan’shina, K. Aimuta, A. Granovsky, M. Kochneva, P. Sherbak, M. Vashuk, K. Nishimura and M. Inoue, “Optical and Magneto-Optical Properties of Magnetic Nanocomposites FePt-SiO2,” Journal of Applied Physics, Vol. 95, No. 11, 2004, pp. 6882-6884. doi:10.1063/1.1687537
- V. A. Vyzulin, V. E. Buravtsova, V. S. Gushchin, E. A. Ganshina, E. V. Lebedeva, N. E. Syriev, S. Phonghirun, Yu. E. Kalinin and A. V. Sitnikov, “Magnetic and Magnetooptical Properties of Ferromagnetic-Ferroelectric Nanocomposites,” Bulletin of the Russian Academy of Sciences: Physics, Vol. 70, No. 7, 2006, pp. 1075-1078.
- G. S. Krinchik and V. S. Guschin, “Investigation of InterBand Transitions in Ferromagnetic Metals and Alloys by Means of Magnetooptical Method,” Journal of Experimental and Theoretical Physics, Vol. 56, 1969, pp. 1833- 1842.
NOTES
*This work was partly supported by the Russian Foundation for Basic Research and Russian Ministry of Education and Science (grant No. 16.516.12.6019).
#Corresponding author.