Advances in Bioscience and Biotechnology
Vol.1 No.3(2010), Article ID:2361,5 pages DOI:10.4236/abb.2010.13022
Molecular differences in genotroph forms of common wheat (Triticum aestivum L.) and their initial cultivars
![]()
1Institute of Cytology and Genetics, Novosibirsk, Russia;
2Institute of Plant Biology and Biotechnology, Almaty, Kazakhstan.
Email: levites@bionet.nsc.ru; carinamakh@mail.ru
Received 23 April 2010; revised 10 June 2010; accepted 17 June 2010.
Keywords: Common Wheat; Genotrophs; Epimutagens; DNA
ABSTRACT
By the modified ISSR-amplification method the comparison of the structural organization of enzyme loci in the initial common wheat cultivars and their genotrophs induced with epimutagens: plant niacin acid and niacin acid and its derivatives produced from β-picoline fraction of coal-tar pitch (niacin acid nitrile, isocinchomeronic and benzoic acids) was carried out. It is shown that niacin acid influence causes in genotrophs specific band appearance in PCR- profiles obtained on the DNA of enzyme loci. All these before mentioned epimutagens induced in limits of each genotroph differently directed changes in number and intensity of bands of PCR-profiles.
1. INTRODUCTION
In epigenetic investigations, a very important moment is induction of the alterations by means of epimutagens. The established epimutagen is 5-azacytidin causing cytosine demethylation in DNA and activation before inactive genes resulting in alteration of many morphological traits [1-5]. DNA status demethylated under 5-azacytidin action is able to be preserved during cell and sexual generations [1,2,4].
As it was shown earlier the epigenetic variability also could be induced by external factors such as nutrition. Leap changing in mineral nutrition of plantlets of different flax lines caused appearance of vigorous tall plants having augmented mass and size of seed and changed type of leaves pubescence [6-8]. Accrued alterations turned out hereditable and changed forms of flax plants had been called genotrophs [6-8]. Molecular investigations of flax genotrophs demonstrated that inheritable alterations of morphological traits were determined by means of alterations of quantity and structure of DNA in the cell nucleus [8,9].
Equally with 5-azacytidin in the capacity of mater which is able to induce inheritable alterations to row of sexual generations researchers also started to use niacin acid (NA) [10-12]. Treatment of spring common wheat (Triticum aestivum L.) plants of the cultivar Kazakhstanskya-126 (K-126) with NA solutions resulted in appearance of the wheat form Genotroph-1 (G-1) having changed morphophysiological traits, enhanced viability and heightened resistance to extreme environmental conditions in comparison with the initial cultivar [10,11]. In crossing of these plants and the initial cultivar in hybrids F1 the traits of changed plants were dominant. The traits of these changed wheat plants are stable and there were no reversion to the initial type during 65 studied generations. Relying on it, niacin acid may be referred to epimutagens. Appearance of similar forms having changed morphological traits was revealed in the treatment of the winter common wheat cultivar Bezostaya-1 (B-1) with NA; induced alterations have been inherited during 44 investigated generations (Bogdanova et al., unpublished data). In crossing of changed plants and the initial cultivar B-1, reciprocal hybrids F1 inherited genotrophs’ traits.
High prices of NA of natural origin and low biological activity of synthetic NA produced from the synthetic β-picolines led to necessity of producing as NA as its analogues and derivatives from the β-picoline fraction of coal-tar pitch which are characterized with high biological activity. In the capacity of such analogues the following substances were synthesized and used in our investigations: niacin acid amid, niacin acid nitrile, isocinchomeronic acid, benzoic acid and others [10,11]. When using these analogues, appearance of tall, long-spiked genotrophs after the repeated (2nd) treatment of seed from generation in generation was also noted. The genotrophs differed from the initial cultivar B-1 on morphological traits and grain shape [10].
Using biochemical traits for comparison of the cultivar K-126 and the form G-1 allowed us to reveal differences between them on glutamate oxaloacetate transaminase (GOT2): the appearance of additional isozymes was noted in G-1 [11,12]. These isozymes were revealed constantly during several generations of G-1.
The stability of the changed traits makes the induced forms interesting both for practical activities and theoretical researches. For more particular studying of epigenetic variability, it was a great interest to compare expression of enzyme loci and peculiarities of DNA structure of the initial cultivars and their genotrophs induced by niacin acid, niacin acid nitrile, isocinchomeronic and benzoic acids. To study DNA structure, the modified ISSR-amplification method is successfully used. In this case in the pair with the specific to marker enzyme gene primer, the microsatellite primer is used [13-15]. Due to this method which allows researching the DNA-sites including the marker enzyme gene, the differences between plants carrying the same allele of enzyme locus and also the differences in marker enzyme locus structure revealed in different tissues of the same plant are shown [13]. Exactly this approach was used in this research to investigate the genotroph forms of common wheat.
2. MATERIALS AND METHODS
Objects of investigation: the spring common wheat cultivar Kazakhstanskaya-126 (K-126) and derived on its base the form Genotroph-1 (G-1) induced with plant niacin acid; the winter common wheat cultivar Bezostaya-1 (B-1) and derived on its base three genotrophs G-142/96, G-143/96 и G-145/96 induced with niacin acid and its derivatives produced from β-picoline fraction of coal-tar pitch (niacin acid nitrile, isocinchomeronic acid and benzoic acid) [10].
For genotrophs’ obtaining seed of K-126 and B-1 were treated with 0.01% solution of inducing agent during 24 hs at 25-30ºC with following spraying of vegetative plants with 0.1% solution of inducing agent at the stages of tillering, blooming and seed ripening. G-1 was obtained after niacin acid treatment; G-142/96—niacin acid nitrile treatment, G-143/96—isocinchomeronicacid treatment and G-145/96—benzoic acid treatment. Plants grown from dry seed and from seed preliminary soaked in water were control variants [10].
Researches were carried out using seed produced by self-pollination of isolated spikes of individual plants and also using plantlets.
For revelation of polymorphism of PCR-profiles of wheat plants the modified ISSR-amplification method was used. In this case in the pair with the microsatellite primer the specific primer was used [13-15]. Using available in Internet DNA sequences of wheat we selected primers for enzyme loci controlling: alcohol dehydrogenase (ADH1), malic-enzyme (ME1) and glutamate oxaloacetate transaminase (GOT1). All selected primers had got oncoming orientability. Mic2 (5’-gacagacaga-cagac-a-3’) was used as a microsatellite primer. Each specific primer was used for PCR in the pair with the microsatellite primer.
DNA extraction, PCR-amplification. Total plant DNA was extracted from plantlets by means of CTAB-method [16].
For PCR-amplification in the pair with the micro- satellite primer mic2 the following specific primers were used: 1) adh1 (direct orientation) and adh2 (inverse orientation), which are specific to locus Adh1; 2) malic1 (direct orientation) and malic2 (inverse orientation), which are specific to locus Me1; 3) got1 (direct orientation) and got2 (inverse orientation), which are specific to locus Got1.
The primers having direct orientation allowed us to amplify a structural part of gene while the primers having inverse orientation allowed us to analyze its 5’- regulatory region of gene.
PCRs were carried out in 20 µl of reaction mixture containing 100-200 ng of total DNA, 65 мМ tris-HCl (pH 8.0), 16 мМ (NH4)2SO4, 0.05% twin-20, 1.5 мМ MgCl2, 0.2 мМ of each dNTP, 1 mcM of each primer, 2.5 units of activity of Taq-polymerase. The following temperature regime was used:
Preliminary denaturation – 94ºС (4 min);
Then 30 cycles – 94ºС (1 min), 52ºС (42 sec), 72ºС (4 min);
Last cycle – 72ºС (7 min).
The amplification products were separated in 5% polyacrylamide gel (0.5 x TBE buffer) and then were dyed with ethidium bromide.
The electrophoregrams of the PCR-profiles were scanned using Biodoc2 device.
3. RESULTS AND DISCUSSION
Isozyme analysis of alcohol dehydrogenase (ADH) showed no differences between the initial cultivar K-126 and the line G-1. To determine differences between these forms at the genome level we used the modified ISSRamplification method. Whereas the changes can take place as in the structural as in the regulatory part of the locus, in the pair with the microsatellite primer, differently directed specific primers were used. Primer adh1 (direct orientation) determines the amplification of the structural part of the gene, while primer adh2 (reverse orientation) allows us to get the profiles of the 5'-regulatory area. The PCR-profiles obtained from the cultivar K-126 and from the line G-1 are presented in Figure 1. One can see that the pair of primers adh1 and mic2 reveals the specific band ~240 n.p. in G-1 (Figure 1, 7, 9, 11).
Thus, having absence of differences in ADH1 isozyme spectra, we can observe the distinct difference between the initial cultivar K-126 and the line G-1 at the level of DNA structure.
The similar approach to use of the differently directed specific primers for the modified ISSR-amplification was applied to research locus Me1 controlling malicenzyme. It was shown that the pair of primers malic1 and mic2 reveals the specific band ~100 n.p. in G-1 (Figure 2, 7, 9, 11).
And also the PCR-profiles obtained with the use of the primer got1, specific to the locus Got1 controlling glutamate oxaloacetate transaminase-1, in the pair with mic2 turned out to be informative. These primers amplify the structural part of the gene Got1 and, on DNA of G-1 they produce the specific band ~720 n.p. (Figure 3, 4-6). The pair of primers got2 and mic2 determining the amplification of the regulatory 5’-area showed no differrences between the initial cultivar K-126 and the line G-1.
It is significant that, among all investigated loci all the PCR-profiles of the genotroph plants are uniform and, in
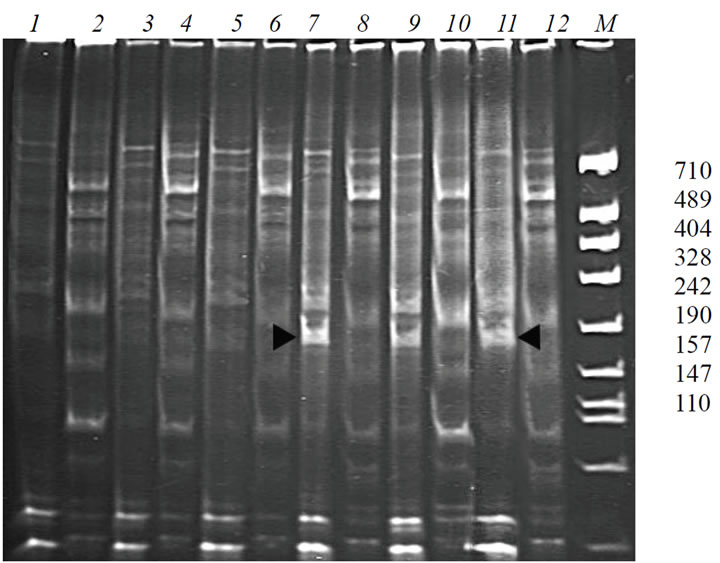
Figure 1. PCR-profiles obtained from the plants of K-126 and G-1, using primers which are specific to the locus Adh1 (adh1— direct orientation, adh2—inverse orientation), in the pair with the microsatellite primer mic2. 1, 3, 5 – cultivar K-126, primers adh1 and mic2; 2, 4, 6 – cultivar K-126, primers adh2 and mic2; 7, 9, 11 – G-1, primers adh1 and mic2; 8, 10 – G-1, primers adh2 and mic2.
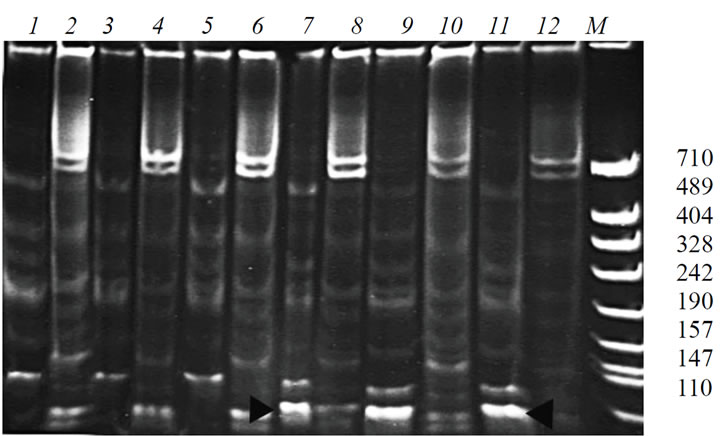
Figure 2. PCR-profiles obtained from the plants of the cultivar K-126 and from the line G-1, using the primers which are specific to the locus controlling malic-enzyme (malic1 – direct orientation, malic2 – inverse orientation), in the pair with the microsatellite primer mic2. 1, 3, 5 – cultivar K-126, primers malic1 and mic2; 2, 4, 6 – cultivar К-126, primers malic2 and mic2; 7, 9, 11– G-1, primers malic1 and mic2; 8, 10, 12 – G-1, primers malic2 and mic2.
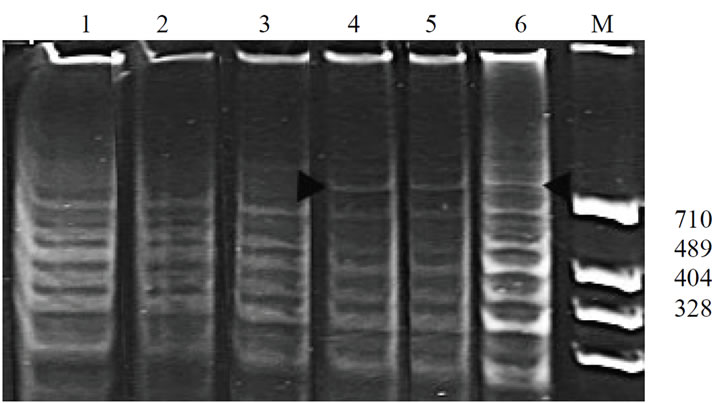
Figure 3. PCR-profiles obtained from the plants of the cultivar K-126 and the line G-1 using primers: got1 (direct orientation), specific to the locus controlling glutamate oxaloacetate transaminase-1, in the pair with the microsatellite primer mic2. 1-3 – cultivar K-126; 4-6 – G-1.
each investigated locus, the genotrophs have got the specific band.
The variability of enzyme loci was also investigated in the genotrophs obtained from the initial winter common wheat cultivar Bezostaya-1 (B-1) using other epimutagens: niacin acid nitrile (G-142/96), isocinchomeronic acid (G-143/96) and benzoic acid (G-145/96). In the genotrophs obtained from this cultivar by means of the before-mentioned epimutagens, an absolutely different picture of the enzyme loci variability was revealed.
The PCR-profiles of the locus Adh1 in the plants of the initial cultivar were identical while in the genotrophs one could see some variation of both quantity and intensity of the bands (Figure 4).
The locus Me1 has got slightly different reaction on
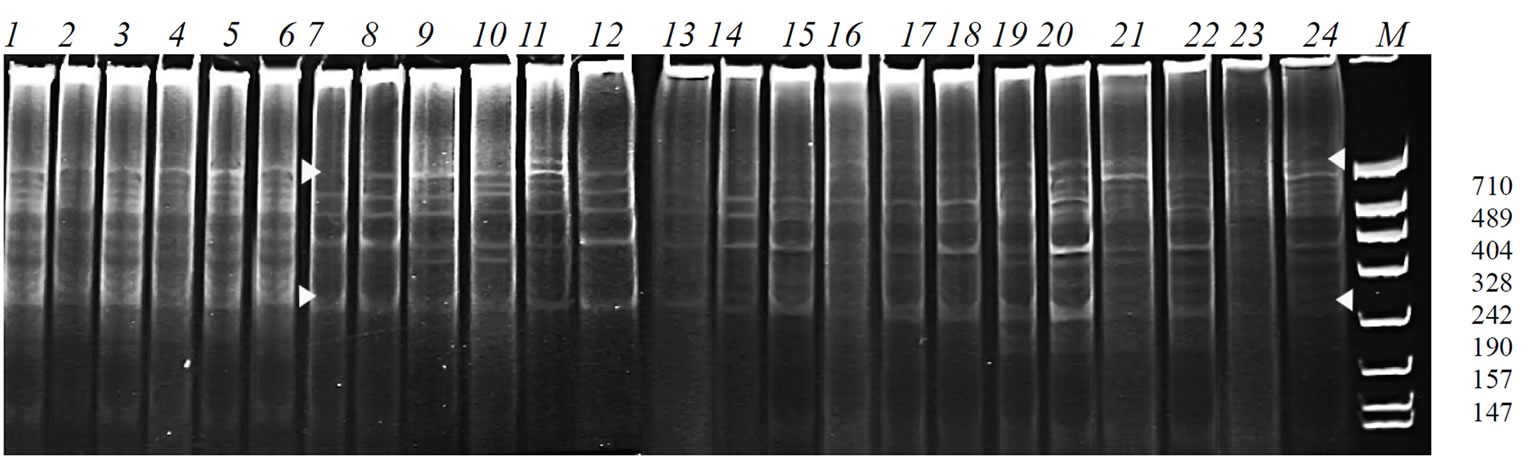
Figure 4. PCR-profiles obtained from the plants of the cultivar B-1 and its genotrophs using the primers: adh1 (specific to the locus Adh1) and mic2 (microsatellite primer.) 1-6 – cultivar B-1; 7-12 – G-142/96; 13-18 – G-143/96; 19-24 – G-145/96.
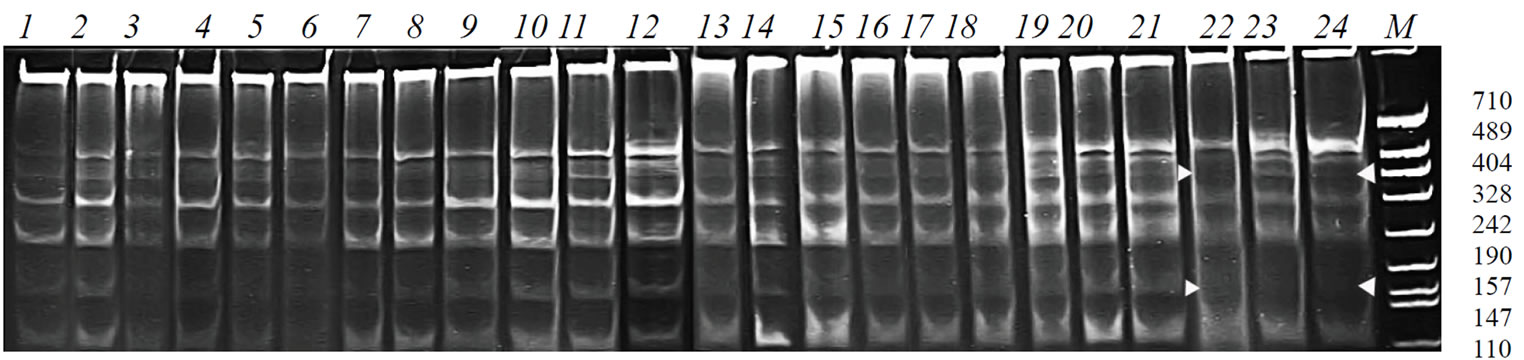
Figure 5. PCR-profiles obtained from the plants of the cultivar B-1 and its genotrophs using the primer malic1, which is specific to the locus Me1, and the microsatellite primer mic2. 1-6 – cultivar B-1; 7-12 – G-142/96; 13-18 – G-143/96; 19-24 – G-145/96.

Figure 6. PCR-profiles obtained from the plants of the cultivar B-1 and its genotrophs using the primers got1, specific to the locus Got1, and mic 2, microsatellite primer. 1-6 – cultivar B-1; 7-12 – G-142/96; 13-18 – G-143/96; 19-24 – G-145/96.
the epimutagen influence. The alterations were revealed not in all genotrophs. The PCR-profiles of G-142/96 (Figure 5, 7-12) and G-143/96 (Figure 5, 13-18) resemble the profiles of the initial cultivar, and the profiles of G-145/96 (Figure 5, 19-24) demonstrate some differences from the control variants.
The structure of locus Got1 also changed under the epimutagen influence. Profiles of G-142/96 are identical (Figure 6, 7-12) but they are different from the control variant. The PCR-profiles of G-143/96 (Figure 6, 13-18) and G-145/96 (Figure 6, 19-24) have got ranges of bands’ intensity, and that G-143/96 mostly differs from the control variant.
The information of all PCR-profiles described in our work is presented in the Table 1.
As you can see from the table the plant niacin acid acts in a specific way, causing the appearance of a definite band in each out of the investigated enzyme loci (Genotroph-1).
4. CONCLUSIONS
Thereby, the epimutagen influence results in hereditary variability in the plant genome. All the investigated genotrophs have got at least about 40 generations of the reproduction and carry induced morphological altera tions. This investigation has shown that the base of the stability of morphological alterations is the changes at the level of the DNA organization structure reproducing

Table 1. PCR-profiles described in the investigation.
in the row of sexual generations. The character of the revealed DNA alterations depends on the used epimutagen and the researched enzyme locus. The influence of both niacin acid and its analogues in plants activates the appearance of changes in the structural part of the investigated enzyme loci. Though only the influence of niacin acid causes the appearance of the specific band in the PCR-profile. The before-mentioned abiotic epimutagens act different-directly causing the alterations of quantity and intensity of bands of the PCR-profile. Such diverse plants’ reaction to the influence of the abiotic epimutagens, synthesized from β-picoline fraction of coal-tar pitch, has testified that there are no specific acceptor zones for them. As it was shown before, at the morphological level, niacin acid nitrile induces the appearance of the homotypic tall and long-spiked genotrophs, while isocinchomeronic acid and benzoic acid induce the appearance of different types of morphological alterations at the level of each genotroph [10]. This statement well conforms to the data about significant variation of DNA changes in genotrophs obtained with the use of before-mentioned epimutagens. Thus, genome answer ambiguity of plants on influence of the epimutagens, synthesized from β-picoline fraction of coal-tar pitch manifests itself at the level of morphological traits just as at the level of DNA genome. In contrast with it, the epimutagen of plant origin (plant niacin acid) acts in a specific way, causing the appearance of a definite band in each out of the investigated enzyme loci. This specificity points to that natural metabolites (in particular plant niacin acid) have their specific areas of the influence on the genome.
5. ACKNOWLEDGEMENTS
Investigations of Russian researchers were performed in frames of Integration Project #99 for 2009-2011, supported by Siberian Branch of Russian Academy of Sciences.
REFERENCES
- Jones, P.A. (1985) Altering gene expression with 5-azacytidine. Cell, 40(3), 485-486.
- Jablonka, E. and Lamb, M.J. (1989) The inheritance of acquired epigenetic variations. Journal of Theoretical Biology, 139(1), 69-83.
- Heslop-Harrison, J.S. (1990) Gene expression and parental dominance in hybrid plants. Development, 108, 21-28.
- Janousek, B., Siroky, J. and Vyskot, B. (1996) Epigenetic control of sexual phenotype in dioecious plant, Melandrium album. Molecular & General Genetics, 250(4), 483-490.
- Maletskaya, E.I., Yudanova, S.S., Maletskii, S.I. (2006) Effect of the epimutagen 5-azacytidine on the structure of floral-stalk metameres in sugar beet Beta vulgaris L. Russian Journal of Genetics, 42(7), 939-946.
- Durrant, A. (1962) The environmental induction of heritable in Linum. Heredity, 17, 27-61.
- Durrant, A. and Timmis, J.N. (1973) Genetic control of environmentally induced changes in Linum. Heredity, 30 (3), 369-379.
- Cullis, C.A. (1973) DNA differences between flax genotrophs. Nature. 243(5409), 515-516.
- Oh, T.J. and Cullis, C.A. (2003) Labile DNA sequences in flax identified by combined sample representational difference analysis (csRDA). Plant Molecular Biology, 52(3), 527-536.
- Bogdanova, E.D. (1992) Wheat genetic variability induced with nicotinic acid and its derivatives. Thesis of Dr. Sci (biol.): 03.00.15. Institute of Cytology and Genetics SB RAS, Novosibirsk, 231.
- Bogdanova, E.D. (2003) Epigenetic variation induced in Triticum aestivum L. by nicotinic acid. Russian Journal of Genetics, 39(9), 1221-1227.
- Bogdanova, E.D., Levites, E.V. and Makhmudova K.Kh. (2009) Marker traits of variability induced in Triticum aestivum L. by nicotinic acid. Russian Journal of Genetics, 45(3), 308-312.
- Vinichenko, N.A., Kirikovich, S.S. and Levites E.V. (2006) The genetic instability of the Adh1 locus alleles in sugar beet agamospermous progeny. Sugar Technology, 8(4), 288-291.
- Vinichenko, N.A., Kirikovich, S.S. and Levites E.V. (2007) Tissue distinctions in the organization of sugar beet locus Adh1. Achievements and Problems of Genetics, Breeding and Biotechnology (Collection of Paper), Kiev: “Logos”, 2, 247-251.
- Vinichenko, N.A., Kirikovich, S.S. and Levites E.V (2008) Polymorphism of PCR profiles and expression of alleles at the locus Adh1 in agamospermous progeny of sugar beet Beta vulgaris L. Russian Journal of Genetics, 44(9), 1092-1095.
- Doyle, J.J. and Doyle, J.L. (1987) A rapid DNA isolation procedure for small quantities of fresh leaf tissue. Phytochemical Bulletin, 19, 11-15.